
- Contact Us:
-

-

-

-


Daily Market Updates
03 Apr 2024
EURUSD
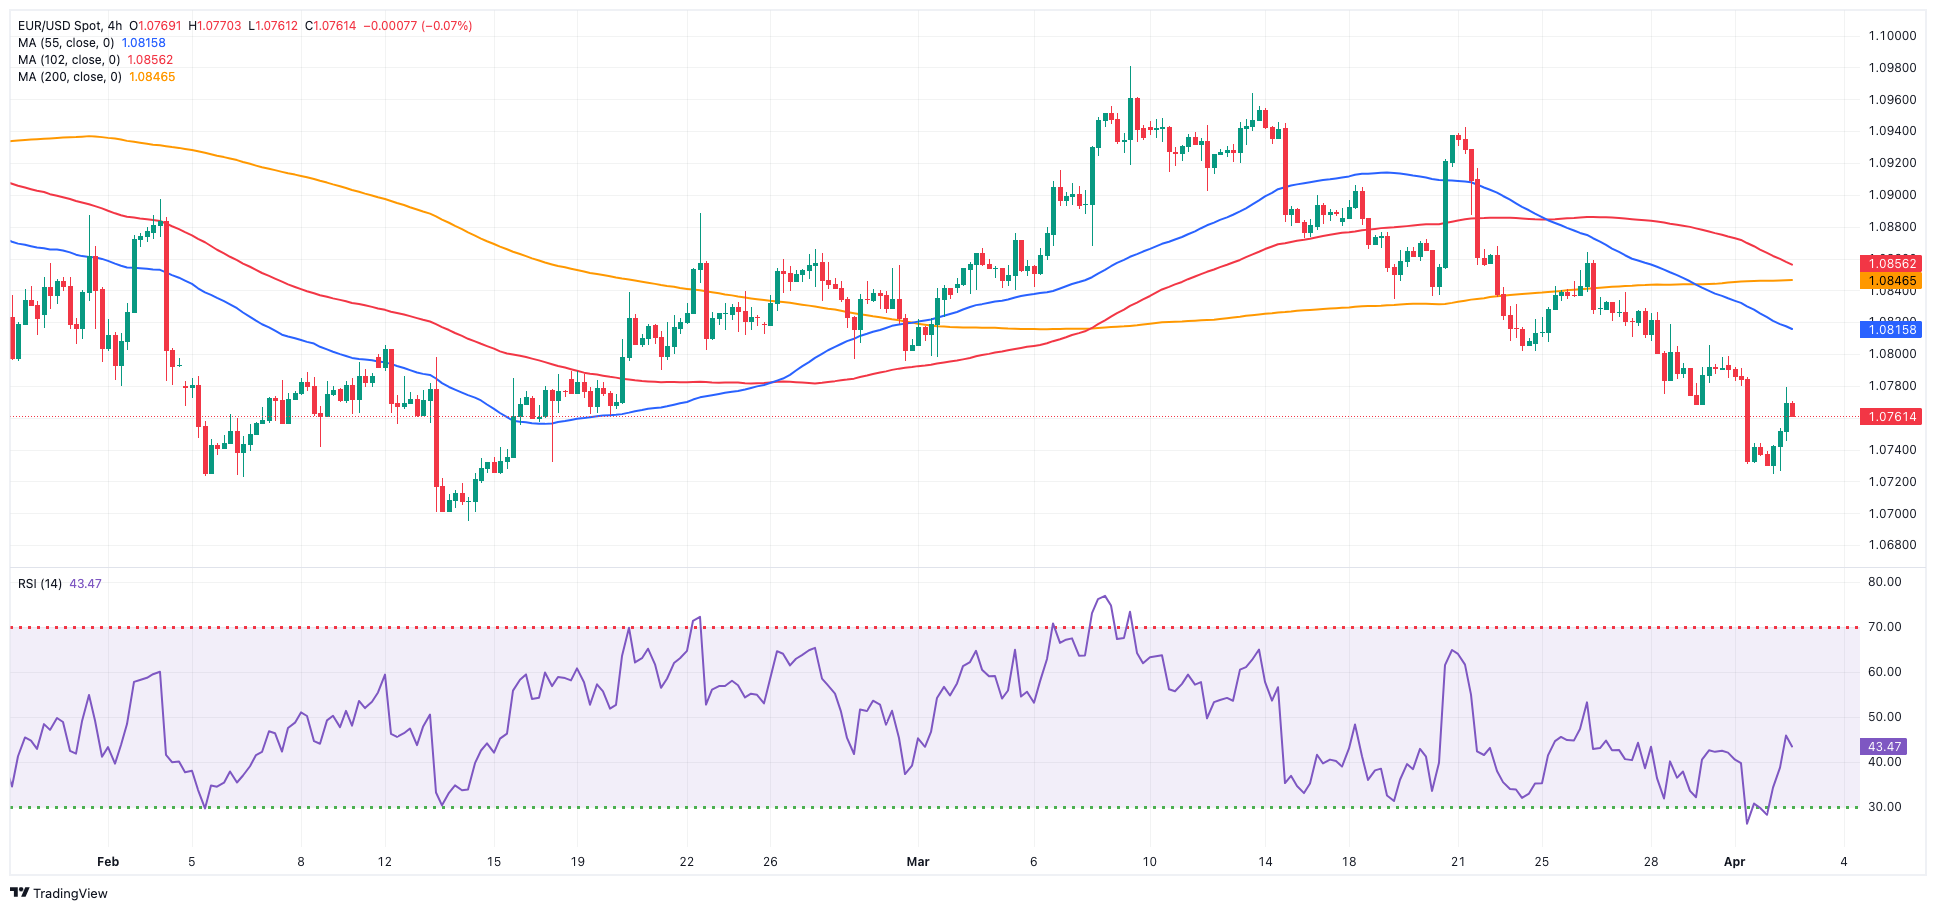
After bottoming out in the area of two-month lows near 1.0720, EUR/USD embarked on a corrective upside, which eventually lifted it to the vicinity of 1.0780 on turnaround Tuesday.
The pair’s recovery came hand-in-hand with some fresh bouts of selling pressure in the greenback, which prompted the USD Index (DXY) to abandon the zone of new multi-month peaks around 105.10 recorded early in the session.
In line with the uptick in spot emerged a marked bounce in German 10-year bund yields past 2.40%, in line with their US peers.
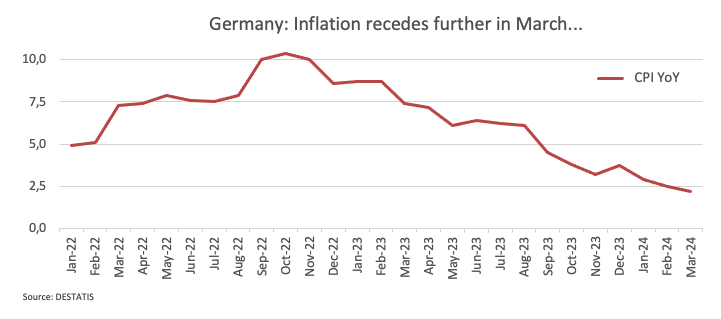
Data-wise, in the euro area, Germany’s flash inflation figures saw the CPI rise by 2.2% in March and 0.4% from a month earlier. Still in Germany, the final Manufacturing PMI came in at 41.9 during the last month and 46.1 when it came to the broader Euroland.
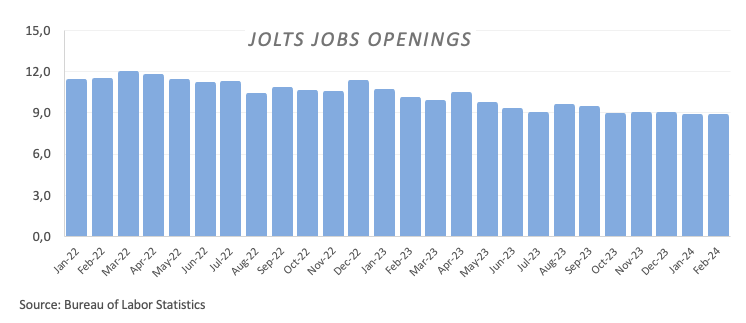
Across the Atlantic, Factory Orders rose by 1.4% MoM in February, and JOLTs Job Openings increased to 8.756M in the same month.
EUR/USD may fall further, reaching its 2024 low of 1.0694 (February 14). A deeper drop could expose the weekly low of 1.0495 (October 13, 2023), which comes before the 2023 low of 1.0448 (October 3) and the round milestone of 1.0400. Instead, the initial up-block is at the crucial 200-day SMA at 1.0834, which precedes the March high of 1.0981 (March 8) and the weekly high of 1.0998 (January 5, 2011), reinforcing the psychological 1.1000 barrier. The breakout of this zone may put pressure on the December 2023 top of 1.1139 (December 27), which is still supported by the 200-week SMA of 1.1146 and occurs before the 2023 high of 1.1275 (July 18). The daily RSI rose down to about 34.
Resistance levels: 1.0845 1.0864 1.0942 (4H chart)
Support levels: 1.0724 1.0694 1.0656 (4H chart)
USDJPY
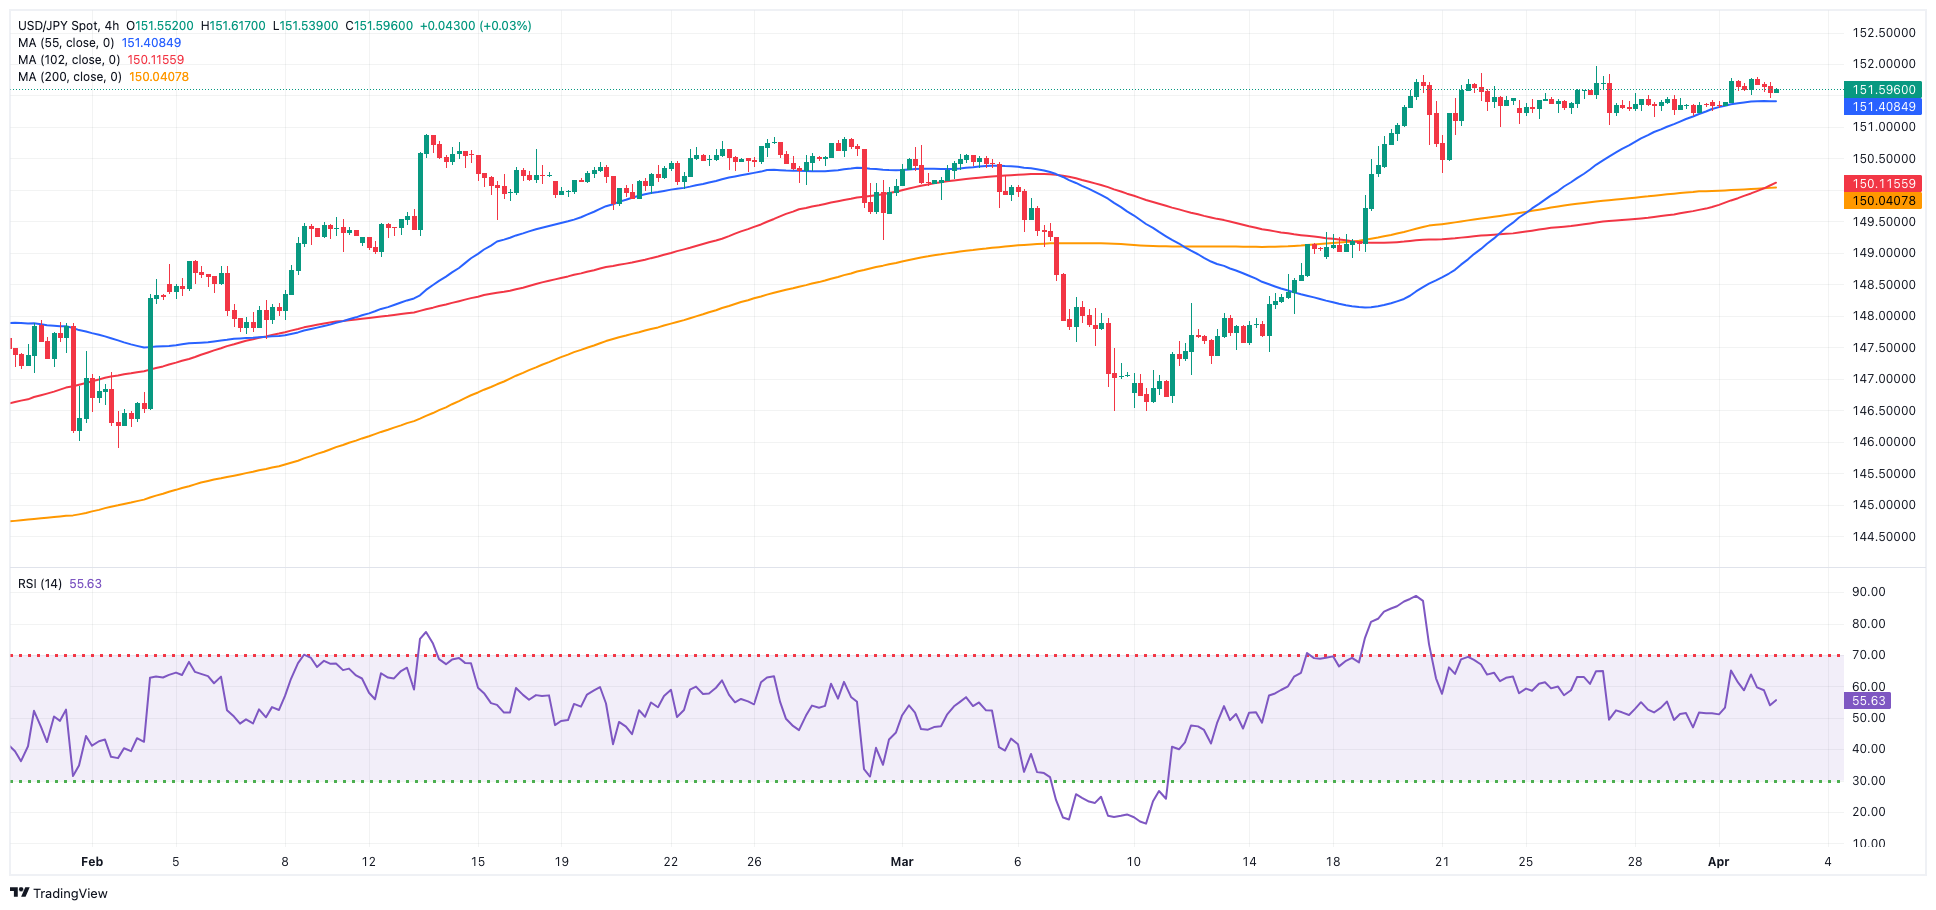
Further consolidation left USD/JPY hovering around its comfort zone near 151.50 on Tuesday.
Indeed, price action in the pair came in tandem with the renewed offered stance in the greenback, which at the same time contrasted with the marked rebound in US yields in the belly and the long end of the curve, while JGB 10-year yields rose to multi-day highs near 0.75%.
In the meantime, investors are expected to maintain their prudence bias, as the spectre of potential FX intervention is seen lingering as long as spot trades close to the 152.00 region.
Regarding this issue, finmin Suzuki recently voiced worries regarding the swift shifts in FX rates. He linked the yen's recent depreciation to speculative actions. Suzuki indicated that all possibilities are being considered to address disorderly FX fluctuations and underscored the vigilant observation of FX trends with increased urgency, pledging suitable reactions to such occurrences.
There were no data releases scheduled in “The Land of the Rising Sun” on Tuesday.
USD/JPY faces an immediate upward barrier at the 2024 high of 151.97 (March 27), just above the round number of 152.00. In contrast, the pair is expected to find temporary support near the 55-day and 100-day SMAs of 149.40 and 147.67, respectively, before reaching the crucial 200-day SMA of 146.95 and the March low of 146.47 (March 8). A breakdown of this zone might lead to a return to the February low of 145.89 (February 1), which comes before the December 2023 low of 140.24 (December 28), the round number 140.00, and the July low of 137.23 (July 14). The daily RSI eased below 64.
Resistance levels: 151.77 151.97 155.80 (4H chart)
Support levels: 151.02 150.26 150.03 (4H chart)
GBPUSD
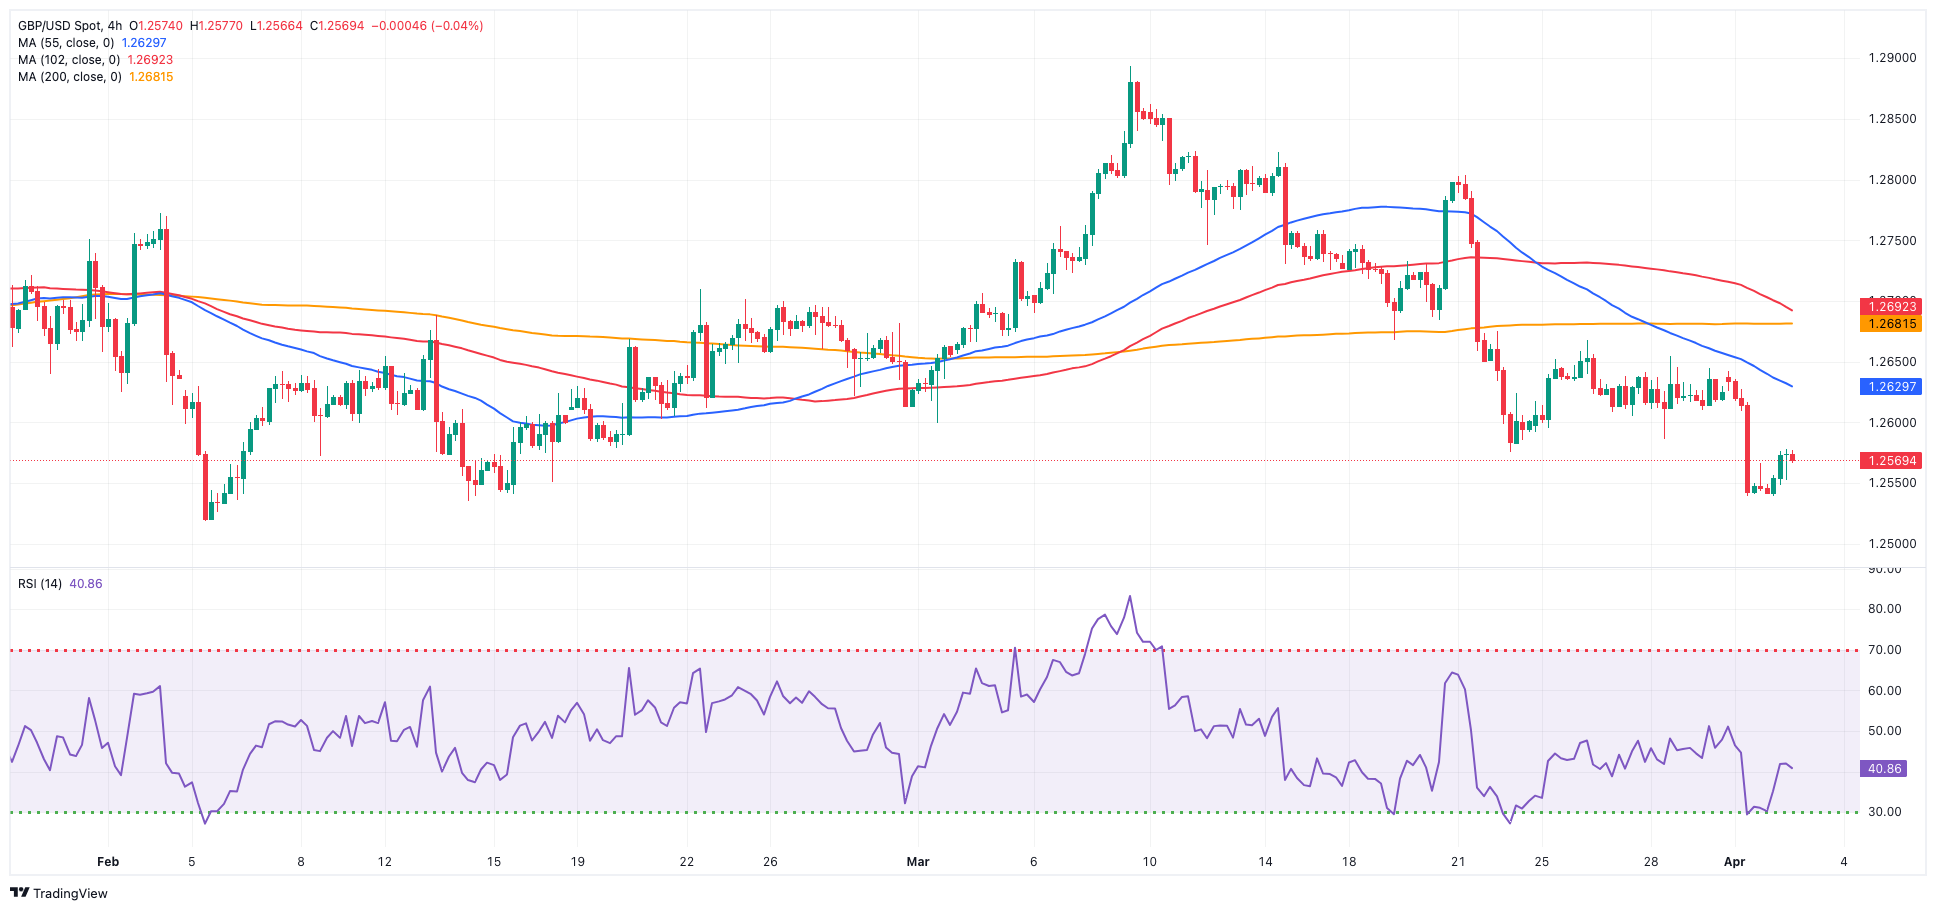
GBP/USD managed to regain the smile and reverse three consecutive daily pullbacks on Tuesday, this time bouncing off multi-week lows in the 1.2540-1.2535 band.
The corrective move in Cable was accompanied by renewed downside pressure in the greenback, which returned to the negative zone soon after the USD Index (DXY) reached new highs in levels last seen in early November.
Across the Channel, Housing Prices tracked by Nationwide rose by 1.6% YoY in March and contracted by 0.2% vs. the previous month. Additional data saw the final Manufacturing PMI at 50.3 in March, Mortgage approvals increase by 60.383K, and Mortgage Lending rise by £1.51B, both in February.
Extra retracements may cause GBP/USD to return the 2024 low of 1.2518 (February 5) before the December 2023 low of 1.2500 (December 13). A deeper decline would not find significant support until the weekly low of 1.2187 (November 10, 2023), which comes before the October 2023 low of 1.2037 and the main 1.2000 line. On the contrary, there is interim barrier at the 100-day and 55-day SMAs at 1.2652 and 1.2672, respectively, prior to the 2024 high of 1.2893 (March 8), followed by the weekly high of 1.2995 (July 27, 2023), and the critical 1.3000 level. The daily RSI rebounded past 38.
Resistance levels: 1.2667 1.2680 1.2803 (4H chart)
Support levels: 1.2539 1.2518 1.2500 (4H chart)
GOLD
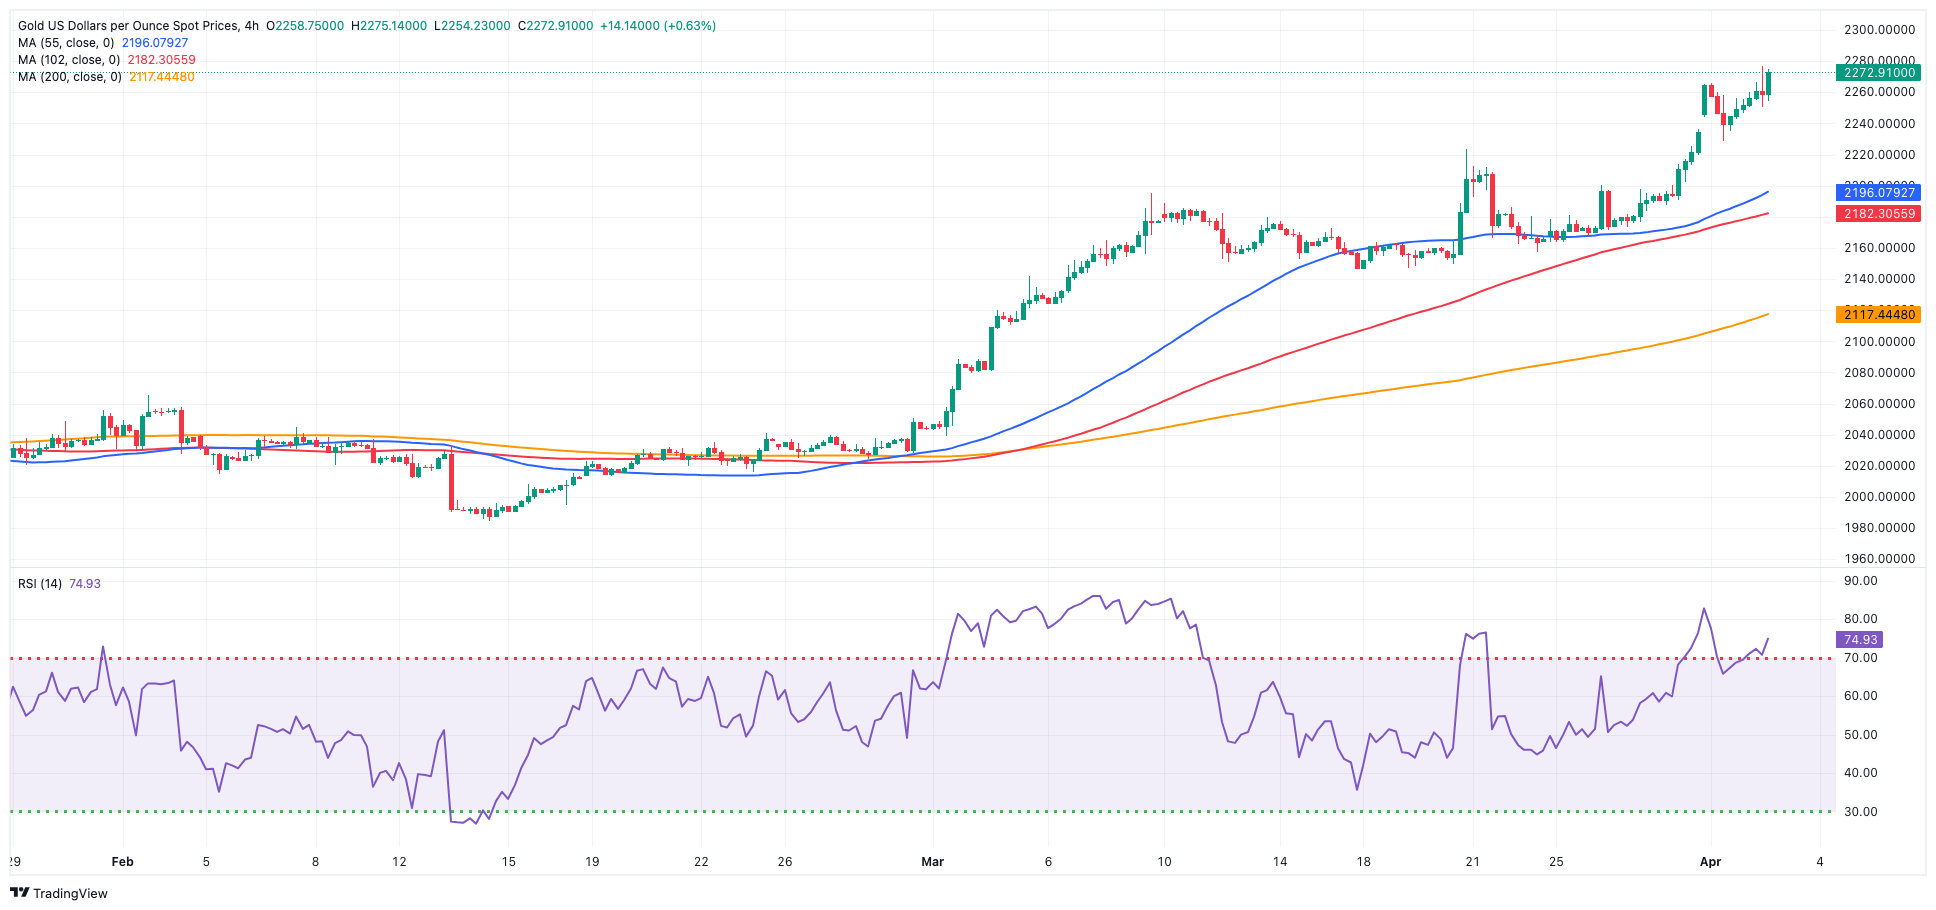
Another day, another record top for the precious metal.
Indeed, Gold prices rose to an all-time high just cents below the $2,280 mark per troy ounce on Tuesday, always on the back of omnipresent geopolitical tensions.
In fact, a safe-haven demand prevailed among traders in response to the Israeli attacks on Iran’s embassy in Syria.
The rally in the yellow metal clinched its sixth consecutive session on Tuesday, and it was also propped up by the renewed downside pressure in the dollar as well as mixed US yields across the curve.
Gold faces immediate resistance above its all-time high of $2,277 (April 2). On the downside, the weekly low of $2,146 (March 18) takes first place, followed by the preliminary 55-day and 100-day SMAs of $2,084 and $2,056, respectively. Further south is the 2024 low of $1,984 (February 14), which appears to be supported by the proximity of the 200-day SMA ($1,991). Once the latter is addressed, a possible visit to the December 2023 low of $1,973 might begin before the November 2023 low of $1,931. The failure in this region may cause the yellow metal to test its October 2023 bottom of $1,810, followed by the 2023 low of $1,804 and the critical $1,800 conflict zone.
Resistance levels: $2,277 (4H chart)
Support levels: $2,228 $2,197 $2,157 (4H chart)
CRUDE WTI
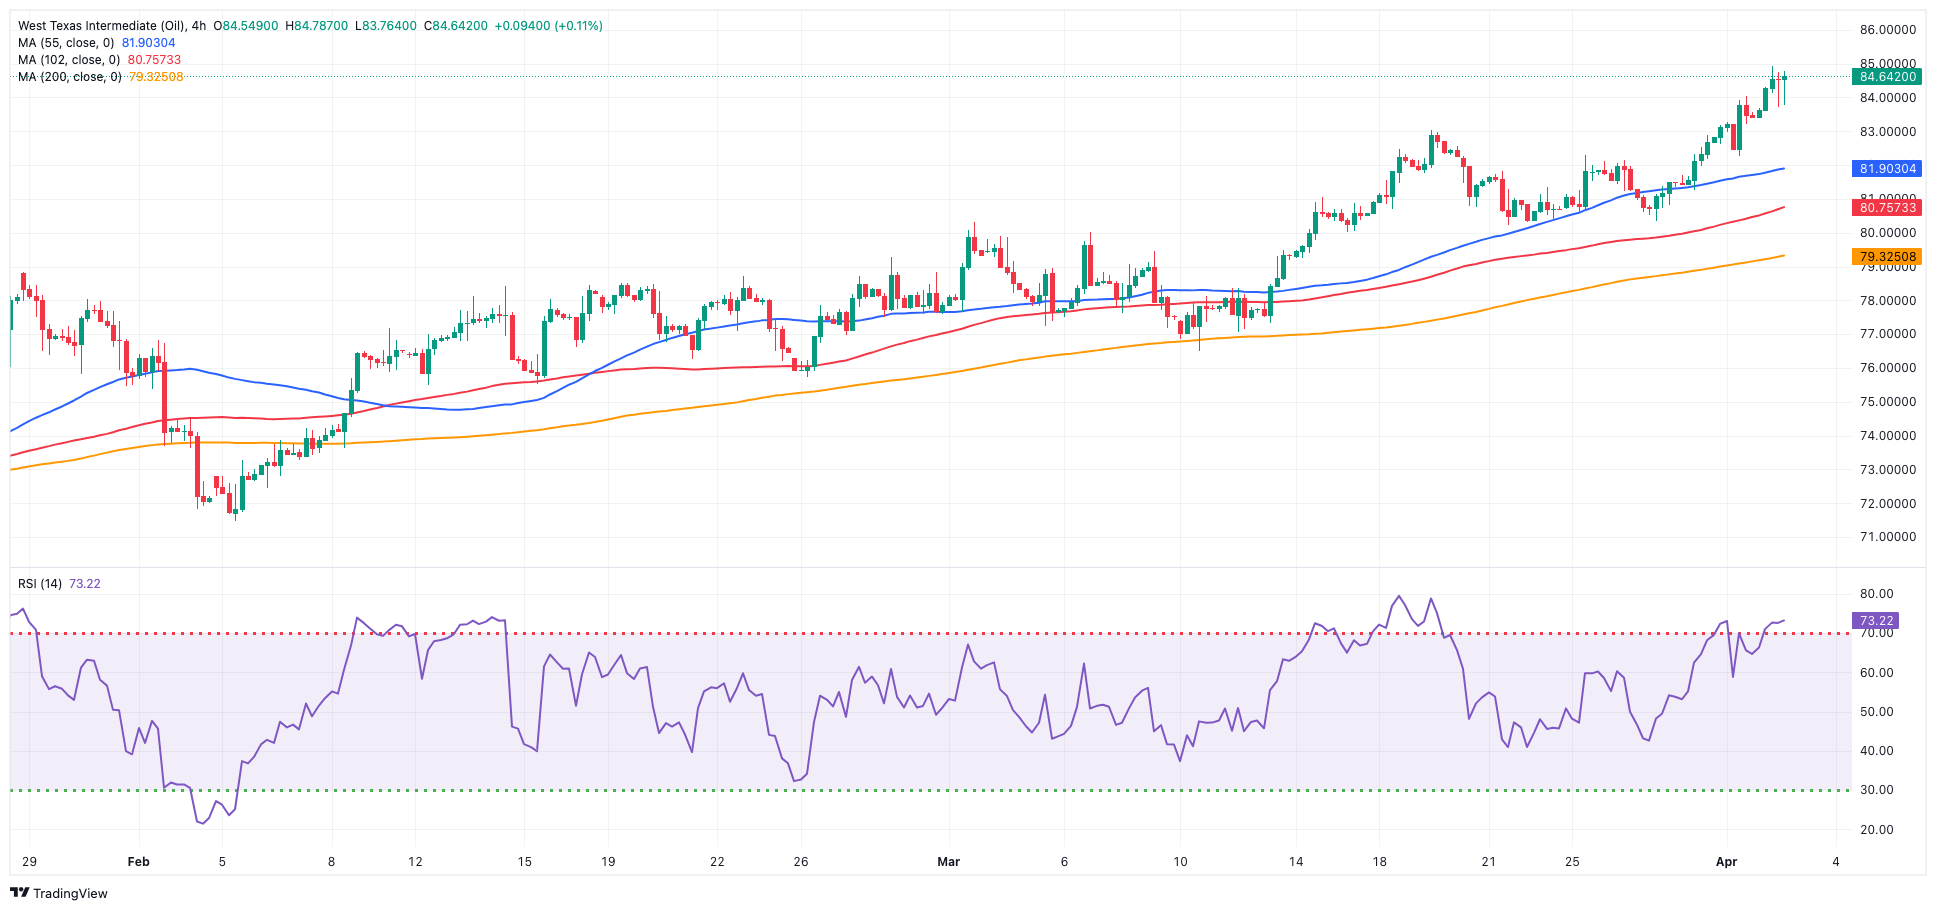
WTI prices climbed to fresh tops north of the $85.00 mark per barrel for the first time since late October on Tuesday, clinching its fourth session in a row of gains.
As traders continued to digest auspicious results from the Chinese manufacturing sector released over the weekend, rising geopolitical effervescence in the Middle East and the Russia-Ukraine war also contributed to the uptrend in crude oil prices in the first half of the week.
Furthermore, the increase in crude oil prices was reinforced by the renewed emergence of worries regarding tight supply conditions. These concerns were fueled by the anticipation that the OPEC+ alliance of producers would uphold its existing production cuts.
The next upward challenge for WTI is the 2024 peak of $85.42 (April 2), which precedes the weekly high of $89.83 (October 18, 2023) and the 2023 top of $94.99 (September 28, 2023). Further north, the weekly peak of $97.65 (August 30) falls just shy of the psychological $100.00 level. On the flip side, the 200-day SMA should provide some contention at $78.91, prior to the February low of $71.43 (February 5) and the critical $70.00 milestone. Extra losses might push prices over the 2024 low of $69.31 (January 3) and ahead of the December 2023 low of $67.74 (December 13).
Resistance levels: $85.42 $85.85 $89.82 (4H chart)
Support levels: $82.58 $80.51 $79.56 (4H chart)
GER40
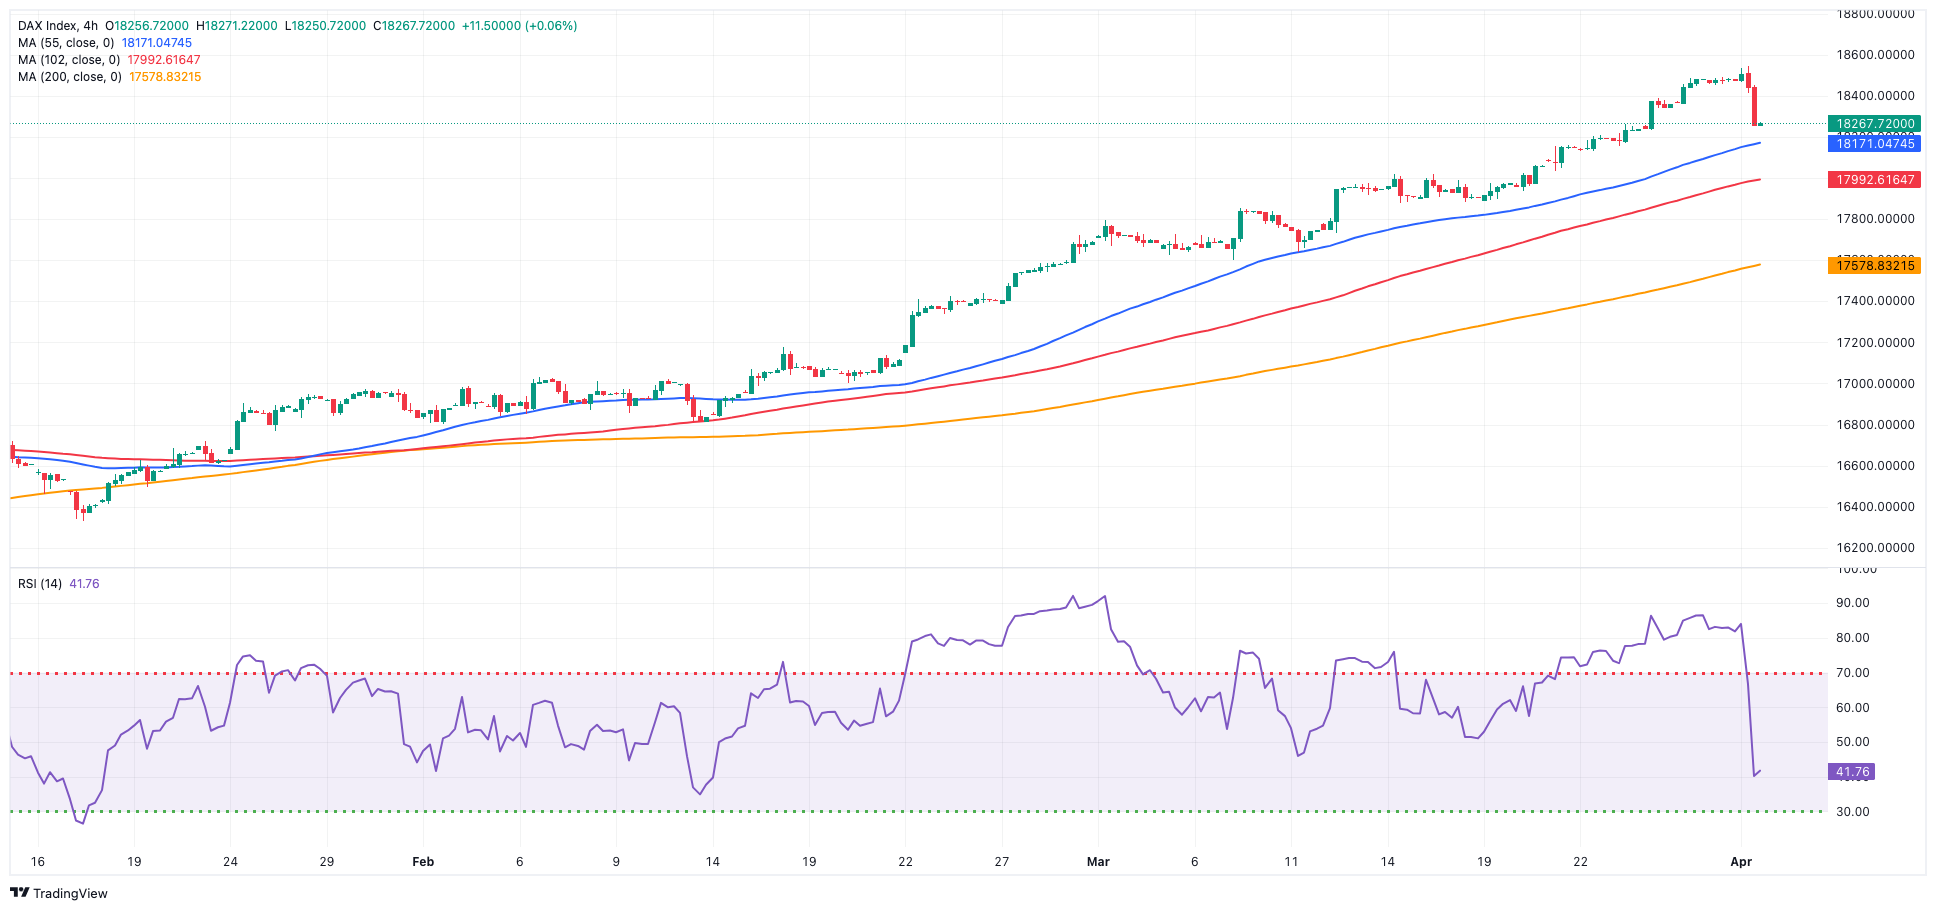
The sharp rally in Germany’s reference DAX40 was finally interrupted after eight consecutive sessions of gains on Tuesday, although not before printing an all-time peak near 18,600.
In fact, European stocks began the second quarter on a pessimistic note, influenced by declines in healthcare shares, while investors carefully analyzed inflation data from Germany, seeking insights into the potential timing of interest rate cuts by the ECB ahead of Wednesday’s release of advance inflation data in the broader Euroland.
Also weighing on market sentiment, German 10-year bund yields rose markedly to the 2.40% region, the highest level in several days.
The DAX40's next level of resistance is the record high of 18,567 (April 2). Having said that, the 55-day SMA of 17,378 should offer temporary support before the February low of 16,821 (February 1). A drop below this level might bring the index to its 2024 low of 16,345 (January 17), ahead of the important 200-day SMA of 16,276. After breaking below the latter, the weekly low of 15,915 (November 28) might be tested, followed by the October low of 14,630 (October 23) and the 2023 bottom of 14,458 (March 20). The daily RSI dropped below 70 for the first time since late February.
Best Performers: Siemens Energy AG, BASF, Henkel VZO
Worst Performers: Vonovia, Merck, Sartorius AG VZO
Resistance levels: 18,567 (4H chart)
Support levels: 18,275 18,056 17,739 (4H chart)
GBPJPY
The resurgence of buying interest in the British pound helped GBP/JPY regain some composure and reverse many sessions of losses on Tuesday.
In fact, the dollar’s weakness lent much-needed legs to the risk complex and bolstered the bounce in the cross, while further side-lined trading around the Japanese yen also contributed to the daily gains.
So far, the downside in the cross appears well contained around the 190.00 region, while the yearly tops in the mid-193.00s seem to limit the upside potential for the time being.
Further losses could push GBP/JPY to the 55-day SMA at 189.36, ahead of the March low of 187.96 (March 11) and the temporary 100-day SMA at 187.00. Once the latter is cleared, the cross may target the February low of 185.22 (February 1), which is just above the key 200-day SMA of 184.97. A deeper retracement might bring the December 2023 low of 178.33 (December 14) back into view, before the October 2023 low of 178.03 and the July 2023 low of 176.31 (July 28). In the other direction, the immediate up-barrier is the 2024 top of 193.53 (March 20), seconded by the August 2015 peak of 195.28 (August 18) and the record high of 195.88 (June 24, 2015). The RSI rebounded beyond 51.
Resistance levels: 191.67 193.53 195.28 (4H chart)
Support levels: 190.04 189.54 187.98 (4H chart)
NASDAQ
In line with the rest of the US markets, the tech benchmark Nasdaq 100 deflated to multi-day lows and challenged the 18,000 region on turnaround Tuesday.
Further weakness in the tech sector came in response to the extra gains in US yields, particularly in the belly of the curve, which hurt rate-sensitive growth companies such as Nvidia, Microsoft, and Amazon.com.
Additionally, Tesla plummeted by 5.0% following the automaker's failure to meet market expectations for first-quarter deliveries.
Further gains might push the Nasdaq 100 over its all-time high of 18,464 (March 21). Alternatively, the index is expected to find temporary support at the 55-day SMA of 17,790, before falling to weekly lows of 17,319 (February 21) and 17,128 (January 31). If the latter is breached, a challenge of its 2024 low of 16,249 (January 5) may emerge ahead of the crucial 200-day SMA of 16,082 and the December 2023 low of 15,695 (December 4). Additional losses from here may return to the October 2023 level of 14,058 (October 26), prior to the April 2023 low of 12,724 (April 25) and the March 2023 low of 11,695 (March 13). The daily RSI deflated to around 50.
Top Gainers: Kraft Heinz, Xcel Energy, Datadog
Top Losers: Tesla, Warner Bros Discovery, Autodesk
Resistance levels: 18,464 (4H chart)
Support levels: 17,764 17,319 17,128 (4H chart)
DOW JONES
US stocks added to the pessimism seen at the beginning of the week and dropped to multi-day lows near the 39,000 mark when tracked by the reference Dow Jones.
Once again, firmer manufacturing results, this time from Factory Orders (+1.4% MoM) and steady Job Openings, seem to have underpinned the tighter-for-longer narrative by the Fed.
These results added to Monday’s stronger-than-expected ISM Manufacturing and appear to have weighed on expectations of interest rate cuts by the Fed at its June gathering.
Earlier in the session, L. Mester (Cleveland) argued that a rate cut in June remains possible but hinges on data, while her colleague M. Daly (San Francisco) kept unchanged her preferences for three rate cuts this year.
On Tuesday, the Dow Jones deflated 1.09% to 39,133, the S&P 500 retreated 0.90% to 5,196, and the tech-centric Nasdaq Composite dropped 1.15% to 16,209.
If bulls reclaim the initiative, the Dow Jones might attempt its record high of 39,889 (March 21). On the other hand, the 55-day SMA of 38,683 provides temporary support, as it precedes the 2024 low of 37,122 (January 18) and the weekly low of 37,073 (December 20, 2023). If the index falls below this level, it may approach the preliminary 100-day SMA at 37,607 before attempting to test the 200-day SMA at 35,938. The weekly low of 33,859 (November 7, 2023) is next, followed by the October 2023 low of 32,327 (October 27), all ahead of the 2023 bottom of 31,429 (March 15). The daily RSI dropped to about 50.
Top Performers: Dow, Walt Disney, Verizon
Worst Performers: UnitedHealth, Amgen, Nike
Resistance levels: 39,889 (4H chart)
Support levels: 39,051 38,457 38,039 (4H chart)
MACROECONOMIC EVENTS
All Information & Updates provided by:

All information relating to the financial markets available on this page has been prepared and issued by FXStreet (Forexstreet SL, Spain, Reg: B62498233) on the basis of publicly available information and all information believed to be reliable and does not conflict with Kuwaiti local laws, and all necessary care has been taken to before the company to ensure that the facts mentioned are correct from the source.
NCM Investment nor any of its directors or employees shall in any way be held responsible for the contents of this news, and the information contained on this page is intended only to provide clients with publicly available information and should not be construed as investment advice, report or analysis and/or constitute an offer or invitation to buy or sell financial instruments of any kind.
RISK WARNING: Forex and CFDs are highly risky leveraged products, as losses can exceed deposits. Please ensure you understand all the risks and take independent advice if necessary. NCM will segregate the clients based on the criteria of the regulator and its bylaws. NCM does not provide any advisory service; the material published does not constitute advice or a recommendation for a transaction in any financial instrument. NCM accepts no responsibility for any use of the content presented and any consequences of that use. Anyone acting on the information provided does so at their own risk.