
- Contact Us:
-

-

-

-


Daily Market Updates
04 Apr 2024
EURUSD
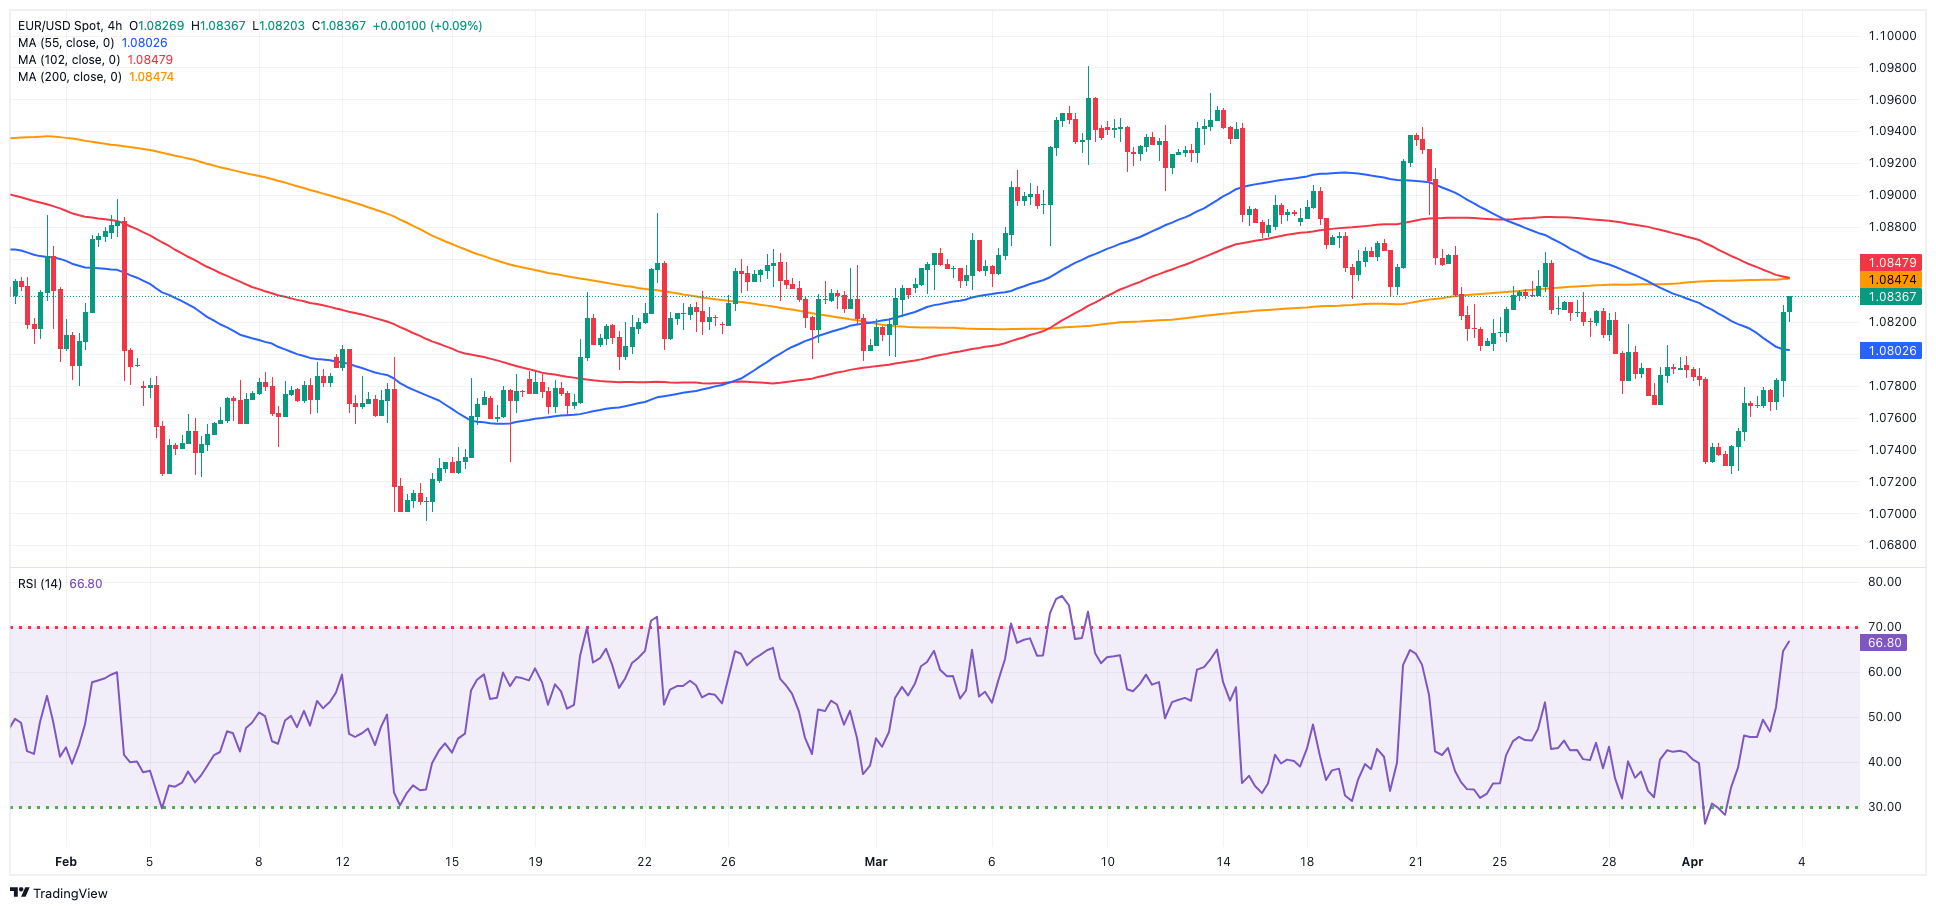
The continuation of the corrective decline in the greenback sponsored the second consecutive daily advance in EUR/USD, this time reclaiming the area well beyond 1.0800 the figure on Wednesday.
In fact, the USD Index (DXY) succumbed to the renewed appetite for risk-related assets and dropped to the low 104.00s against the backdrop of extra gains in US yields across different timeframes.
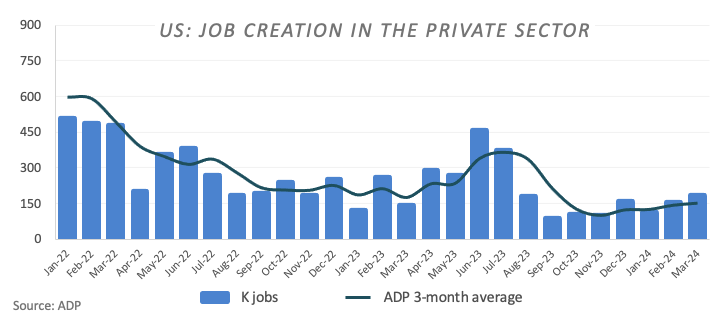
In the meantime, the dollar’s downward path gathered pace after mixed data saw the US private sector add 184k jobs in March, according to ADP, while the ISM Services PMI came in short of estimates at 51.4 in March.
In addition, hawkish comments from R. Bostic (Atlanta) failed to ignite some reversal in the buck after he still favoured one rate cut this year, coming at some point in Q4. Later, Chief Powell stated that considering the robustness of the economy and the advancements in inflation thus far, there is ample opportunity to allow incoming data to shape our policy decisions, with each decision being made on a "meeting by meeting" basis.
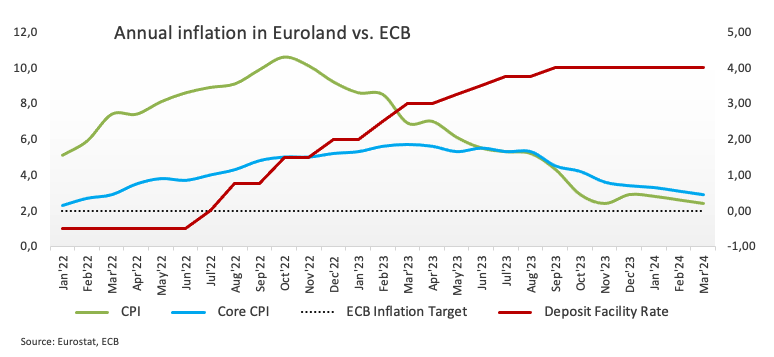
Back to the docket and closer to home, the advanced headline Inflation Rate in the broader euro bloc rose by 2.4% in the year to March and by 2.9% when stripping food and energy costs (core CPI).
In case sellers regain the upper hand, EUR/USD may dispute the April low of 1.0724 (April 2) prior to the 2024 low of 1.0694 (February 14). A deeper decrease could reveal the weekly low of 1.0495 (October 13, 2023), which is prior to the 2023 low of 1.0448 (October 3) and the round milestone of 1.0400. Instead, the initial up-block is at the critical 200-day SMA of 1.0832, which comes before the March high of 1.0981 (March 8) and the weekly top of 1.0998 (January 5, 2011), confirming the psychological 1.1000 barrier. The breakout of this zone might put pressure on the December 2023 peak of 1.1139 (December 27), which is still supported by the 200-week SMA of 1.1146 and comes before the 2023 high of 1.1275 (July 18). The daily RSI climbed to around 50.
Resistance levels: 1.0836 1.0846 1.0864 (4H chart)
Support levels: 1.0724 1.0694 1.0656 (4H chart)
USDJPY
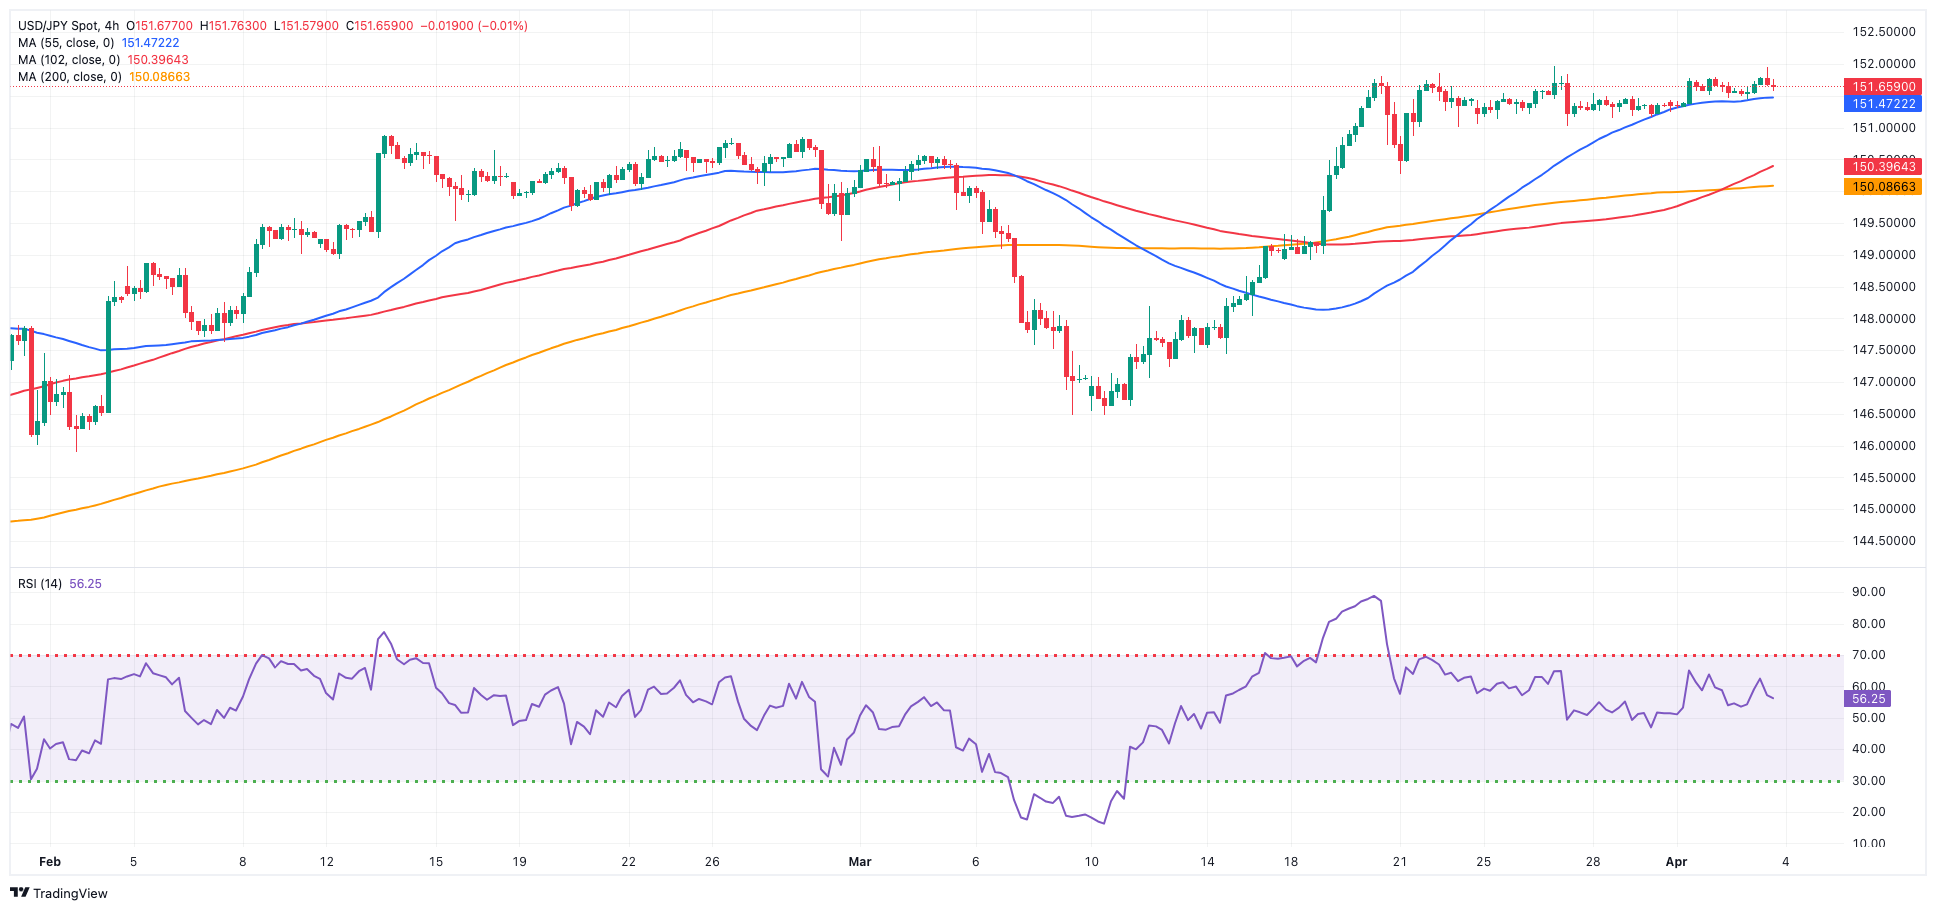
USD/JPY extended its apathetic range-bound trade on Wednesday, this time navigating the upper 151.00s and briefly flirting with YTD peaks.
Certainly, the movement in the pair coincided with the revived bearish sentiment towards the greenback, which simultaneously juxtaposed the significant recovery in US yields across various maturities, whereas JGB 10-year yields surged to multi-day peaks near 0.80%.
Meanwhile, investors are expected to remain cautious due to the potential for FX intervention as long as spot trades hover around the 152.00 region. On this, finmin Suzuki voiced concerns about rapid FX rate fluctuations, attributing yen depreciation to speculative activities. He stressed the importance of vigilant monitoring and suitable responses to disorderly fluctuations.
There were no releases on the Japanese docket on Wednesday.
USD/JPY has an immediate upward hurdle at the 2024 high of 151.97 (March 27), just above the round number of 152.00. In contrast, the pair is projected to find brief support near the 55-day and 100-day SMAs of 149.46 and 147.68, respectively, before approaching the critical 200-day SMA of 146.99 and the March low of 146.47 (March 8). A breakdown of this zone might result in a return to the February low of 145.89 (February 1), which is prior to the December 2023 low of 140.24 (December 28), the round number 140.00, and the July low of 137.23 (July 14). The daily RSI climbed marginally to around 65.
Resistance levels: 151.97 155.80 155.88 (4H chart)
Support levels: 151.02 150.26 150.08 (4H chart)
GBPUSD
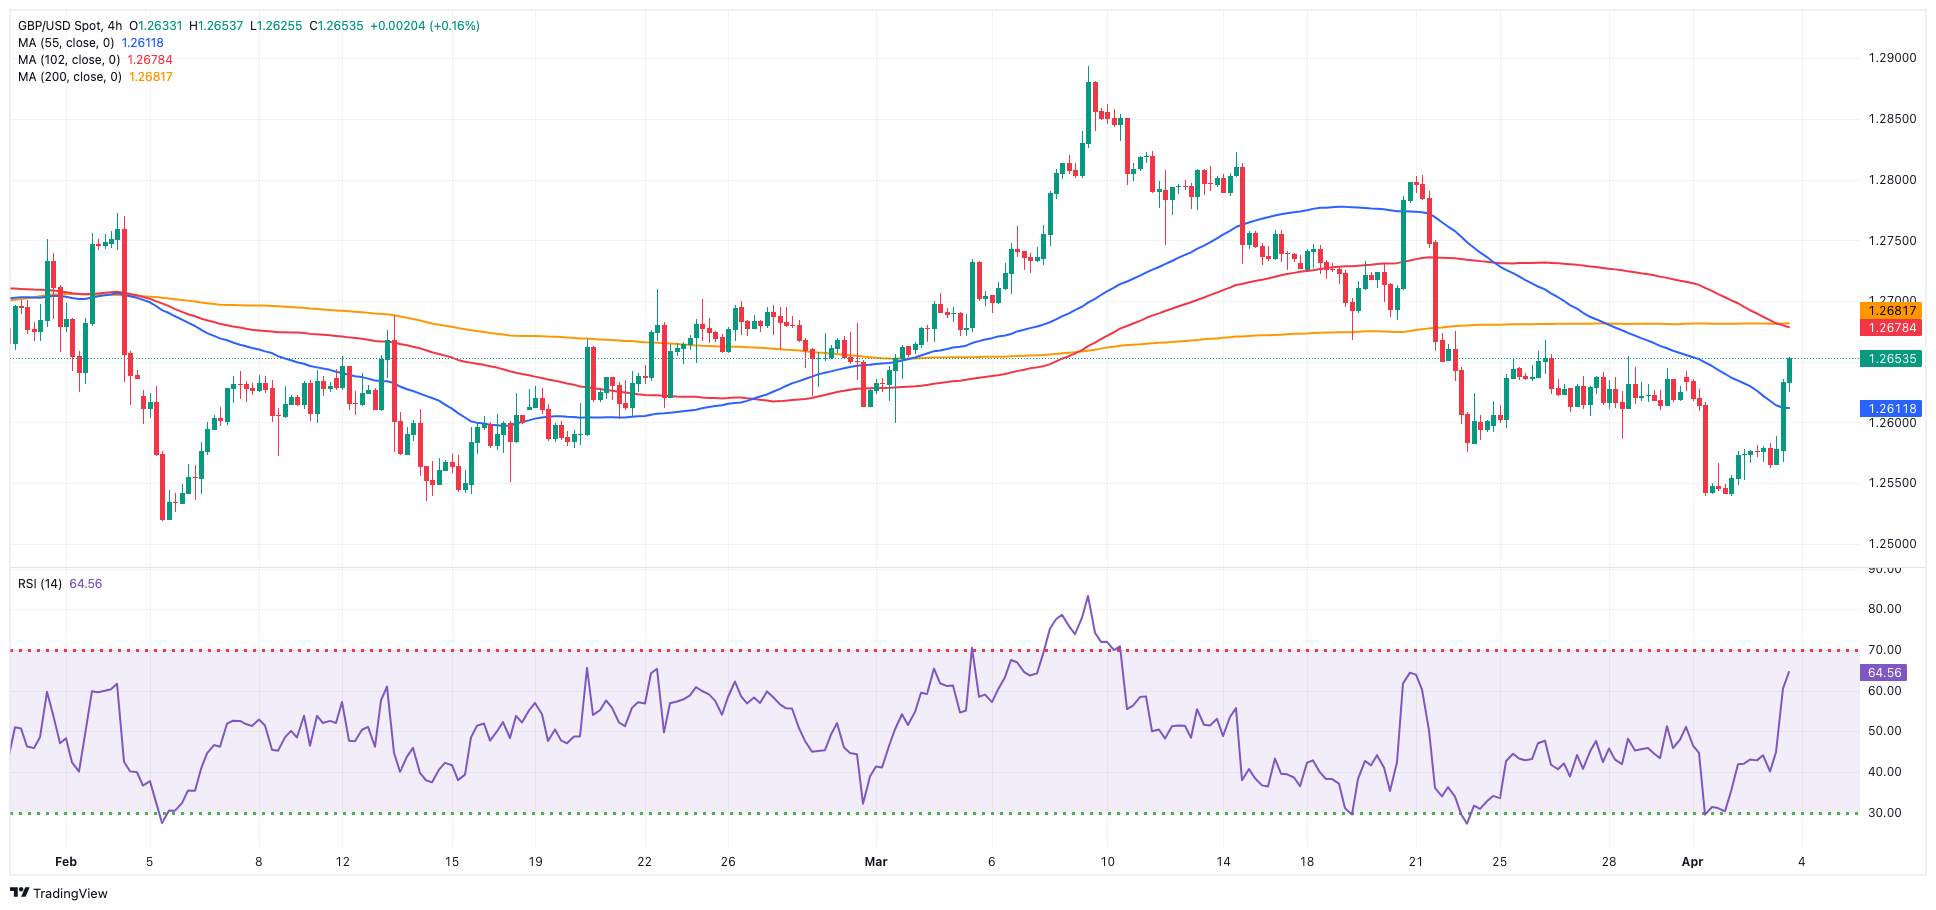
Extra weakness in the dollar helped GBP/USD clinch its second straight session of gains, adding to Tuesday’s advance and largely surpassing the key 1.2600 barrier on Wednesday.
The strong uptick in Cable also trespassed the key 200-day SMA (1.2586), shifting the pair’s outlook to a constructive one and allowing for further gains to kick in on the short-term horizon.
Contrasting with the sharp bounce in spot, 10-year gilt yields retreated modestly following recent tops around 4.10%.
The UK calendar was empty on Wednesday.
The continuation of the recovery could see GBP/USD revisit the interim 100-day and 55-day SMAs of 1.2656 and 1.2671, respectively, before the 2024 top of 1.2893 (March 8), seconded by the weekly peak of 1.2995 (July 27, 2023), and the key 1.3000 threshold. On the contrary, initial support comes at the April low of 1.2539 (April 1,2) ahead of the 2024 low of 1.2518 (February 5) and the December 2023 low of 1.2500 (December 13). A deeper slide would not find major support until the weekly low of 1.2187 (November 10, 2023), which is preceding the October 2023 low of 1.2037 and the main 1.2000 line. The RSI rose above 48 on the daily chart.
Resistance levels: 1.2652 1.2667 1.2680 (4H chart)
Support levels: 1.2539 1.2518 1.2500 (4H chart)
GOLD
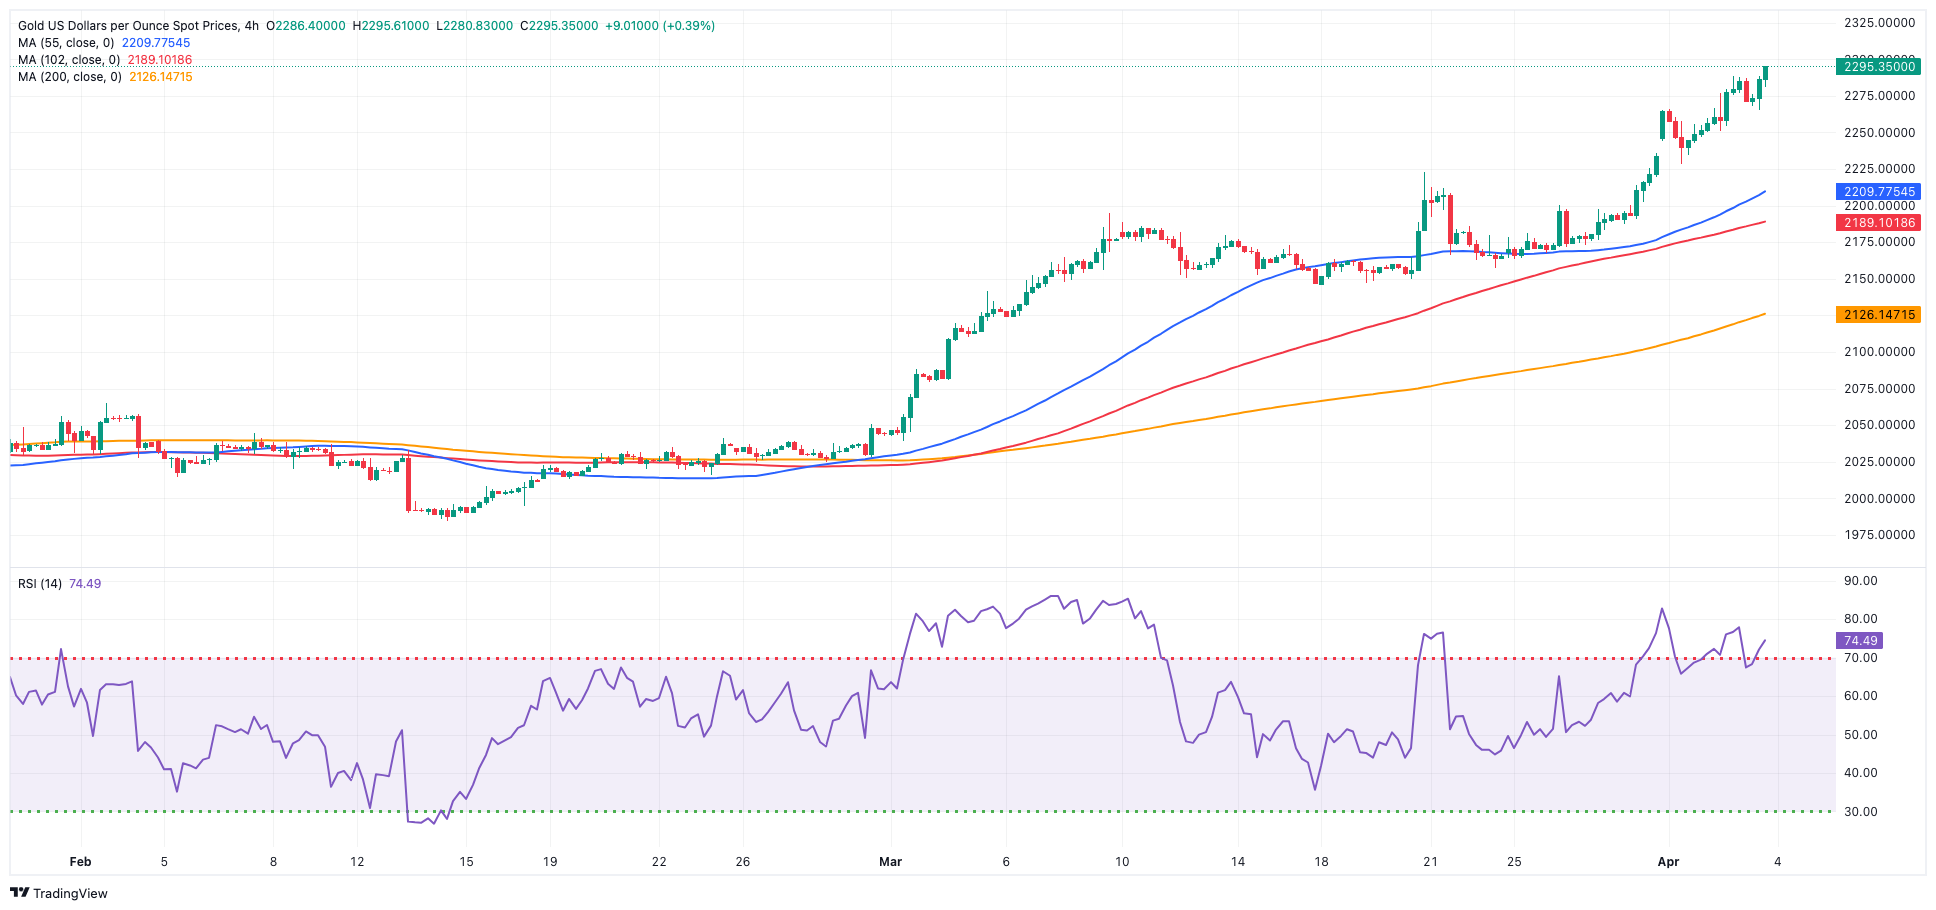
Yet another day, yet another record high reached by the precious metal, this time approaching the $2,300 level per troy ounce on Wednesday.
Gold prices ascended to an unprecedented peak, hovering just below the $2,300 region, fueled by persistent geopolitical tensions from the Middle East and Russia-Ukraine, while the weaker dollar and interest rate cut expectations also contributed to the unabated optimism around the yellow metal.
Gold is facing immediate resistance above its all-time high of $2,277 (April 2). On the downside, the weekly low of $2,146 (March 18) ranks first, followed by the preliminary 55-day and 100-day SMAs of $2,084 and $2,056, respectively. Further south is the 2024 low of $1,984 (February 14), which appears to be supported by its proximity to the 200-day SMA ($1,991). Once the latter is resolved, a possible visit to the December 2023 low of $1,973 may commence before the November 2023 low of $1,931. The failure in this location might bring the yellow metal to test its October 2023 low of $1,810, then the 2023 low of $1,804 and the important $1,800 conflict zone.
Resistance levels: $2,292 (4H chart)
Support levels: $2,228 $2,208 $2,188 (4H chart)
CRUDE WTI
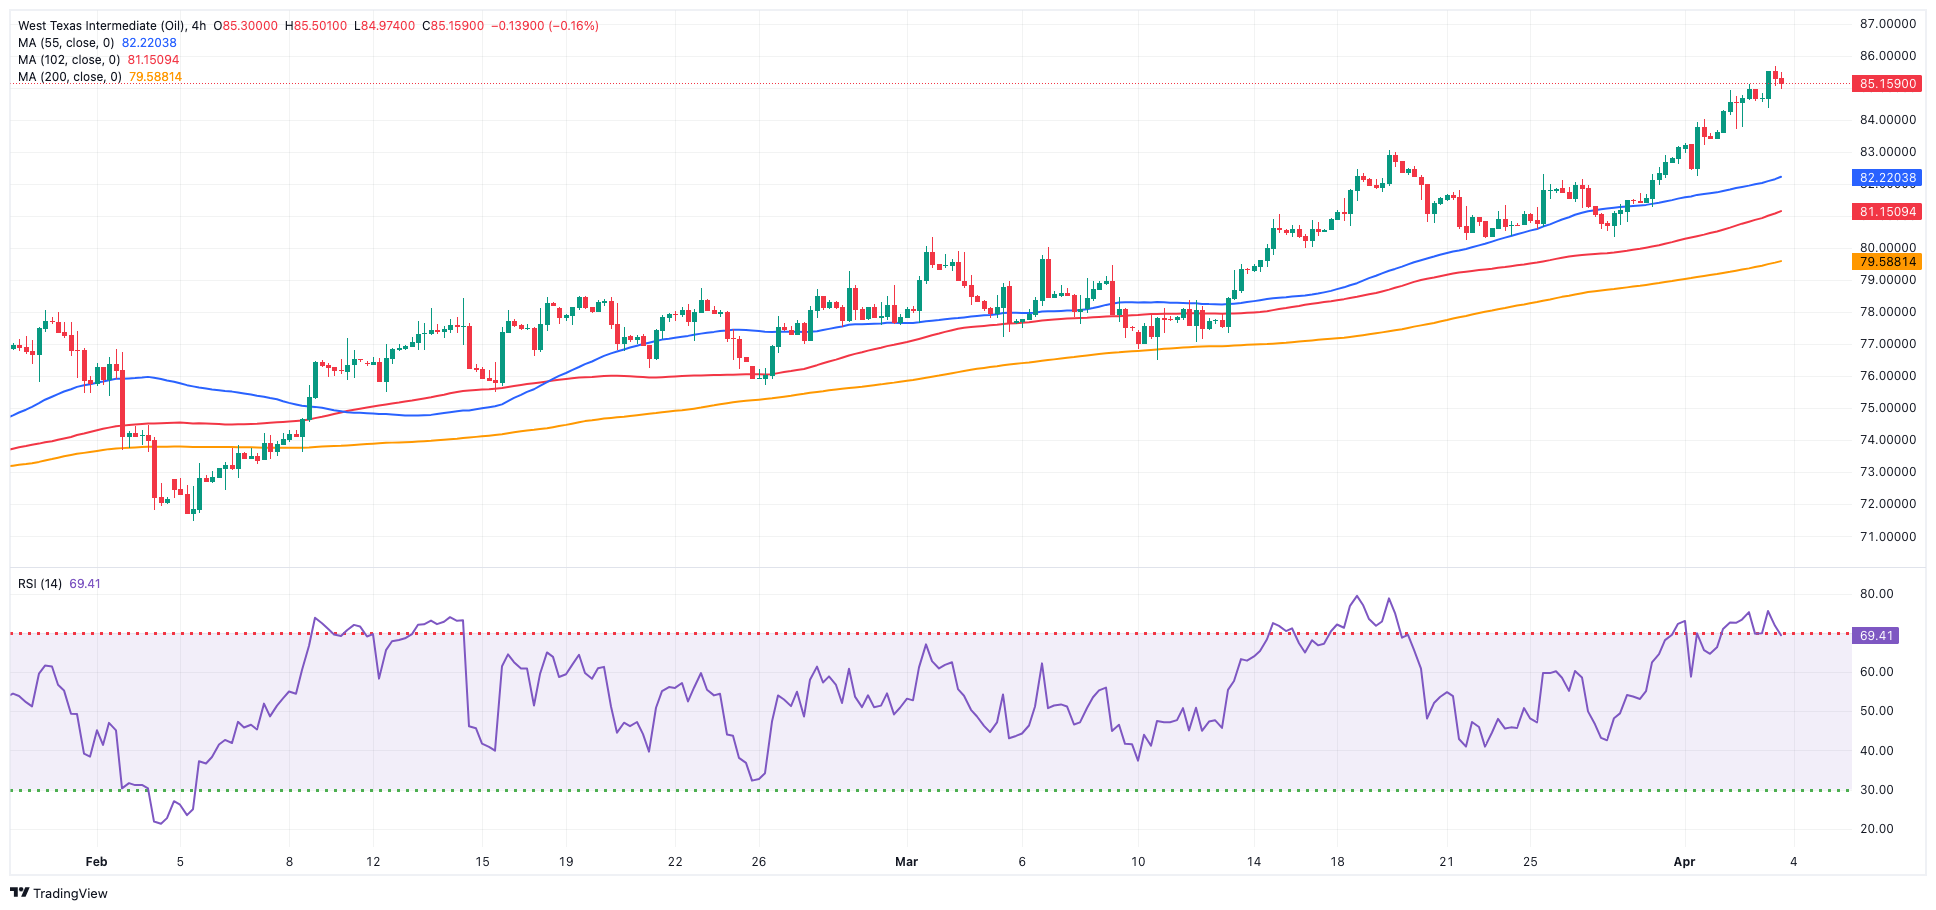
Prices of WTI rose for the fifth session in a row and reached fresh tops past the $86.00 mark per barrel on Wednesday.
Rising geopolitical effervescence in the Middle East and the Russia-Ukraine war maintained the commodity well bid on Wednesday, while the unexpected drop in weekly US crude oil supplies seems to have tempered the bullish mood.
On the latter, the EIA reported that US crude oil inventories went up by 3.210M barrels in the week to March 29, while supplies at Cushing shrank by 0.377M barrels, Weekly Distillate Stocks dropped by 1.268M barrels, and gasoline stockpiles unexpectedly decreased by 4.256M barrels.
In the meantime, a gathering of the key OPEC+ ministers on Wednesday maintained the status quo on oil output policy and urged certain countries to enhance compliance with production cuts.
The next upward challenge for WTI is the 2024 peak of $86.16 (April 3), which comes before the weekly high of $89.83 (October 18, 2023) and the 2023 top of $94.99 (September 28, 2023). Further north, the weekly peak of $97.65 (August 30) comes just short of the psychological $100.00 mark. Having said that, the 200-day SMA should offer some support at $78.99, ahead of the February low of $71.43 (February 5) and the key $70.00 level. Additional losses may drive prices over the 2024 low of $69.31 (January 3) and ahead of the December 2023 low of $67.74 (December 13).
Resistance levels: $86.16 $89.82 $94.99 (4H chart)
Support levels: $82.58 $80.51 $79.79 (4H chart)
GER40
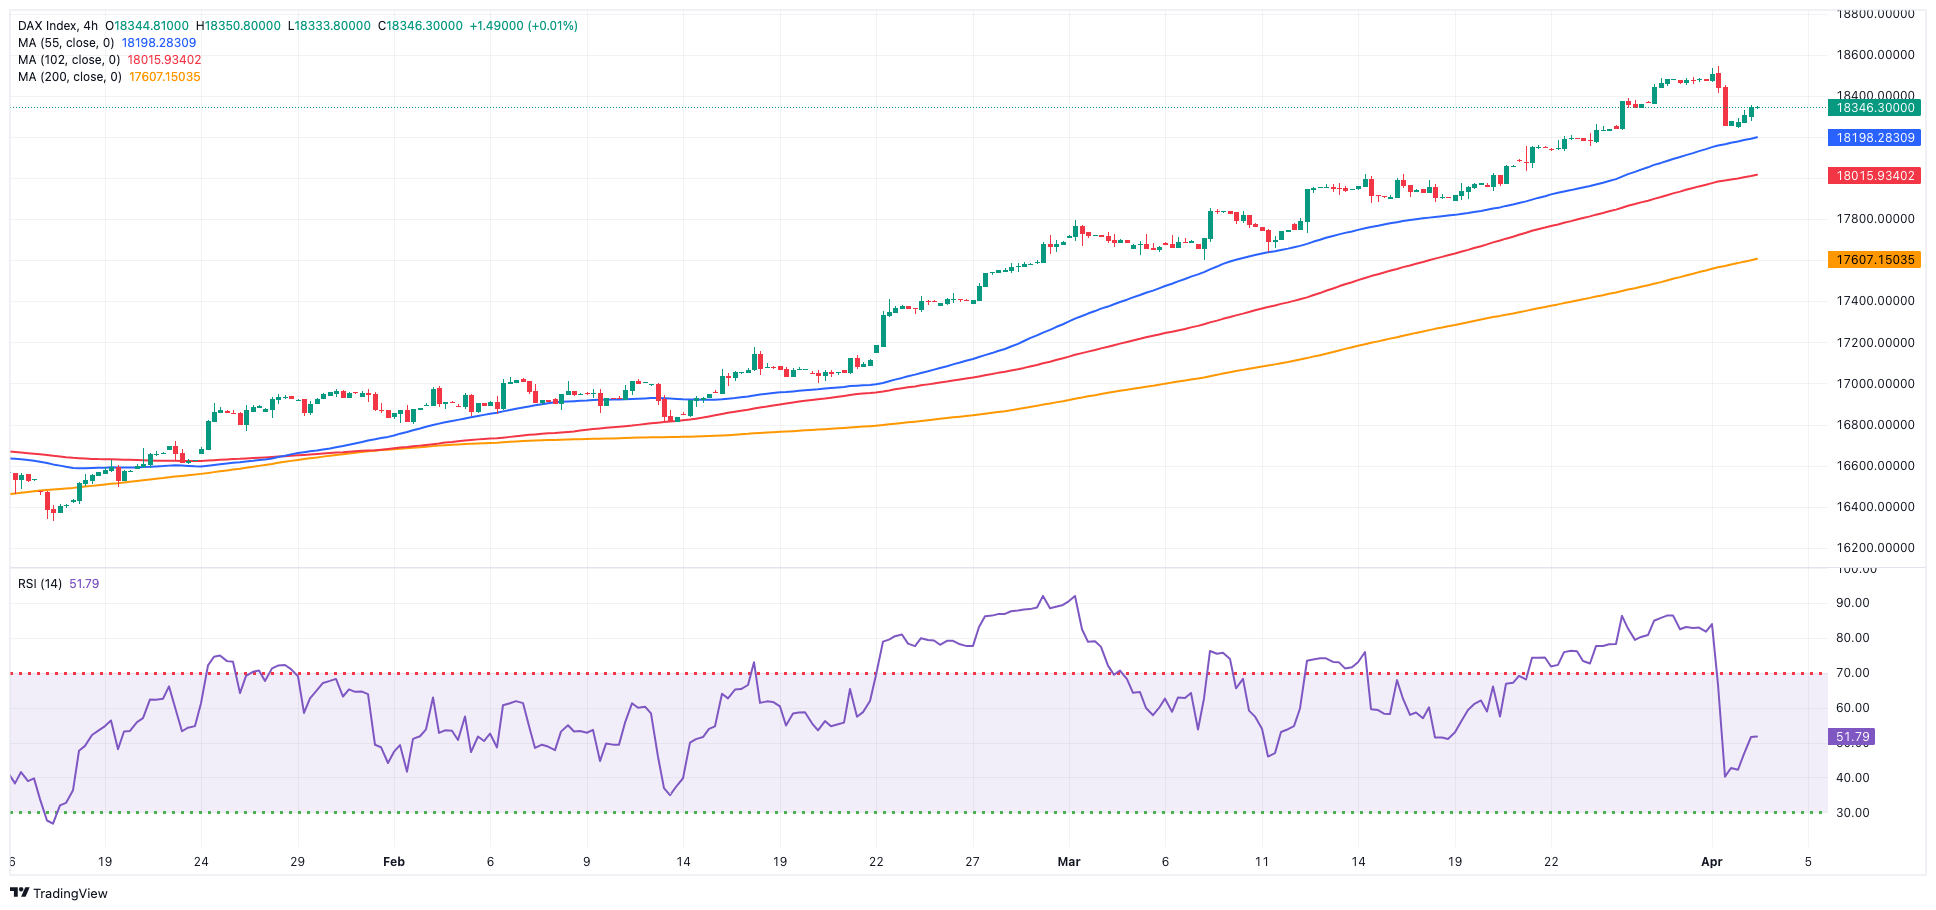
European markets regained the smile and motivated the German benchmark DAX40 to resume its uptrend and rapidly leave behind Tuesday’s corrective decline on Wednesday.
In fact, the index rose on Wednesday on softer-than-expected US services sector data (ISM Services PMI), but investors also looked at softening eurozone inflation data, which strengthened the argument for ECB interest rate cuts.
On the latter, while the ECB is anticipated to keep interest rates steady at its policy meeting next week, markets anticipate a 25 bps rate drop in June.
The daily uptick in the DAX40 also came in contrast to a drop in German 10-year bund yields below the 2.40% level.
The DAX40's next level of resistance is the record high of 18,567 (April 2). The other way around, the 55-day SMA of 17,410 should provide temporary support before the February low of 16,821 (February 1). A dip below this level might send the index to its 2024 low of 16,345 (January 17), ahead of the crucial 200-day SMA of 16,288. After falling below the latter, the weekly low of 15,915 (November 28) might be tested, followed by the October low of 14,630 (October 23) and the 2023 bottom of 14,458 (March 20). The daily RSI fell rebounded past 71 re-entering the overbought zone.
Best Performers: BMW ST, Commerzbank, Porsche
Worst Performers: Daimler Truck Holding, Beiersdorf AG, Continental AG
Resistance levels: 18,567 (4H chart)
Support levels: 18,275 18,090 17,902 (4H chart)
GBPJPY
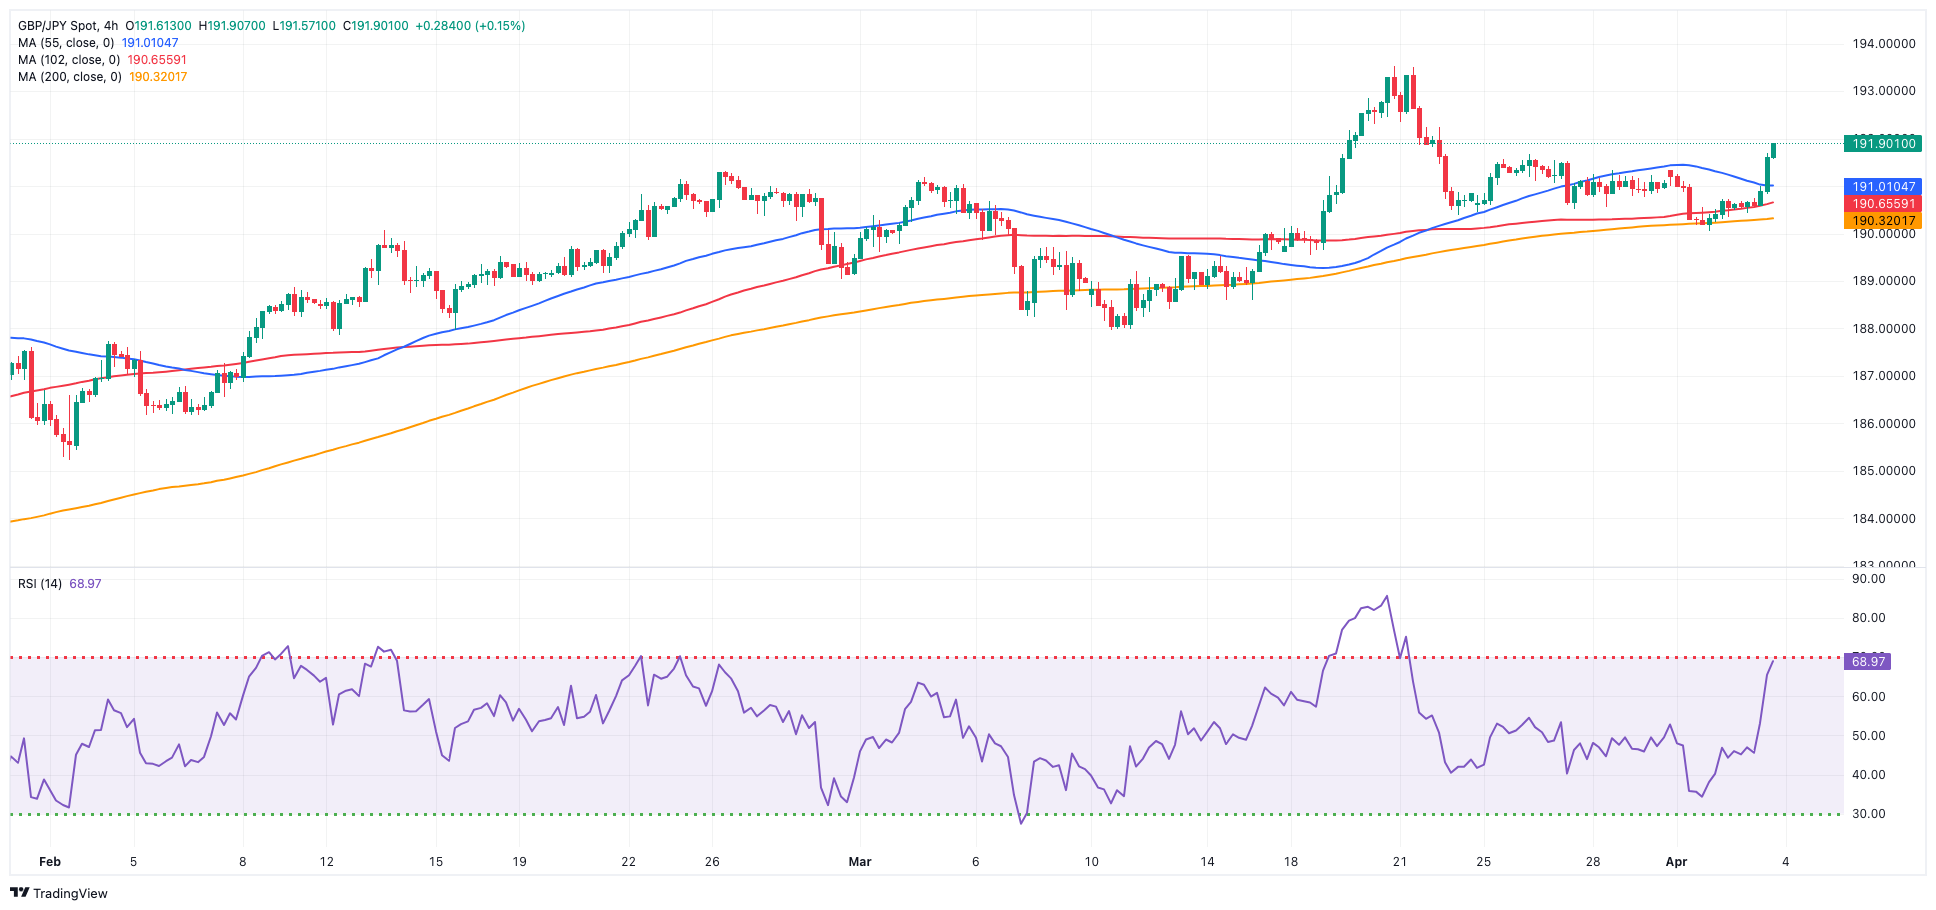
The increased buying activity in sterling motivated GBP/JPY to add to Tuesday’s gains and advance to fresh multi-day peaks midweek.
The extra weakness of the dollar provided crucial support to the risk environment, boosting the rebound in the cross, while subdued trading involving the Japanese yen further contributed to the gains observed during the day.
Currently, downside movements in the cross seem to be restricted around the 190.00 region, while the yearly highs in the mid-193.00s are acting as a barrier to further upside potential.
In case bulls push harder, GBP/JPY might face the immediate upward barrier at the 2024 high of 193.53 (March 20), prior to the August 2015 top of 195.28 (August 18) and the record peak of 195.88 (June 24, 2015). In the opposite direction, the 55-day SMA at 189.43 is expected to offer temporary contention, ahead of March's low of 187.96 (March 11) and the interim 100-day SMA at 187.06. Once the latter is breached, the cross may confront the February low of 185.22 (February 1), before the crucial 200-day SMA of 185.02. A deeper retracement might bring the December 2023 low of 178.33 (December 14) back into focus, ahead of the October 2023 low of 178.03 and the July 2023 low of 176.31 (July 28). The RSI climbed to around 58.
Resistance levels: 191.69 193.53 195.28 (4H chart)
Support levels: 190.04 189.54 187.98 (4H chart)
NASDAQ
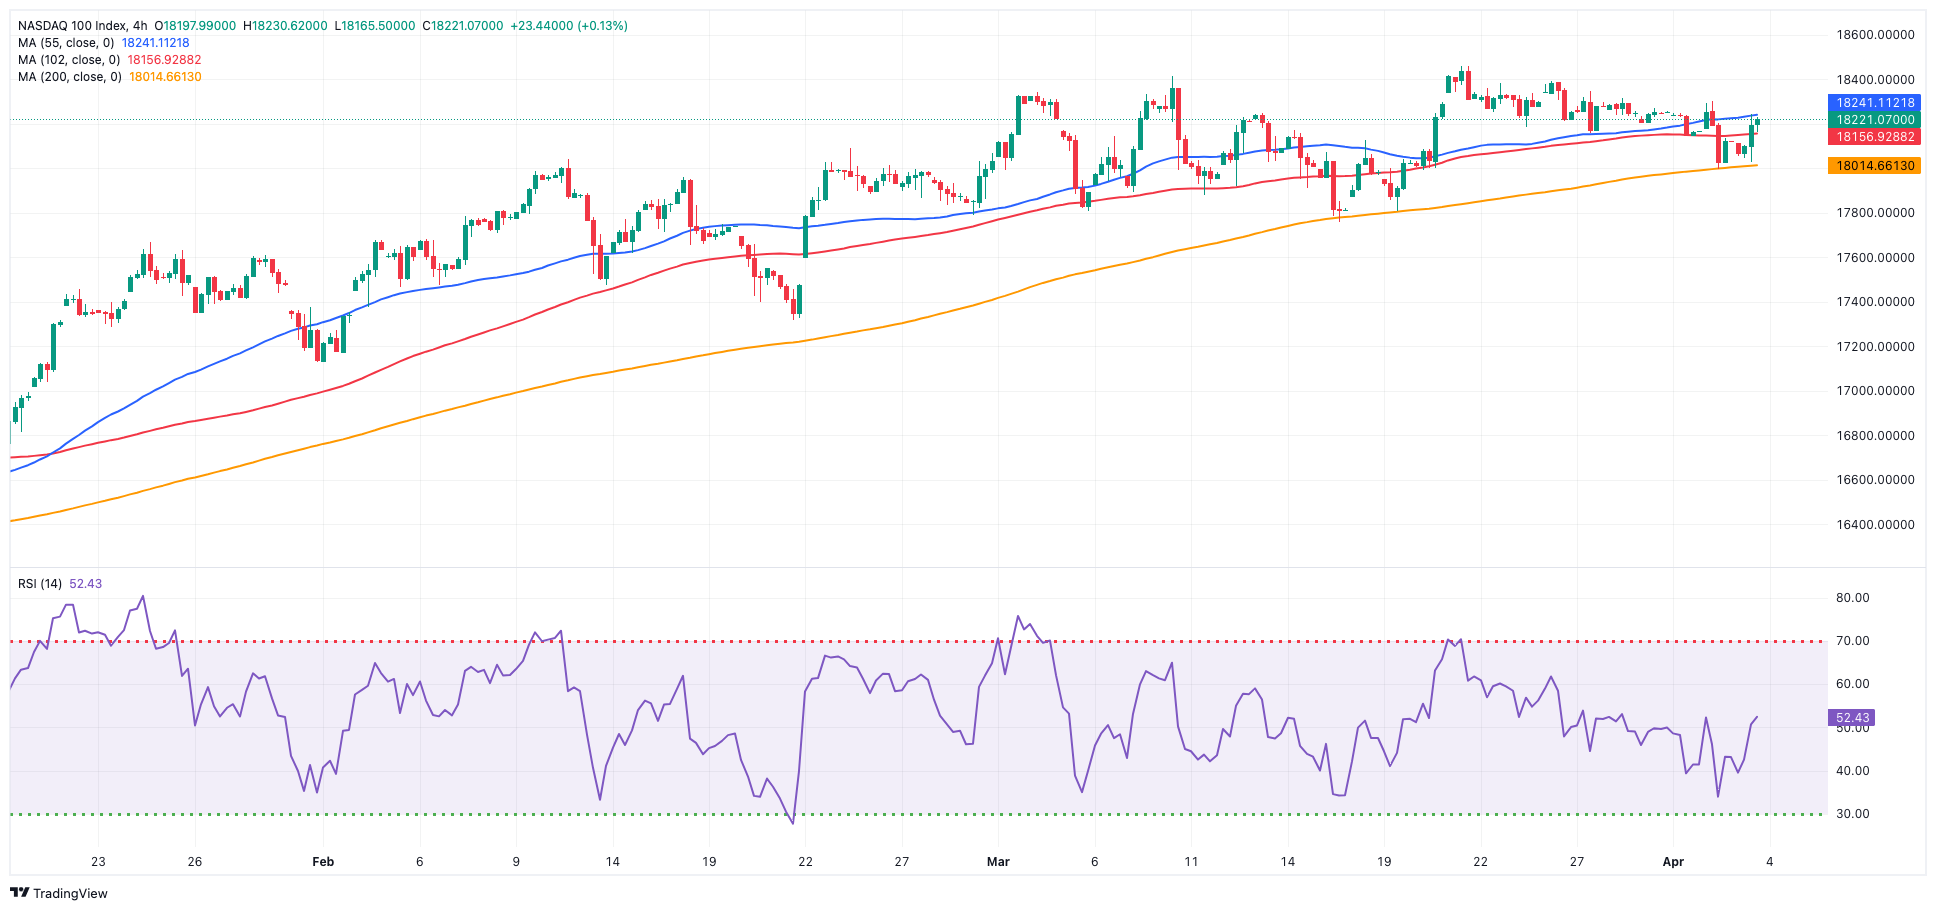
Following its US peers, the tech reference Nasdaq 100 charted decent gains and returned to the 18,200 region on Wednesday, bouncing off Tuesday’s multi-day lows around 18,000.
The generalized improvement in the tech sector came on the back of another negative session in the dollar, while the weaker-than-expected ISM Services PMI seems to have also undermined the view of a tighter-for-longer stance from the Fed.
The daily gain in the index came in spite of higher US yields, while the probability of a quarter-point rate cut by the Fed in June eased a tad to around 61%.
Further advances might send the Nasdaq 100 above its all-time high of 18,464 (March 21). Alternatively, the index is likely to find brief support at the 55-day SMA of 17,816 before sliding to weekly lows of 17,319 (February 21) and 17,128 (January 31). If the latter is crossed, a challenge to the 2024 low of 16,249 (January 5) may arise ahead of the critical 200-day SMA of 16,097 and the December 2023 low of 15,695 (December 4). Additional losses from here may return to the October 2023 level of 14,058 (October 26), which precedes the April 2023 low of 12,724 (April 25) and the March 2023 low of 11,695 (March 13). The daily RSI rebounded above 54.
Top Gainers: Micron, Fortinet, Broadcom
Top Losers: Intel, Moderna, Sirius XM
Resistance levels: 18,464 (4H chart)
Support levels: 17,764 17,319 17,128 (4H chart)
DOW JONES
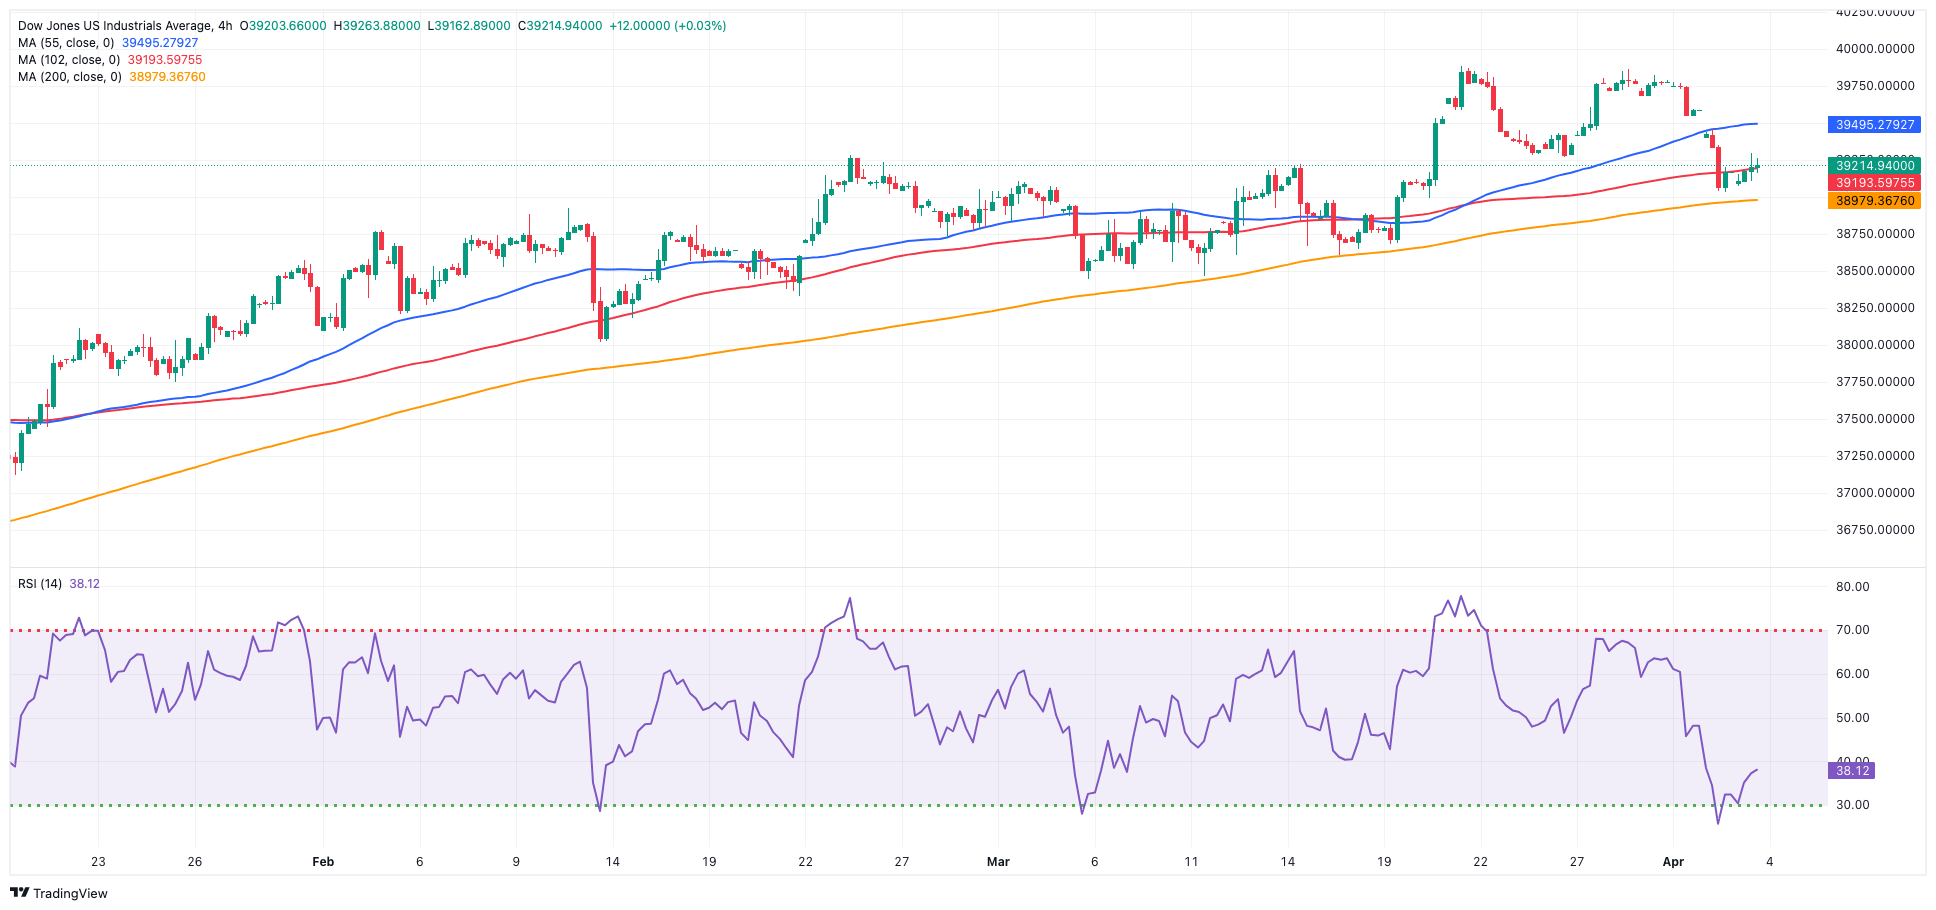
On Wednesday, the key Dow Jones moved higher following less-than-anticipated services sector data, providing solace to investors concerned about the Fed’s cautious stance on monetary easing, attributed to the resilience observed in the US economy.
In addition, Chief Powell showed no rush to start easing interest rates, underlining that the bank has time to consider its first interest rate decrease, which is generally expected in June, given the economy's resilience and recent strong inflation readings.
All in all, the Dow Jones advanced 0.11% to 39,214, the S&P 500 gained 0.33% to 5,223, and the tech-heavy Nasdaq Composite rose 0.52% to 16,323.
If bulls recover the initiative, the Dow Jones may try to break its record high of 39,889 (March 21). Just the opposite, the 55-day SMA of 38,713 offers temporary support before the 2024 low of 37,122 (January 18) and the weekly low of 37,073 (December 20, 2023). A breakdown of this region exposes the provisional 100-day SMA at 37,658 prior to the 200-day SMA at 35,962. The weekly low of 33,859 (November 7, 2023) comes next, seconded by the October 2023 low of 32,327 (October 27), all ahead of the 2023 bottom of 31,429 (March 15). The daily RSI increased slightly to around 52.
Top Performers: Caterpillar, Amazon.com, Goldman Sachs
Worst Performers: Intel, Procter&Gamble, J&J
Resistance levels: 39,889 (4H chart)
Support levels: 39,051 38,457 38,039 (4H chart)
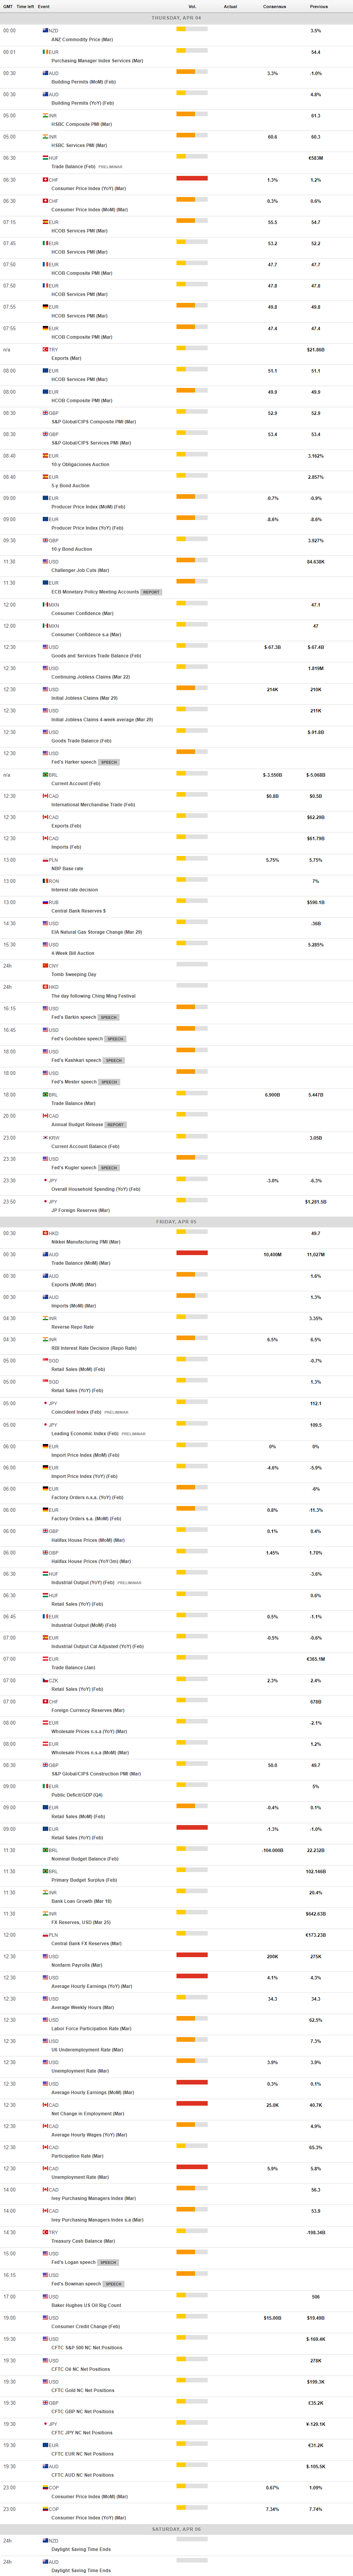
MACROECONOMIC EVENTS
All Information & Updates provided by:

All information relating to the financial markets available on this page has been prepared and issued by FXStreet (Forexstreet SL, Spain, Reg: B62498233) on the basis of publicly available information and all information believed to be reliable and does not conflict with Kuwaiti local laws, and all necessary care has been taken to before the company to ensure that the facts mentioned are correct from the source.
NCM Investment nor any of its directors or employees shall in any way be held responsible for the contents of this news, and the information contained on this page is intended only to provide clients with publicly available information and should not be construed as investment advice, report or analysis and/or constitute an offer or invitation to buy or sell financial instruments of any kind.
RISK WARNING: Forex and CFDs are highly risky leveraged products, as losses can exceed deposits. Please ensure you understand all the risks and take independent advice if necessary. NCM will segregate the clients based on the criteria of the regulator and its bylaws. NCM does not provide any advisory service; the material published does not constitute advice or a recommendation for a transaction in any financial instrument. NCM accepts no responsibility for any use of the content presented and any consequences of that use. Anyone acting on the information provided does so at their own risk.