
- Contact Us:
-

-

-

-


Daily Market Updates
05 Apr 2024
EURUSD
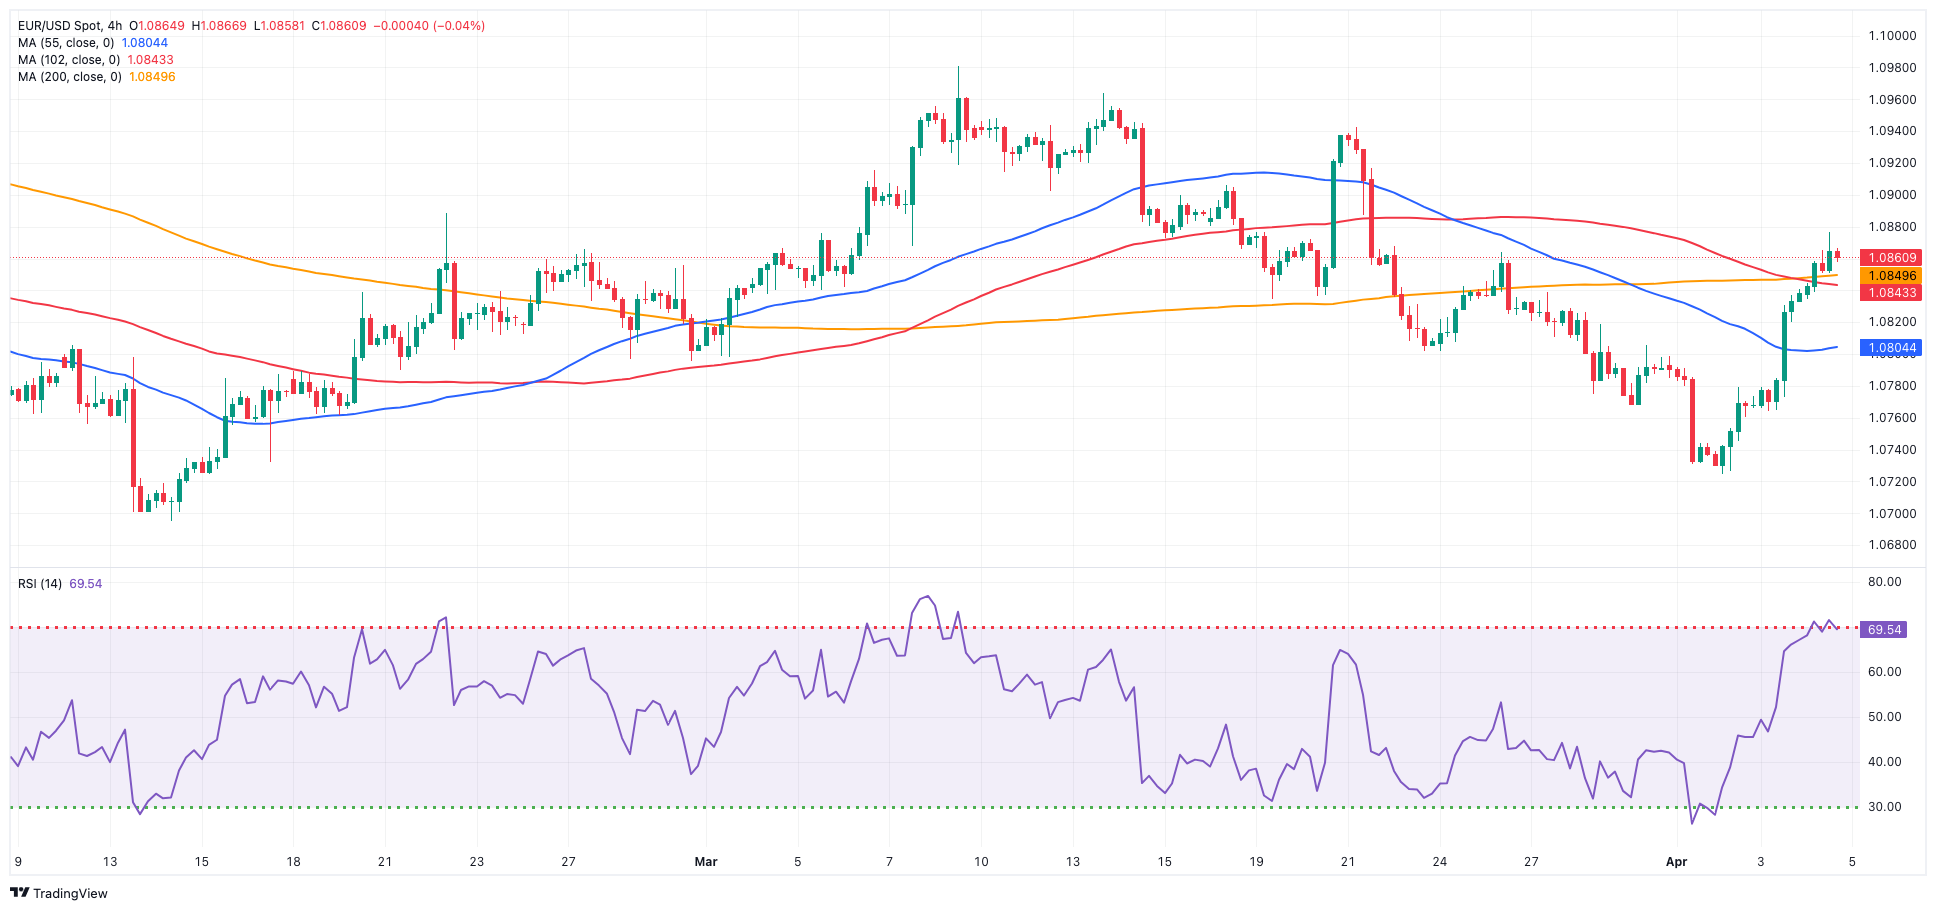
The ongoing corrective downturn in the dollar fueled a third consecutive daily rise in EUR/USD, with the pair surpassing the 1.0870 region, or multi-day highs, on Thursday. The pair’s daily tops, in addition, coincided with the provisional 100-day SMA.
Indeed, the USD Index (DXY) fell to the sub104.00 region, printing new two-week lows in response to extra investors’ appetite for riskier assets, a move that came along with a slight correction in US yields across the curve.
Meanwhile, market investors maintained their views that the Fed and the ECB would raise interest rates at their June meetings, despite the Fed's cautionary remarks. Regarding the latter, it is worth noting that Chief Powell stated last Friday that, given the strength of the economy and the progress made in inflation thus far, there is ample opportunity to allow incoming data to shape our policy decisions.
Around the ECB, the Accounts of its March 6-7 meeting revealed that policymakers are growing more confident that inflation is moving towards their 2% target, bolstering the argument for interest rate cuts.
Back to the daily docket, the final HCOB Services PMI in Germany and the euro area came in at 50.1 and 51.5, respectively, in March.
In the US, Initial Claims rose by 221K in the week to March 30, and the trade deficit widened to $68.9B in February.
Extra gains in EUR/USD could now test the March high of 1.0981 (March 8) seconded by the weekly top of 1.0998 (January 5, 2011), which is reinforced by the psychological 1.1000 barrier. The breakout of this zone may put pressure on the December 2023 peak of 1.1139 (December 27), which is still supported by the 200-week SMA of 1.1144 and comes before the 2023 high of 1.1275 (July 18). In contrast, the pair may challenge the April low of 1.0724 (April 2) before the 2024 bottom of 1.0694 (February 14). A deeper drop could expose the weekly low of 1.0495 (October 13, 2023), which comes before the 2023 low of 1.0448 (October 3) and the round milestone of 1.0400. The daily RSI rose to around 54.
Resistance levels: 1.0876 1.0942 1.0963 (4H chart)
Support levels: 1.0724 1.0694 1.0656 (4H chart)
USDJPY
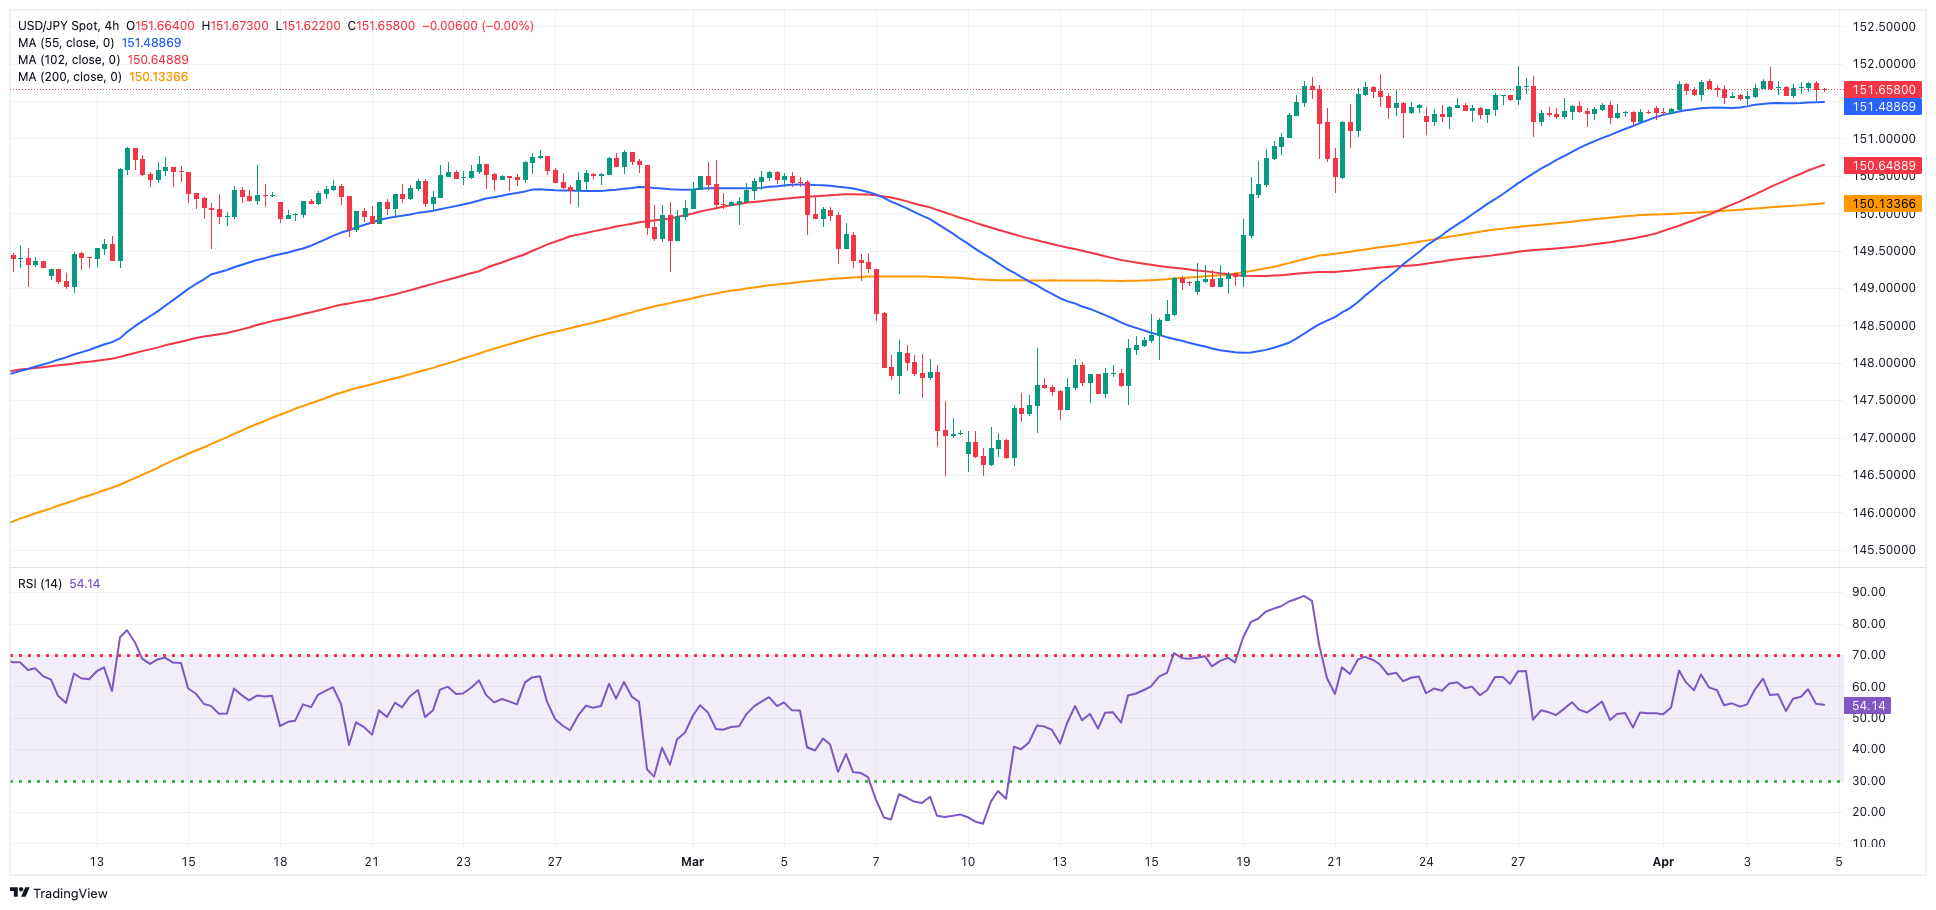
USD/JPY continued its indifferent range-bound trade on Thursday, always at shouting distance from the key 152.00 yardstick.
Certainly, the pair’s price action coincided with a renewed pessimistic mood towards the greenback, which came in tandem with marginal developments in US yields across all maturities, whereas JGB 10-year yields added to the ongoing rebound near 0.80%.
Meanwhile, investors are expected to be cautious due to the possibility of FX intervention as long as spot trading remain close to 152.00. On this, former top currency diplomat of Japan, Yamazaki, suggested that Japan is likely to intervene in the FX market if the yen depreciates significantly below 152 per dollar.
In Japan, Foreign Bond Investment shrank to ¥1660.5B in the week to March 30.
USD/JPY has an immediate upward hurdle at the 2024 high of 151.97 (March 27), just below the round number of 152.00. Conversely, the pair is projected to find interim support at the 55-day and 100-day SMAs of 149.53 and 147.68, respectively, before the critical 200-day SMA of 147.02 and the March low of 146.47 (March 8). A breakdown of this zone might result in a return to the February low of 145.89 (February 1), which is prior to the December 2023 low of 140.24 (December 28), the round number 140.00, and the July low of 137.23 (July 14). The daily RSI climbed marginally to around 65.
Resistance levels: 151.97 155.80 155.88 (4H chart)
Support levels: 151.02 150.26 150.12 (4H chart)
GBPUSD
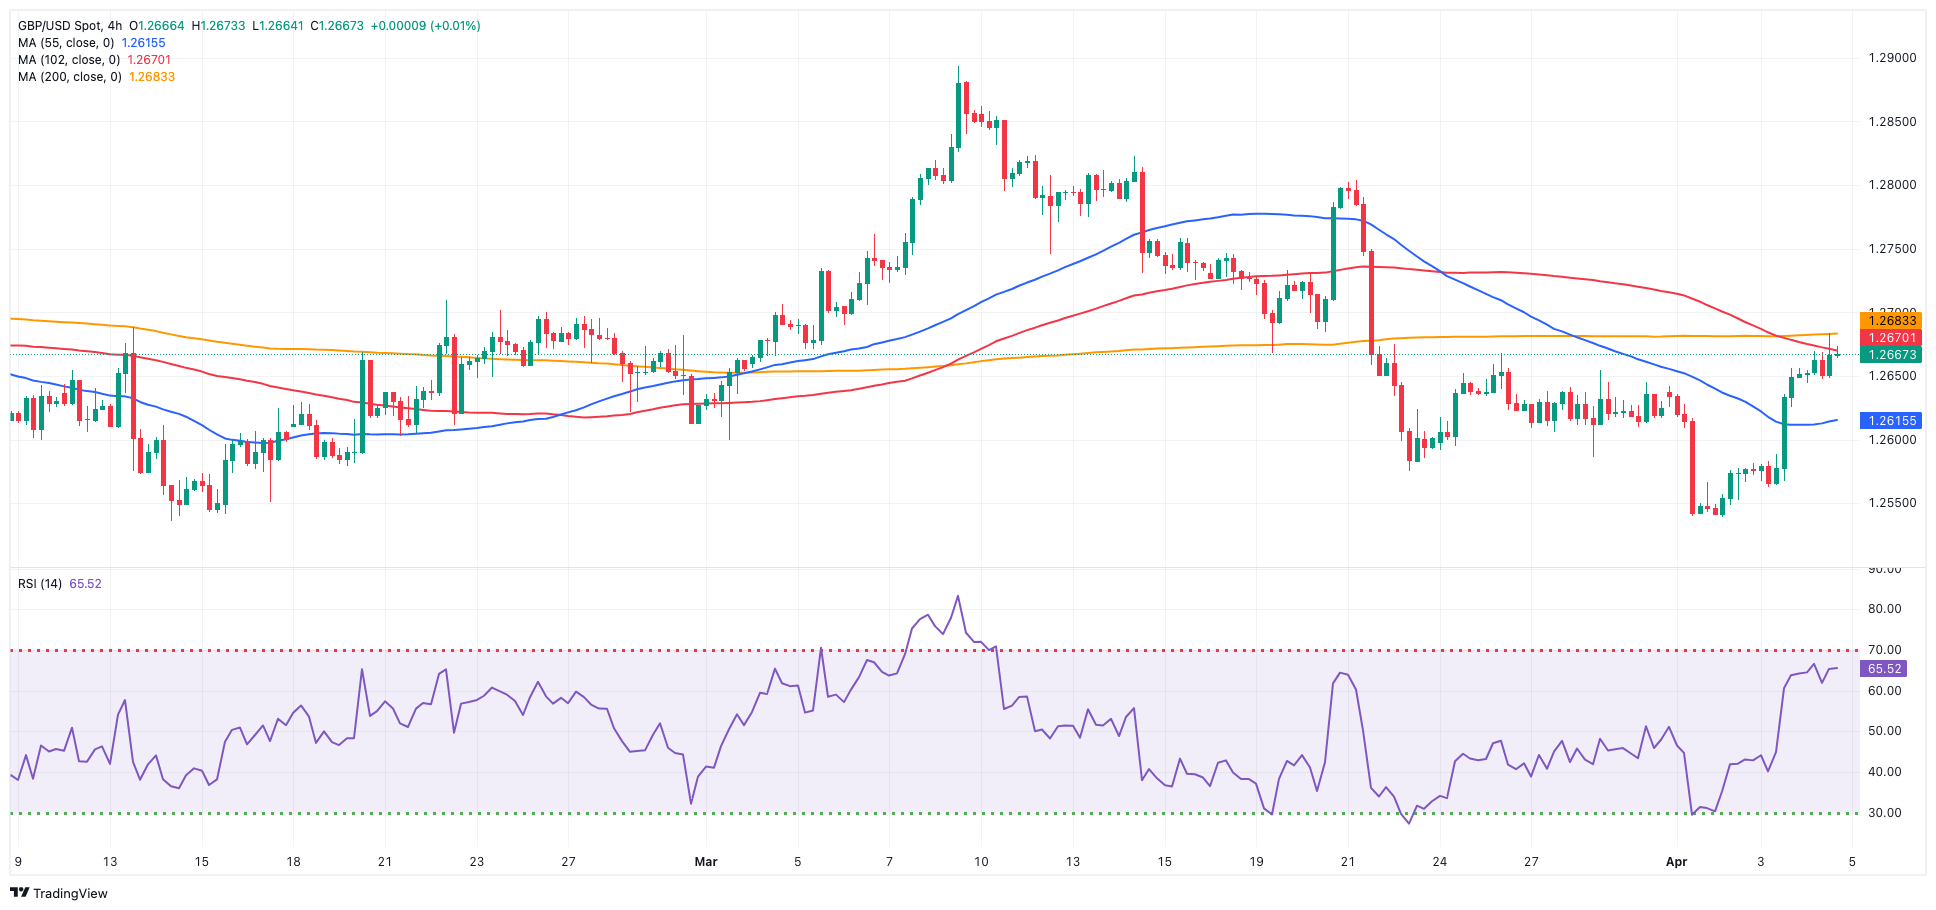
Increased weakness in the dollar facilitated GBP/USD to secure its third straight session of gains, building upon Wednesday’s upward movement and approaching the crucial 1.2700 hurdle on Thursday.
The substantial upward momentum in Cable also extended the recent breakout of the significant 200-day SMA (1.2586), altering the pair’s outlook to a positive one and enabling further gains to materialize in the short term.
In contrast to the sharp rebound in spot, 10-year gilt yields retreated for the second consecutive day, putting the 4.0% region to the test.
In the UK calendar, the final S&P Global Services PMI came in at 53.1 for the month of March.
The continuation of the rebound could see GBP/USD revisit the 2024 top of 1.2893 (March 8), followed by the weekly peak of 1.2995 (July 27, 2023), and the important 1.3000 level. On the contrary, early support is found at the April low of 1.2539 (April 1, 2), which precedes the 2024 low of 1.2518 (February 5) and the December 2023 low of 1.2500 (December 13). A deeper decline would not find significant support until the weekly low of 1.2187 (November 10, 2023), which comes before the October 2023 low of 1.2037 and the main 1.2000 line. On the daily chart, the RSI surged above 50.
Resistance levels: 1.2683 1.2803 1.2823 (4H chart)
Support levels: 1.2615 1.2539 1.2518 (4H chart)
GOLD
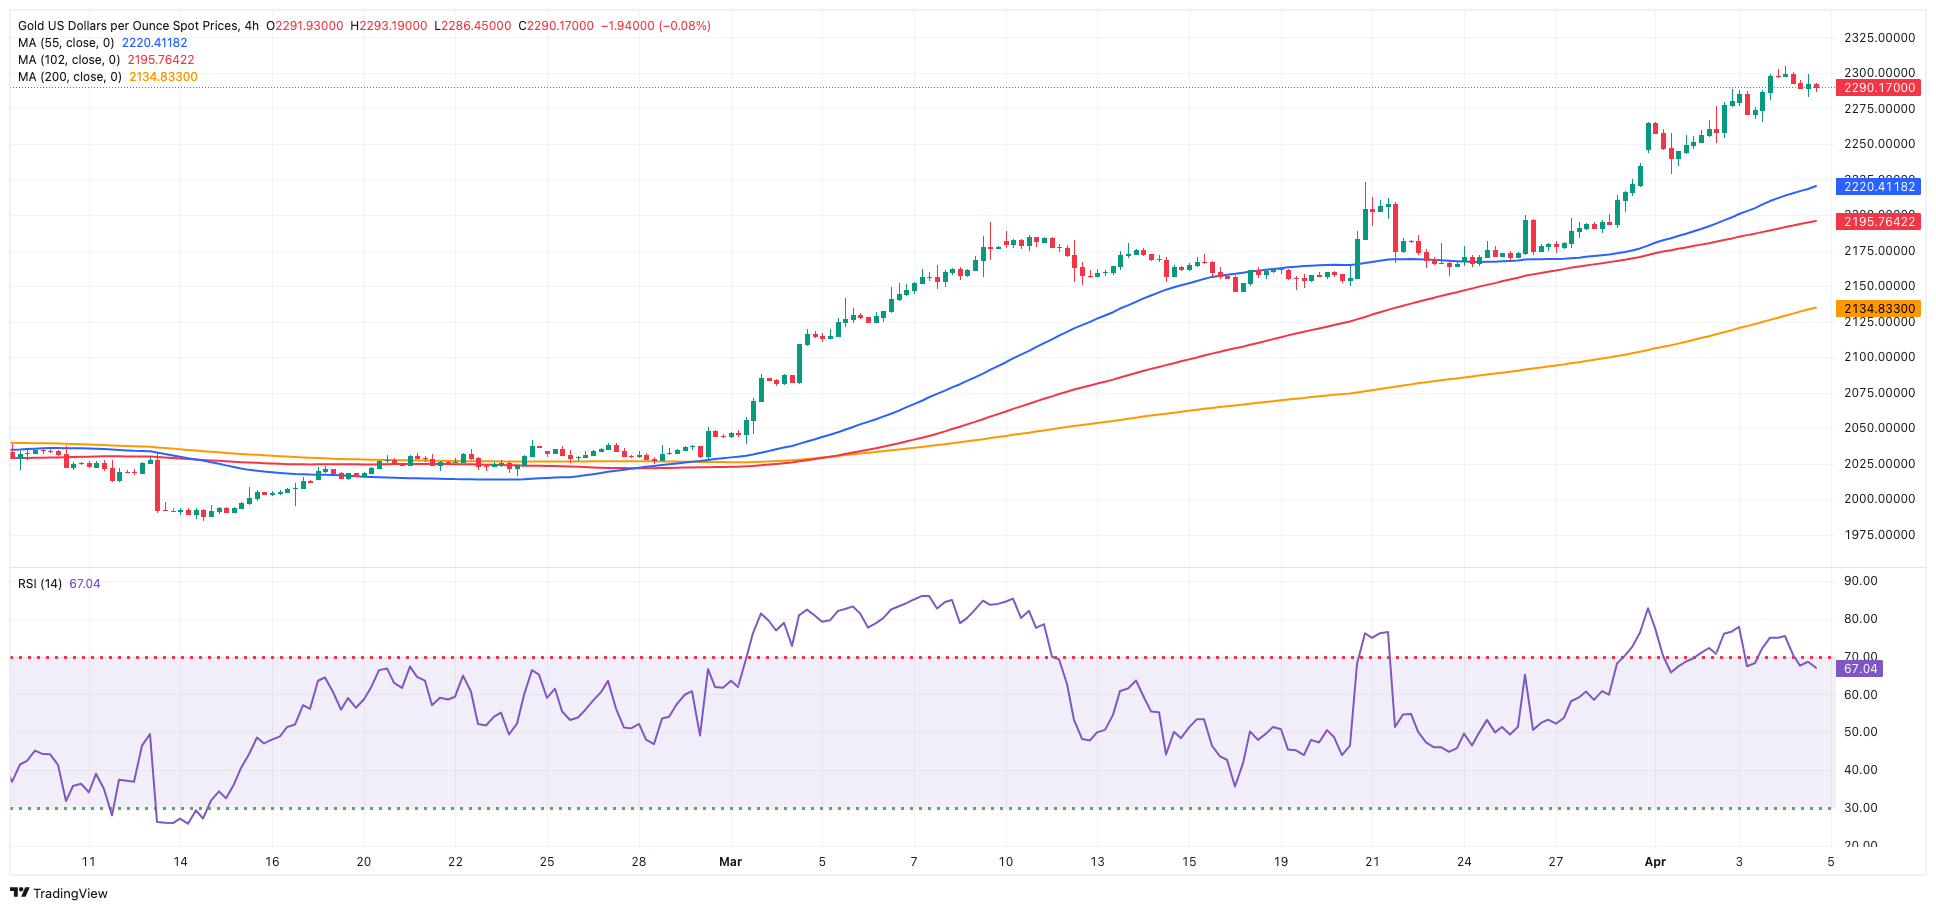
The intense move higher in the precious metal appears to have taken a breather on Thursday, soon after hitting an all-time high past the $2,300 mark per troy ounce during early trade.
Indeed, prices of the yellow metal have been rising strongly in past sessions, propelled by continuous geopolitical tensions in the Middle East and the Russia-Ukraine conflict, while a lower dollar and prospects of interest rate cuts have also been adding to the metal's unwavering confidence.
Moving forward, the focus now shifts to the March US Non-farm Payrolls, which are set to be released on Friday and could provide additional information on the timing of the Fed's first rate cut.
Gold faces immediate resistance at its all-time high of $2,304 (April 4). On the downside, the weekly low of $2,146 (March 18) takes first place, followed by the preliminary 55-day and 100-day SMAs of $2,096 and $2,063, respectively. Further south, the 2024 low of $1,984 (February 14) appears to be sustained by its proximity to the 200-day SMA ($1,991). Once the latter is addressed, a possible visit to the December 2023 low of $1,973 might begin before the November 2023 low of $1,931. The failure in this region might cause the yellow metal to test its October 2023 bottom of $1,810, then the 2023 low of $1,804, and the critical $1,800 conflict zone.
Resistance levels: $2,304 (4H chart)
Support levels: $2,228 $2,157 $2,134 (4H chart)
CRUDE WTI
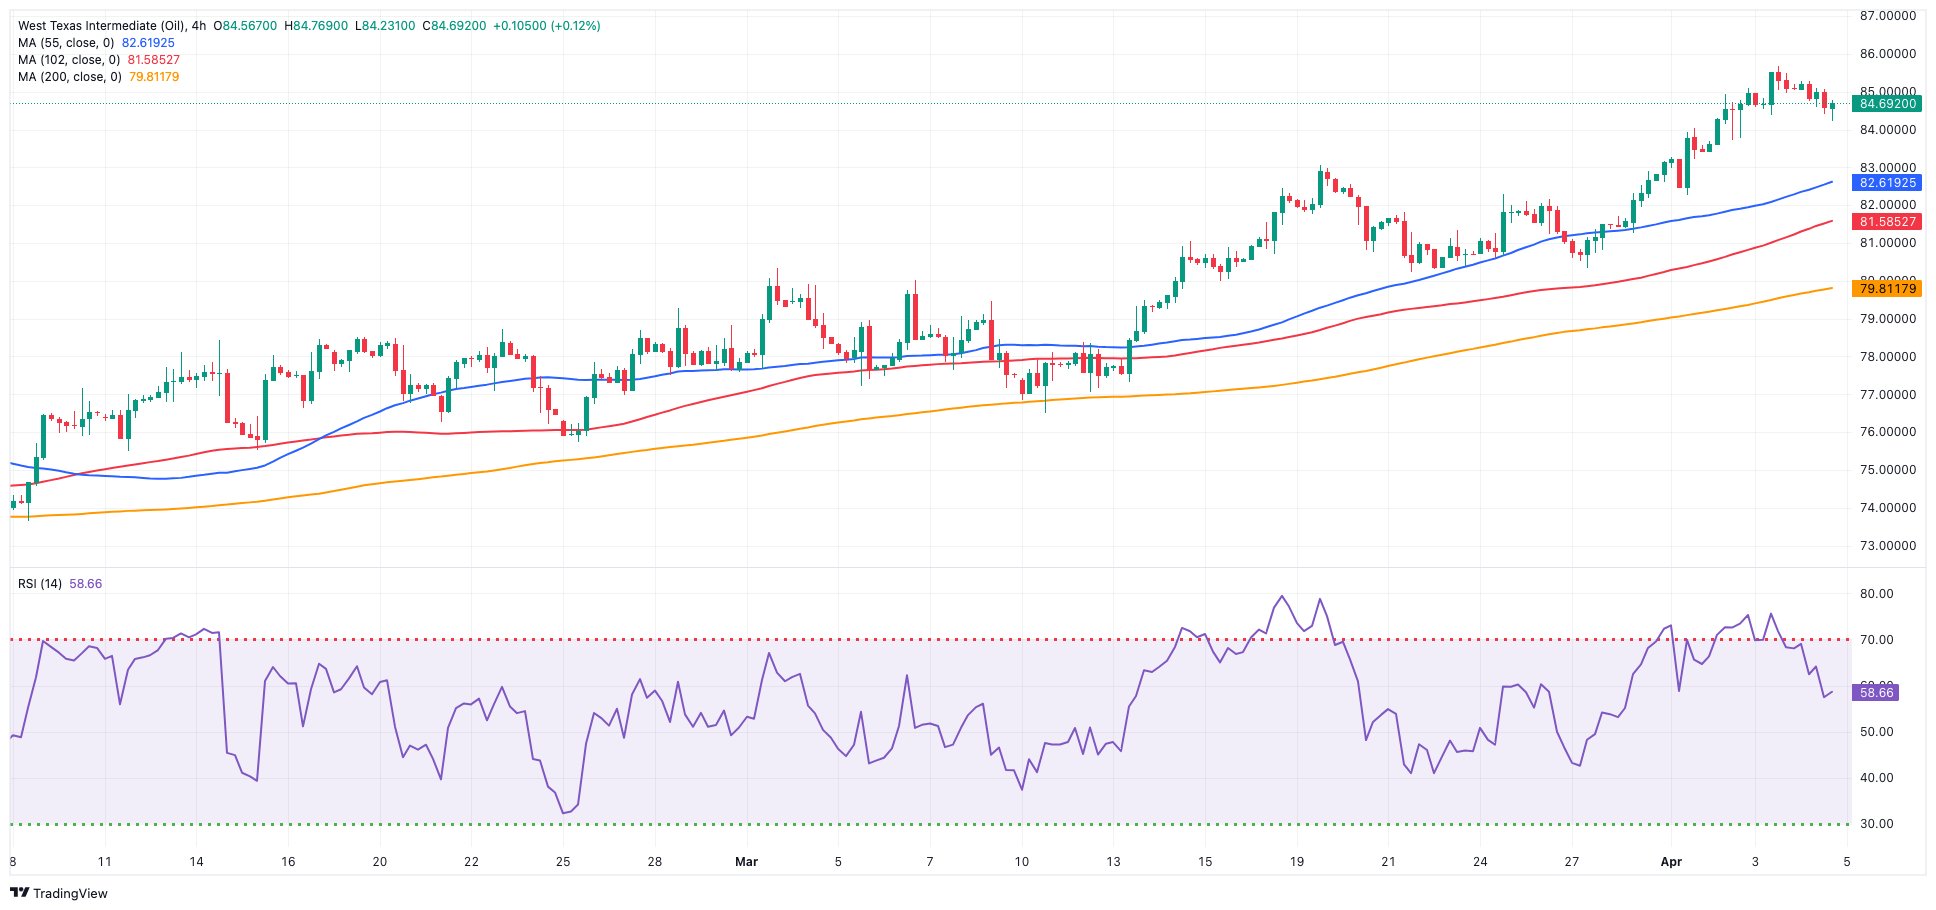
WTI prices traded on the defensive after five consecutive daily advances on Thursday, including Wednesday’s multi-month highs past the $86.00 mark per barrel.
Rising geopolitical effervescence in the Middle East and the Russia-Ukraine war maintained the commodity near recent tops on Thursday, along with recent auspicious Chinese results.
In addition, the recent decision by the OPEC+ to uphold their existing range of production cuts painted a constrained picture for crude oil in the short run and also added to the commodity’s price action.
Somewhat weighing on the upside potential emerged renewed uncertainty regarding the timing of the start of the Fed’s easing cycle ahead of Friday’s NFP as well as the unexpected weekly build of US crude oil inventories, as per the EIA’s report (+3.210M barrels).
The next upward challenge for WTI is the 2024 peak of $86.16 (April 3), which precedes the weekly high of $89.83 (October 18, 2023) and the 2023 top of $94.99 (September 28, 2023). Further up, the weekly peak of $97.65 (August 30) falls just shy of the psychological $100.00 level. Having said that, the 200-day SMA should provide some support at $79.07, prior to the February low of $71.43 (February 5) and the critical $70.00 level. Additional losses might push prices over the 2024 low of $69.31 (January 3) ahead of the December 2023 low of $67.74 (December 13).
Resistance levels: $86.16 $89.82 $94.99 (4H chart)
Support levels: $82.58 $80.51 $76.76 (4H chart)
GER40
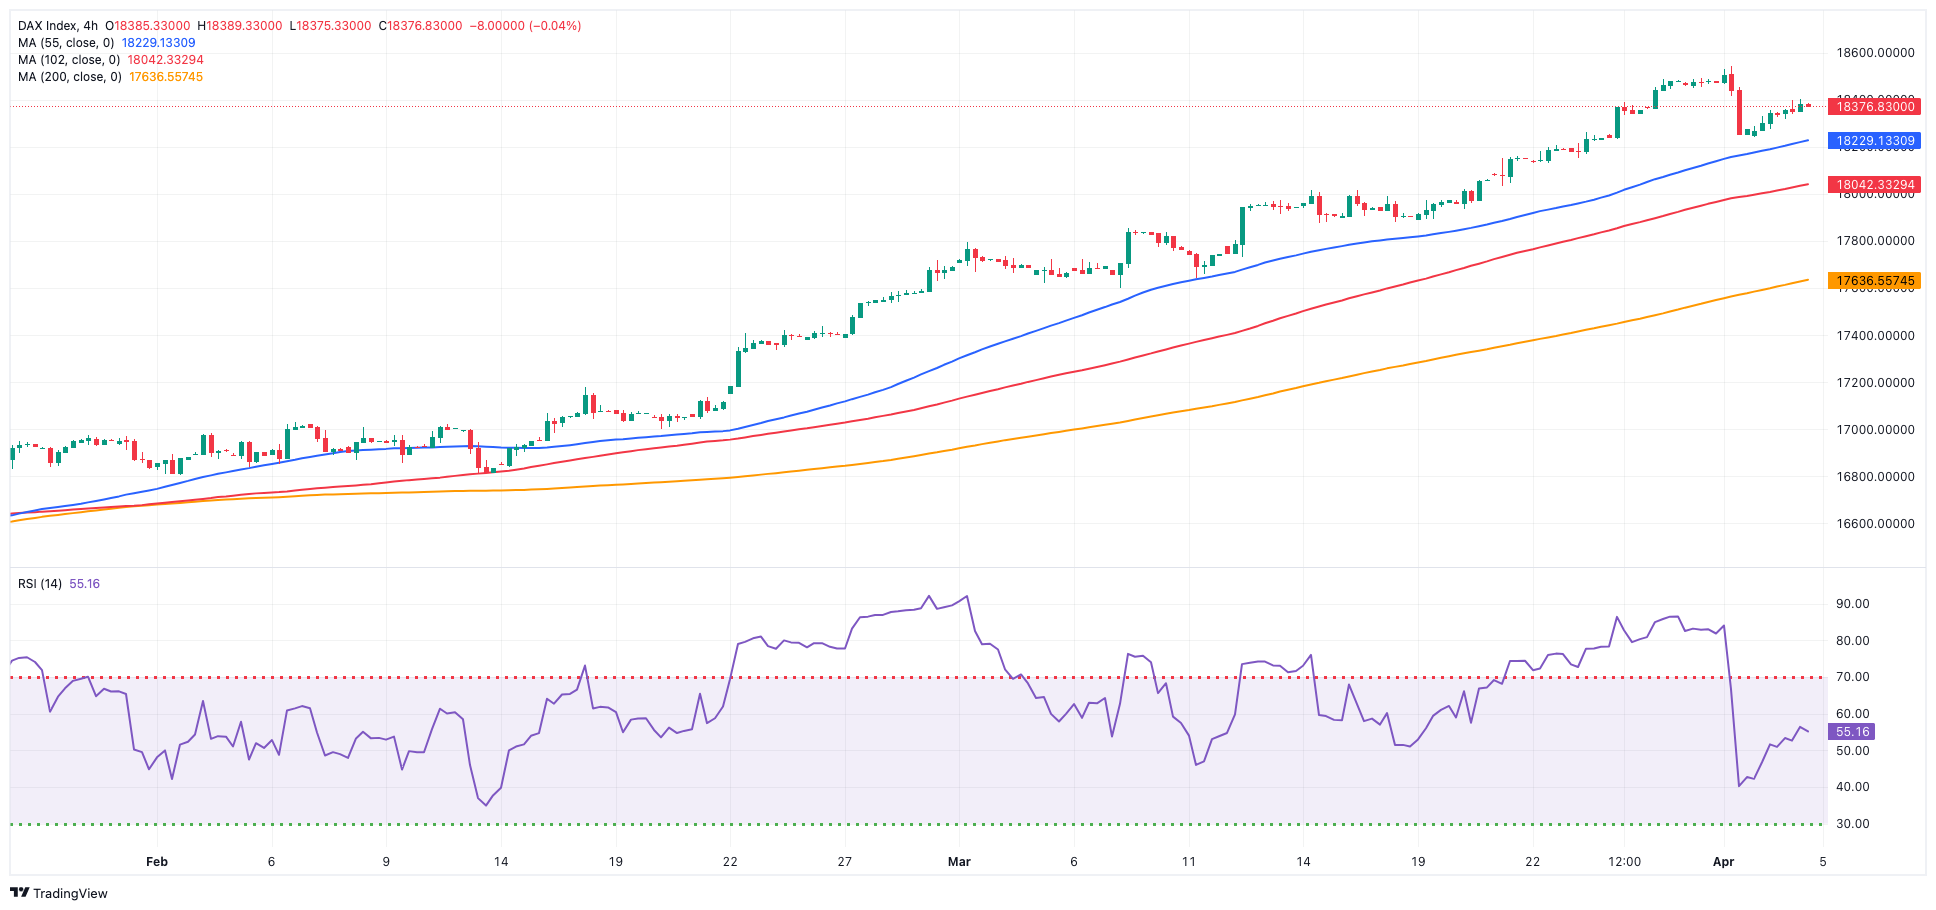
German equities, gauged by the reference DAX40, added to Wednesday’s recovery and regained the 18,400 region on Thursday.
In fact, European stocks saw a slight uptick on Thursday, with cyclical sectors like mining and automotive leading the way, while investor sentiment was boosted by indications of economic improvement in the euro zone and signs of inflation stabilization.
On the latter, market participants continued to digest weakening eurozone inflation data, which bolstered the case for an ECB rate reduction, most likely to occur in June.
Still around the ECB, the bank is widely anticipated to hold interest rates unchanged at its policy meeting next week, while markets predict a 25 bps rate cut in June.
In the money market, German 10-year bund yields retreated further south and retested 2.35%.
The DAX40's next level of resistance is the record high of 18,567 (April 2). The other way around, the 55-day SMA of 17,443 should give temporary support before the February low of 16,821 (February 1). A dip below this level might take the index to its 2024 low of 16,345 (January 17), ahead of the critical 200-day SMA of 16,300. After dropping below the latter, the weekly low of 15,915 (November 28) may be tested, followed by the October low of 14,630 (October 23) and the 2023 bottom of 14,458 (March 20). The daily RSI dipped and rebounded past 72, maintaining the overbought condition.
Best Performers: Siemens Energy AG, BMW ST, Volkswagen VZO
Worst Performers: Munich Re Group, Hannover Rueck SE, Symrise AG
Resistance levels: 18,567 (4H chart)
Support levels: 18,275 17,902 17,619 (4H chart)
GBPJPY
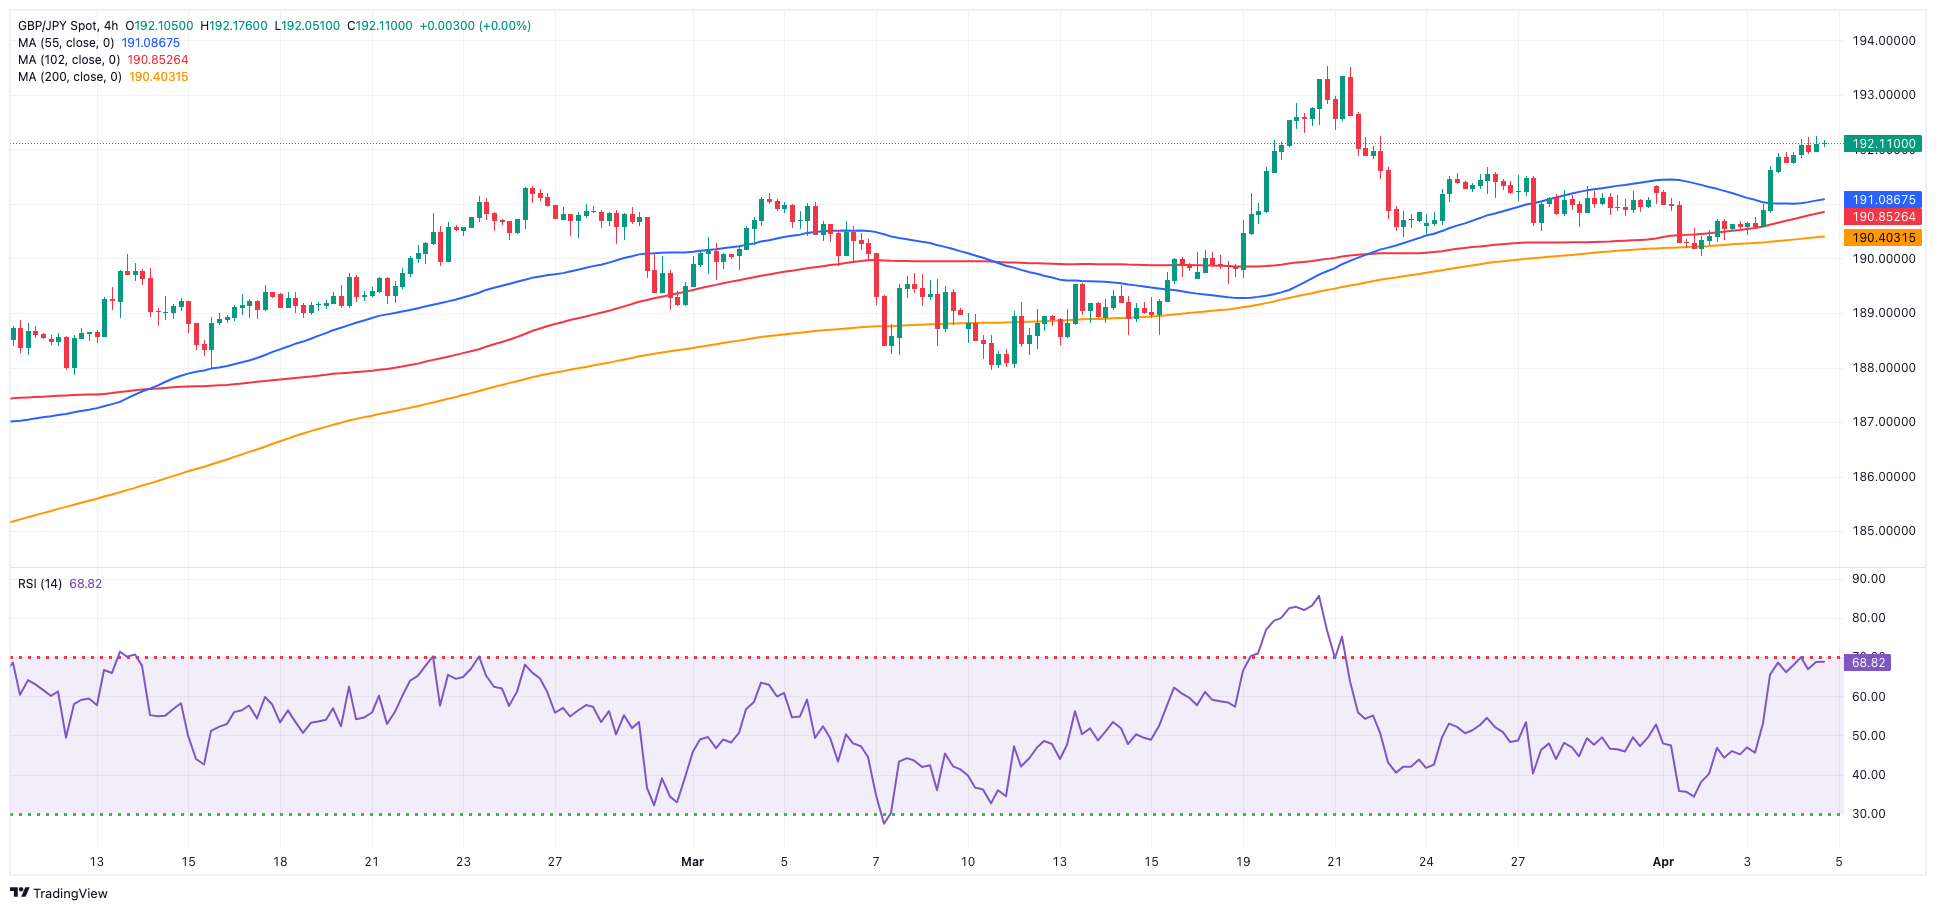
The increasing buying activity in the risk-linked assets lent extra legs to the sterling, encouraging GBP/JPY to add to Wednesday’s gains and reach new multi-day highs past the 192.00 hurdle on Thursday.
In fact, the dollar's extra weakness provided essential support to the risk environment, supporting further upside in the cross, while extra consolidation around the Japanese yen contributed to the day's gains.
Currently, downside swings in the cross appear to be limited around the 190.00 level, with yearly highs in the mid-193.00s acting as a barrier to additional upward potential.
If bulls push stronger, GBP/JPY may encounter an immediate upward hurdle at the so-far April peak of 192.25 (April 4) ahead of the 2024 high of 193.53 (March 20). Further up comes the August 2015 top of 195.28 (August 18) and the record peak of 195.88 (June 24, 2015). In the opposite direction, the 55-day SMA at 189.51 reinforces the April low of 190.04 ahead of March's low of 187.96 (March 11) and the intermediate 100-day SMA at 187.10. Once the latter is breached, the cross may face the February low of 185.22 (February 1), which comes before the critical 200-day SMA of 185.06. A deeper retracement might bring the December 2023 low of 178.33 (December 14) back into view, before the October 2023 low of 178.03 and the July 2023 low of 176.31 (July 28). The everyday RSI ticked higher past 60.
Resistance levels: 192.25 193.53 195.28 (4H chart)
Support levels: 190.39 190.04 189.54 (4H chart)
NASDAQ
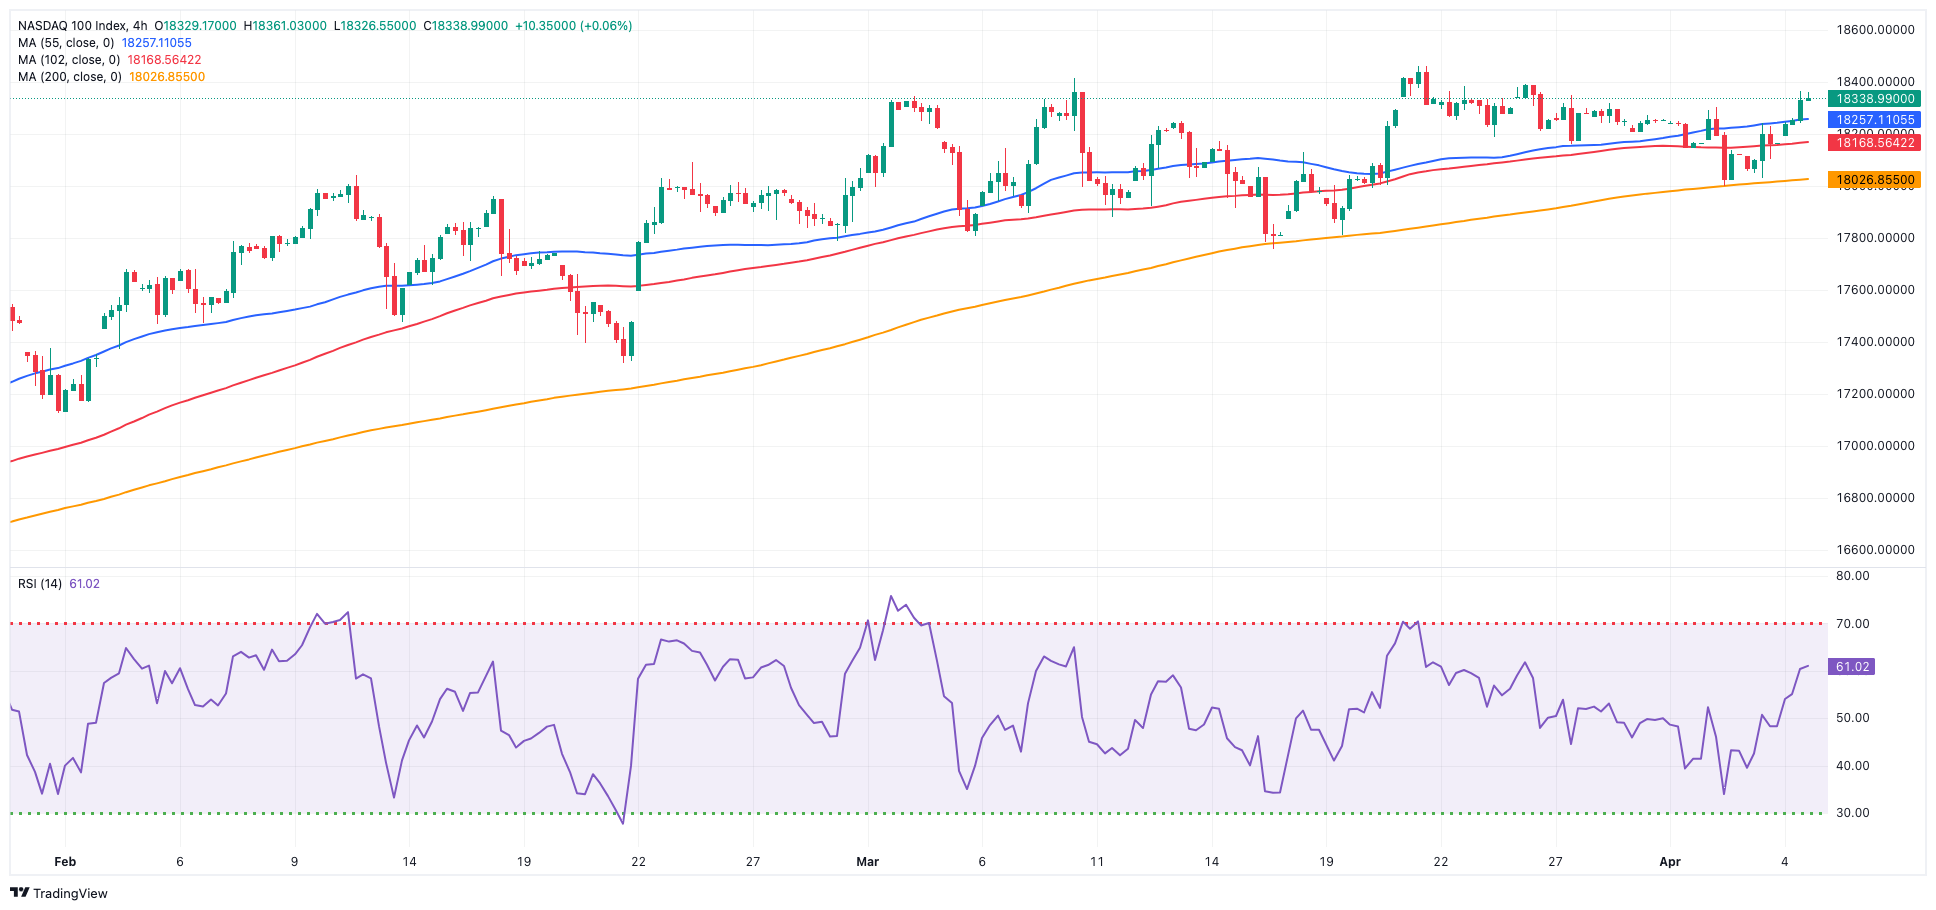
The key US tech index Nasdaq 100 rose in tandem with the broad-based bullish bias in the US markets on Thursday.
Indeed, the tech sector maintained Wednesday’s upbeat mood ahead of Friday’s release of the March NFP, while investors continued to assess the increasing likelihood that the Fed could start reducing its interest rates as soon as at its June gathering.
The extra advance in the index was also underpinned by another negative session in the dollar and mixed moves in US yields across the curve.
Further gains might lift the Nasdaq 100 past its all-time high of 18,464 (March 21). Having said that, the index is expected to find short-term support at the 55-day SMA of 17,843 before falling to weekly lows of 17,319 (February 21) and 17,128 (January 31). If the latter is breached, a challenge to the 2024 low of 16,249 (January 5) may emerge ahead of the crucial 200-day SMA of 16,113 and the December 2023 low of 15,695 (December 4). Additional losses from here may return to the October 2023 level of 14,058 (October 26), which comes before the April 2023 low of 12,724 (April 25) and the March 2023 low of 11,695 (March 13). The daily RSI rose above 58.
Top Gainers: Tesla, Meta Platforms, MongoDB
Top Losers: Lululemon Athletica, AMD, O’Reilly Automotive
Resistance levels: 18,464 (4H chart)
Support levels: 18,002 17,764 17,319 (4H chart)
DOW JONES
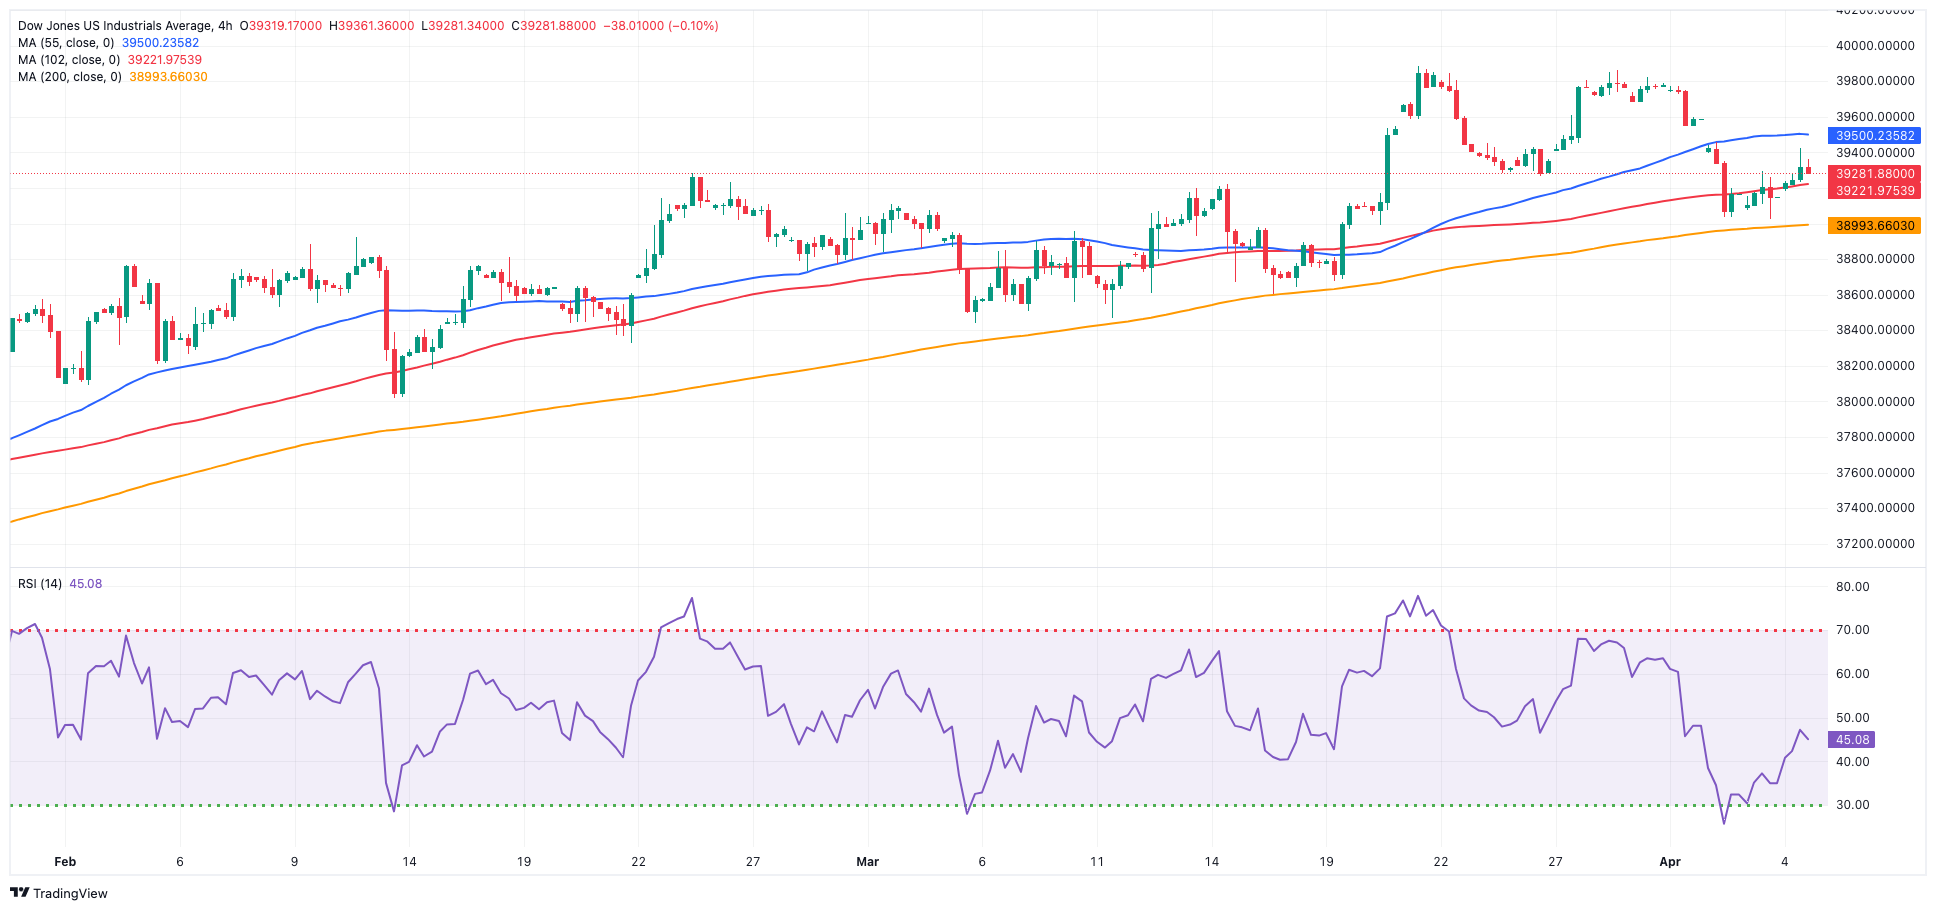
Investors’ optimism seems to have returned on Thursday, motivating the benchmark Dow Jones to trade with decent gains around the 39,300 zone.
The Dow’s improvement came on the back of recent economic reports, which boosted the prospect of monetary policy easing later this year (summer?), while investors awaited policymakers to offer clues on the timing of the cuts as well as the publication of US Non-farm Payrolls on Friday.
On Thursday, the Dow Jones rose 0.32% to 39,251, the S&P 500 advanced 0.64% to 5,244, and the tech-focused Nasdaq Composite gained 1.04% to 16,447.
If bulls regain the initiative, the Dow Jones could attempt to break its record high of 39,889 (March 21). On the contrary, the 55-day SMA of 38,746 provides intermediate support before the 2024 low of 37,122 (January 18) and the weekly low of 37,073 (December 20, 2023). A breakdown of this region reveals the tentative 100-day SMA at 37,708 before the 200-day SMA at 35,986. The weekly low of 33,859 (November 7, 2023) is followed by the October 2023 low of 32,327 (October 27), all ahead of the 2023 bottom of 31,429 (March 15). The daily RSI increased marginally beyond 52.
Top Performers: Microsoft, Boeing, Travelers
Worst Performers: 3M, Amgen, Merck&Co
Resistance levels: 39,889 (4H chart)
Support levels: 39,017 38,457 38,039 (4H chart)
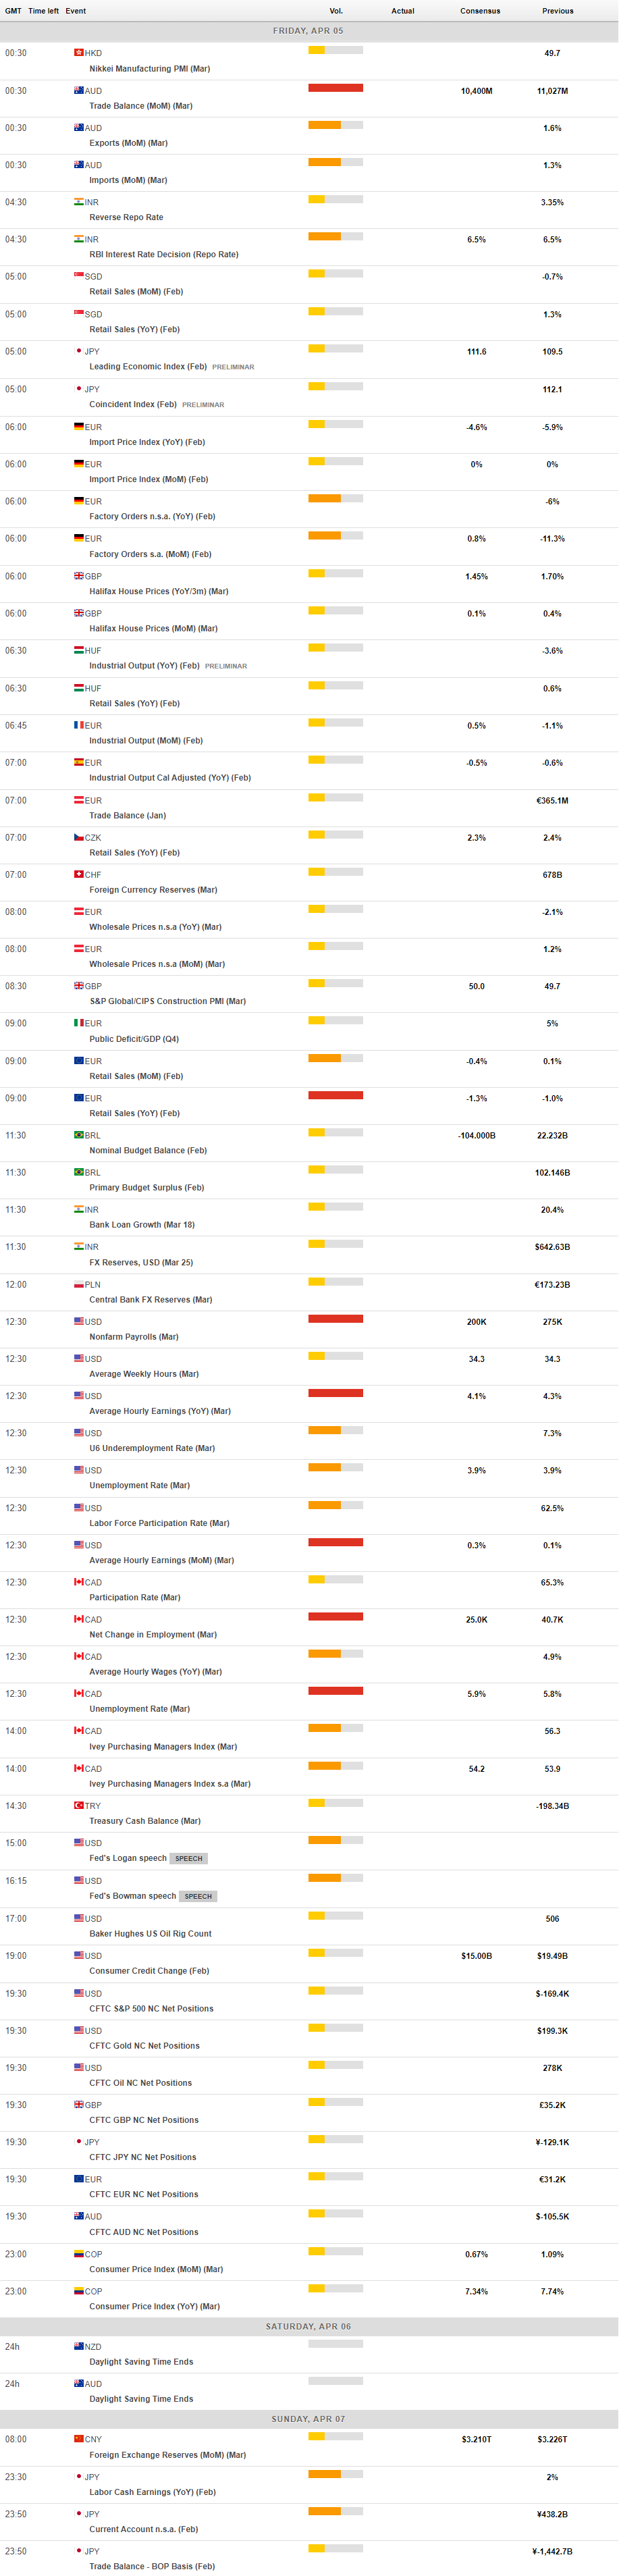
MACROECONOMIC EVENTS
All Information & Updates provided by:

All information relating to the financial markets available on this page has been prepared and issued by FXStreet (Forexstreet SL, Spain, Reg: B62498233) on the basis of publicly available information and all information believed to be reliable and does not conflict with Kuwaiti local laws, and all necessary care has been taken to before the company to ensure that the facts mentioned are correct from the source.
NCM Investment nor any of its directors or employees shall in any way be held responsible for the contents of this news, and the information contained on this page is intended only to provide clients with publicly available information and should not be construed as investment advice, report or analysis and/or constitute an offer or invitation to buy or sell financial instruments of any kind.
RISK WARNING: Forex and CFDs are highly risky leveraged products, as losses can exceed deposits. Please ensure you understand all the risks and take independent advice if necessary. NCM will segregate the clients based on the criteria of the regulator and its bylaws. NCM does not provide any advisory service; the material published does not constitute advice or a recommendation for a transaction in any financial instrument. NCM accepts no responsibility for any use of the content presented and any consequences of that use. Anyone acting on the information provided does so at their own risk.