
- Contact Us:
-

-

-

-


Daily Market Updates
08 Apr 2024
EURUSD
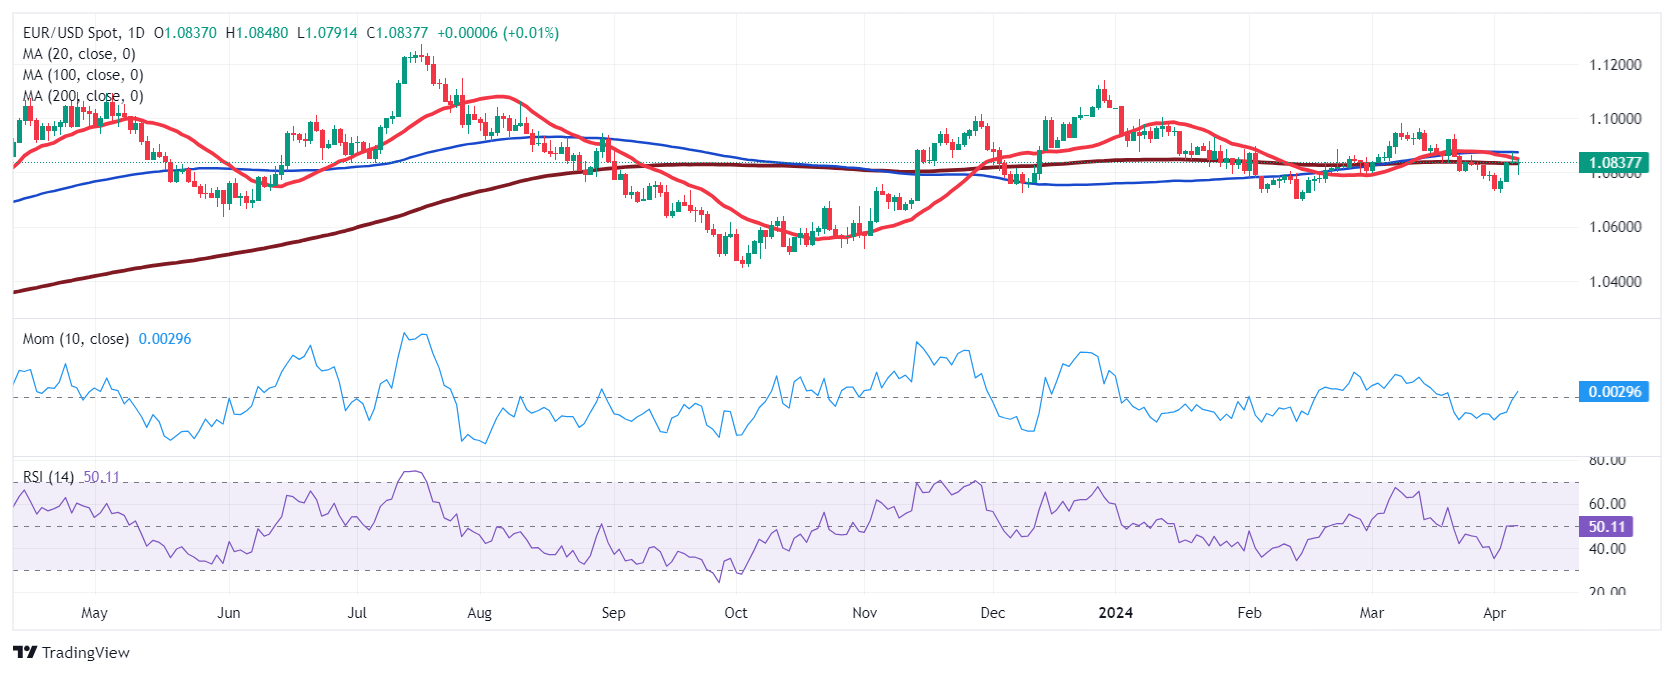
EUR/USD ended Friday’s session around Thursday’s closing levels in the 1.0835–10840 band against the backdrop of marginal gains in the greenback. Looking at the weekly chart, the pair closed its first week of gains after three consecutive retracements.
In fact, the dollar managed to regain composure after US Non-farm Payrolls surprised to the upside once again, this time adding 303K jobs in March, while the Unemployment Rate eased to 3.8% and Average Hourly Earnings increased by 4.1% from a year earlier.
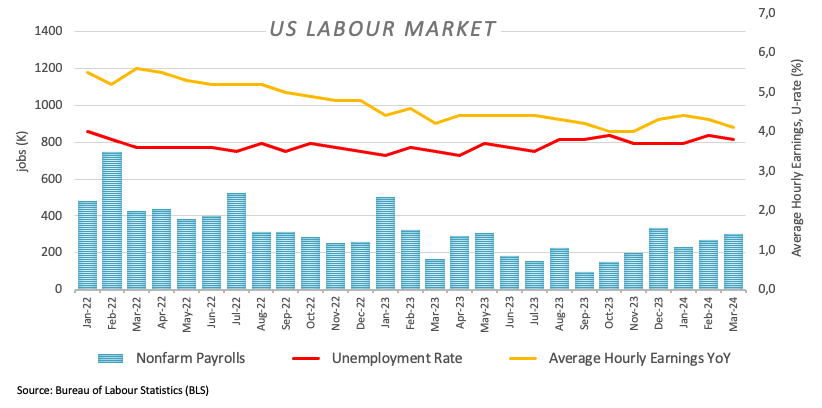
The solid job creation in the US left intact prospects of a “soft landing” of the economy, while trimming bets on an interest rate cut by the Federal Reserve at its June 12 gathering in favour of a later move (September?).
Speaking about interest rates, FOMC M. Bowman argued that the Fed shouldn't contemplate reducing its interest rate target at present, emphasizing that further rate hikes could be an option if efforts to curb inflation encounter obstacles. Sharing this view, L. Logan (Dallas) highlighted that the current inflation environment, marked by escalating upside risks, does not support an immediate move towards looser monetary policy by the Fed.
Friday’s price action in spot came pari passu with the uptick to multi-day highs in US yields across different timeframes.
In the euro docket, Retail Sales in the euro bloc contracted by 0.7% in the year to February.
Extra gains in EUR/USD may now challenge the weekly peak of 1.0876 (April 4) ahead of the March high of 1.0981 (March 8), and the weekly top of 1.0998 (January 5, 2011), which is supported by the psychological 1.1000 barrier. The breakout of this zone may put pressure on the December 2023 peak of 1.1139 (December 27), which is still supported by the 200-week SMA of 1.1144 and comes before the 2023 high of 1.1275 (July 18). In contrast, the pair may test the April low of 1.0724 (April 2) before reaching the 2024 low of 1.0694 (February 14). A deeper decrease could reveal the weekly low of 1.0495 (October 13, 2023), which is prior to the 2023 low of 1.0448 (October 3) and the round milestone of 1.0400. The daily RSI settled around the 50 threshold.
Resistance levels: 1.0876 1.0942 1.0963 (4H chart)
Support levels: 1.0791 1.0724 1.0694 (4H chart)
USDJPY
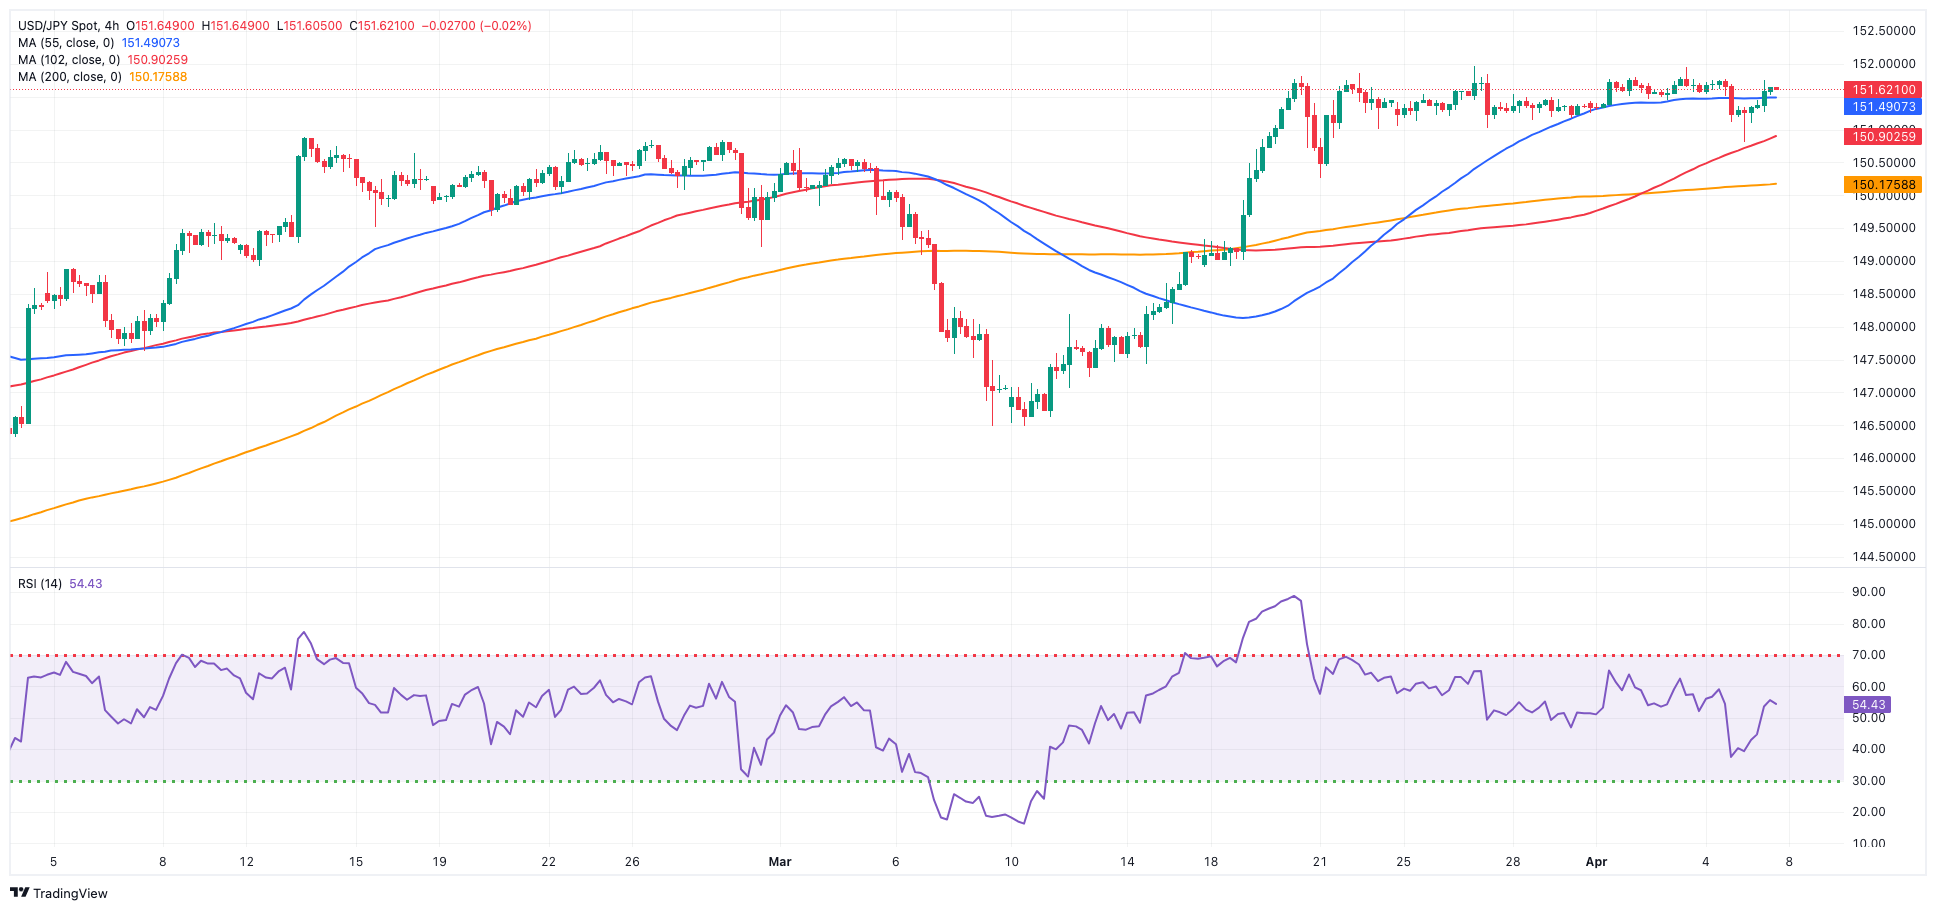
On Friday, USD/JPY maintained its lacklustre performance within a narrow trading range, consistently hovering near the significant 152.00 level.
The pair's behaviour was in tandem with quite a volatile session in the dollar, while US yields edged higher across the curve, particularly after the stronger-than-expected US Non-farm Payrolls readings.
Still around the bond market, JGB 10-year yields advanced for the sixth consecutive session, trading at shouting distance from 0.80%.
Meanwhile, investors are anticipated to exercise caution amidst the likelihood of FX intervention as long as spot trading remains in proximity to the 152.00 level. PM Kishida affirmed on Friday Japan's commitment to employ all available measures to address excessive FX fluctuations, while finmin Suzuki reiterated the undesirability of rapid FX movements and did not dismiss any potential courses of action to manage such fluctuations. Additionally, BoJ Governor Ueda emphasized the importance of FX stability, aligned with underlying economic fundamentals. He added that the BoJ, in steering monetary policy, does not directly target foreign exchange rates.
In Japan, Household Spending contracted by 0.5% YoY in February, while the flash Coincident Index and Leading Economic Index came in at 110.9 and 111.8, respectively, in the same month.
USD/JPY has an immediate upward hurdle at the 2024 high of 151.97 (March 27), just below the round number of 152.00. Conversely, the pair is projected to find interim support at the 55-day and 100-day SMAs of 149.58 and 147.69, respectively, before the critical 200-day SMA of 147.06 and the March low of 146.47 (March 8). A breakdown of this zone might result in a return to the February low of 145.89 (February 1), which is prior to the December 2023 low of 140.24 (December 28), the round number 140.00, and the July low of 137.23 (July 14). The daily RSI climbed past 62.
Resistance levels: 151.97 155.80 155.88 (4H chart)
Support levels: 150.81 150.26 150.16 (4H chart)
GBPUSD
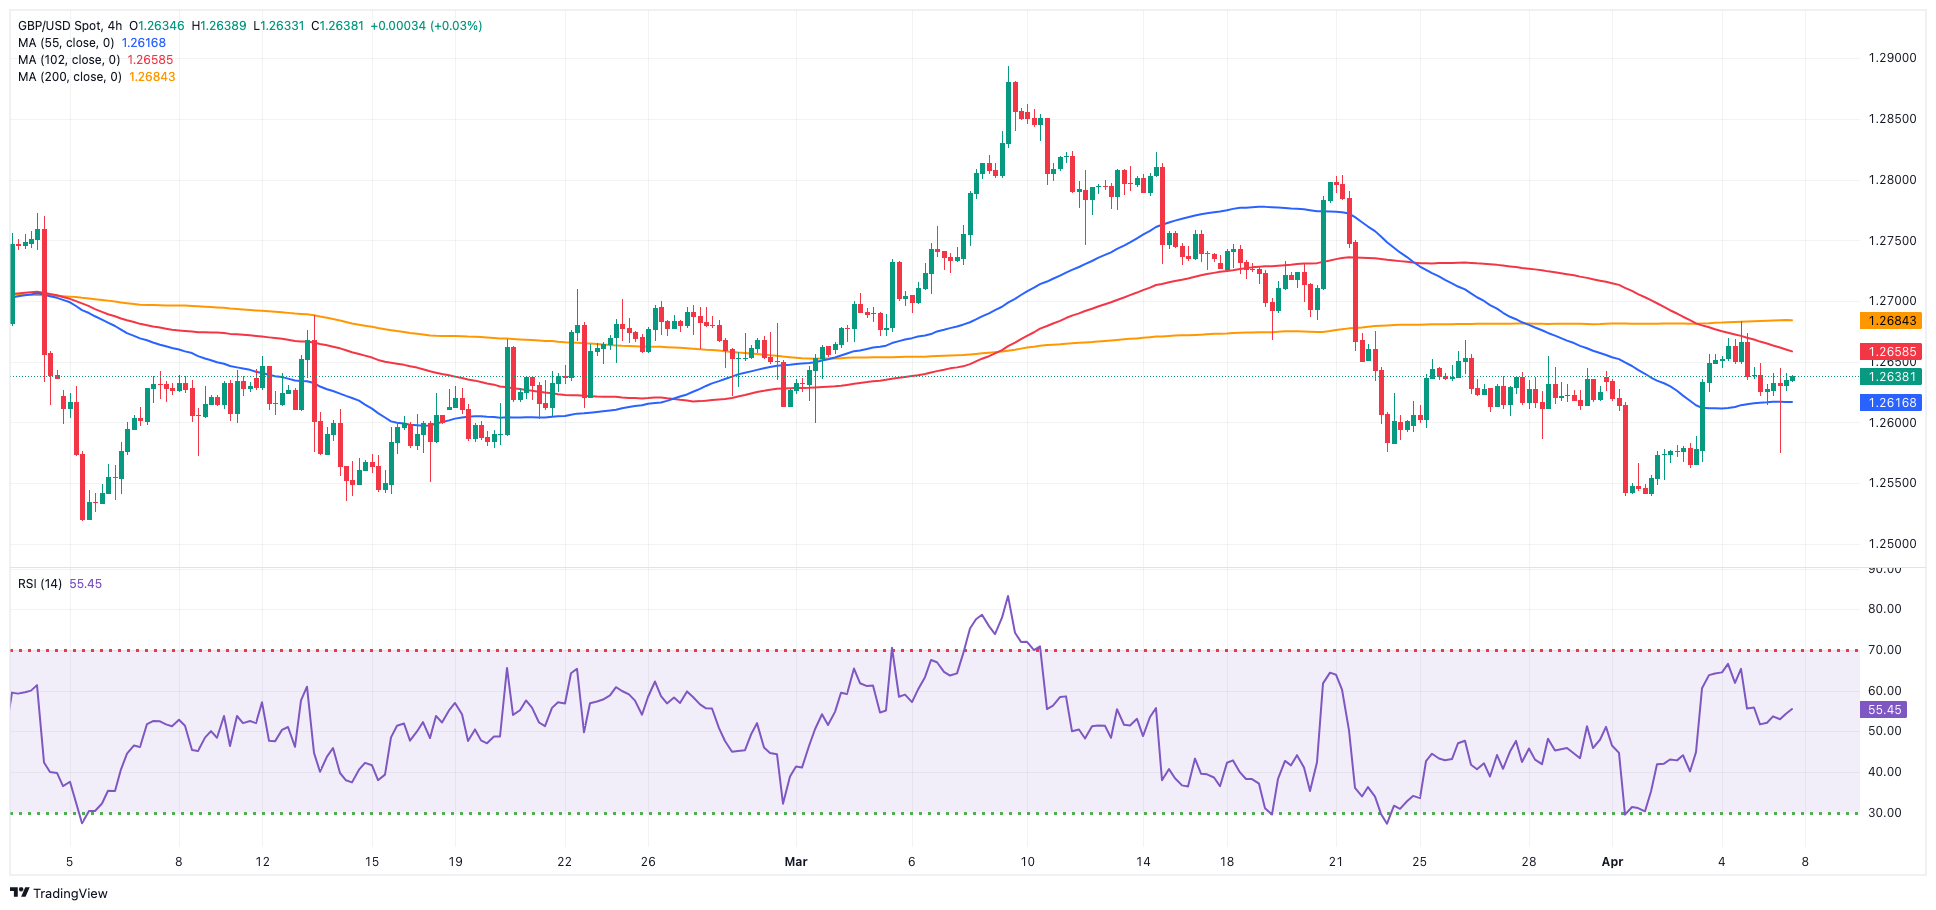
The pessimism around GBP/USD remained unchanged in the latter part of the week, although it did not help spot to clinch its second consecutive week of gains and end Friday’s session beyond 1.2600 the figure.
Indeed, Cable charted modest losses on Friday despite bouncing off post-NFP lows near 1.2570, as the initial rebound in the greenback lost upside momentum towards the end of the NA session.
Price action around spot, in the meantime, was accompanied by the recovery of UK 10-year gilts past the 4.0% level, setting aside two daily drops in a row.
In the UK, the S&P Global Construction PMI rose to 50.2 in March.
The continuation of the rebound could see GBP/USD dispute the 2024 high of 1.2893 (March 8), followed by the weekly top of 1.2995 (July 27, 2023) and the key 1.3000 level. On the contrary, early support is found at the April low of 1.2539 (April 1, 2), which comes before the 2024 low of 1.2518 (February 5) and the December 2023 low of 1.2500 (December 13). A deeper slide would not find major support until the weekly low of 1.2187 (November 10, 2023), which is preceding the October 2023 low of 1.2037 and the main 1.2000 line. On the daily chart, the RSI eased to the 47 region.
Resistance levels: 1.2683 1.2803 1.2823 (4H chart)
Support levels: 1.2573 1.2539 1.2518 (4H chart)
GOLD
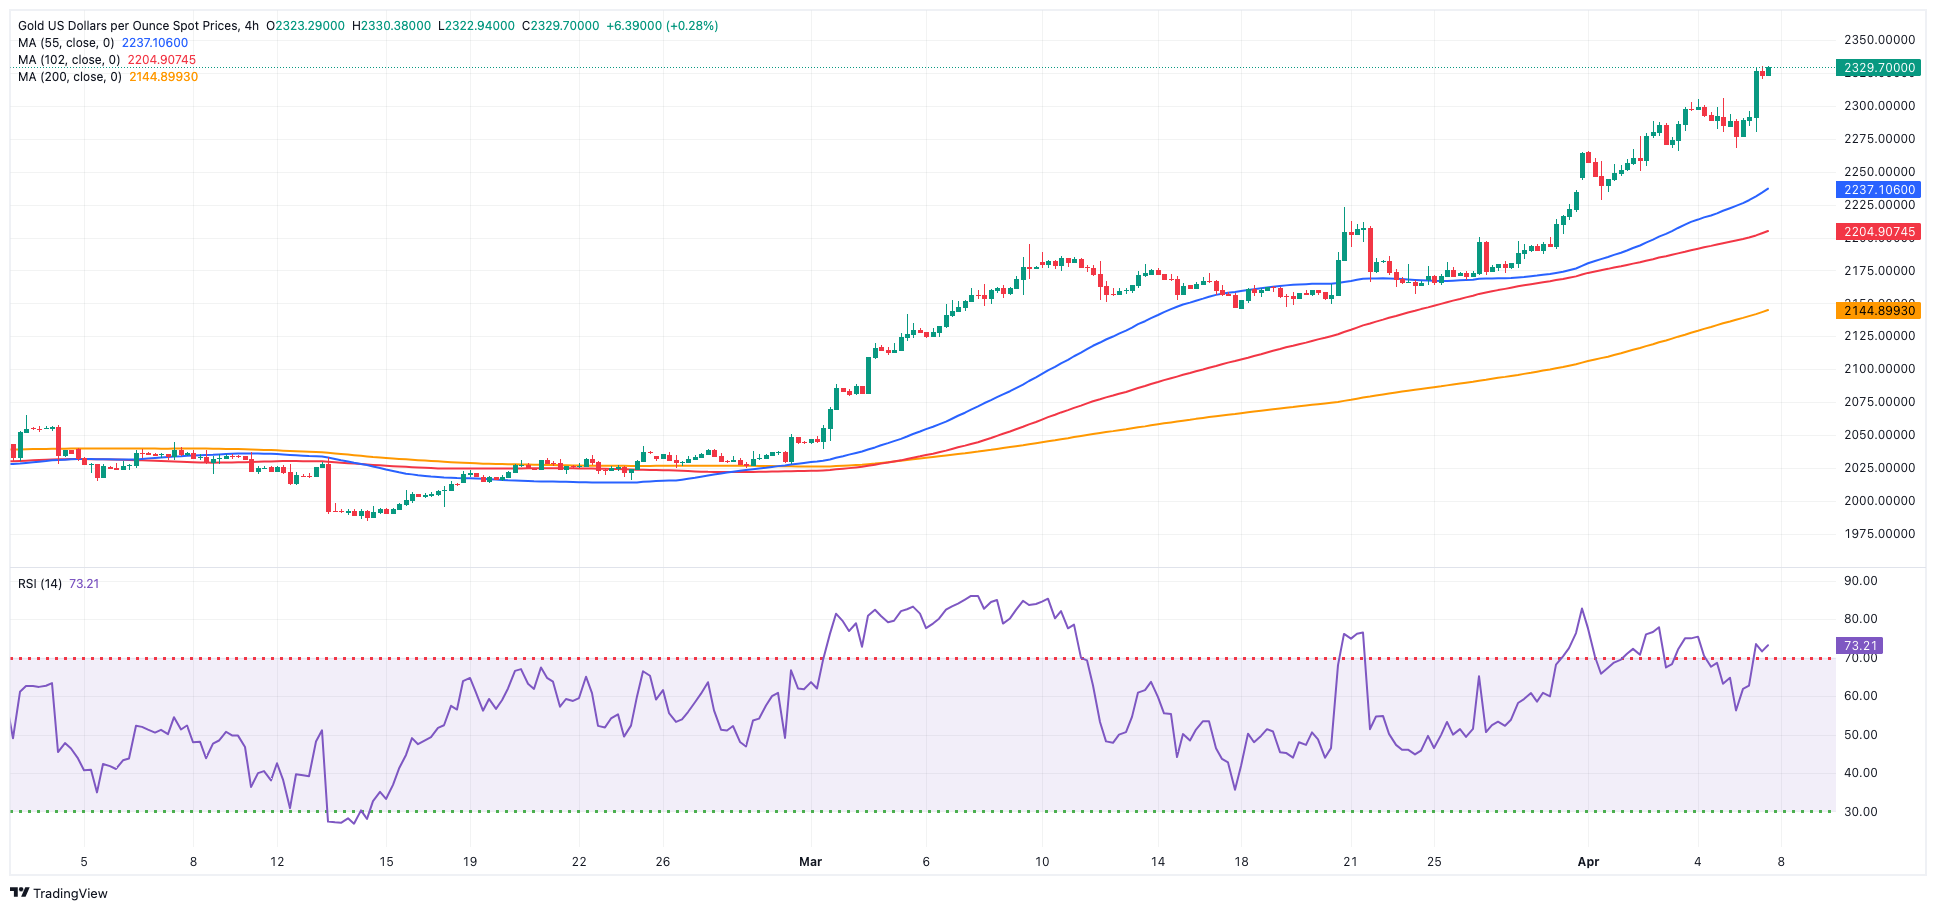
Gold prices surged to reach a new all-time high, buoyed by various factors such as speculation on the Fed’s interest rate cuts, increased speculative purchasing, and continued central bank acquisitions.
Furthermore, the ongoing momentum in bullion's record-breaking rally persisted even in the face of the positive surprise from the US jobs report in March, which showed the economy added more than 300K jobs in March.
Regarding rate cuts, Chair Powell reaffirmed earlier this week that the Fed had no immediate plans to lower borrowing costs, following its decision to maintain the policy rate within the current range of 5.25% to 5.50% last month.
Further bolstering the precious metal’s performance was sustained geopolitical tensions in the Middle East and the ongoing conflict between Russia and Ukraine.
Looking ahead, attention turns to the forthcoming release of US inflation data measured by the CPI, scheduled for next week, which could offer insights into the potential timing of the Fed's inaugural rate reduction.
Gold is facing immediate resistance at its all-time high of $2,330 (April 5). On the downside, the weekly low of $2,146 (March 18) ranks first, followed by the preliminary 55-day and 100-day SMAs of $2,100 and $2,066, respectively. Further south, the 2024 low of $1,984 (February 14) appears to be supported by its proximity to the 200-day SMA ($1,997). Once the latter is cleared, a possible visit to the December 2023 low of $1,973 may emerge on the horizon before the November 2023 low of $1,931. The failure in this region might bring the metal to test its October 2023 low of $1,810, followed by the 2023 low of $1,804, and the important $1,800 conflict zone.
Resistance levels: $2,330 (4H chart)
Support levels: $2,267 $2,228 $2,157 (4H chart)
CRUDE WTI
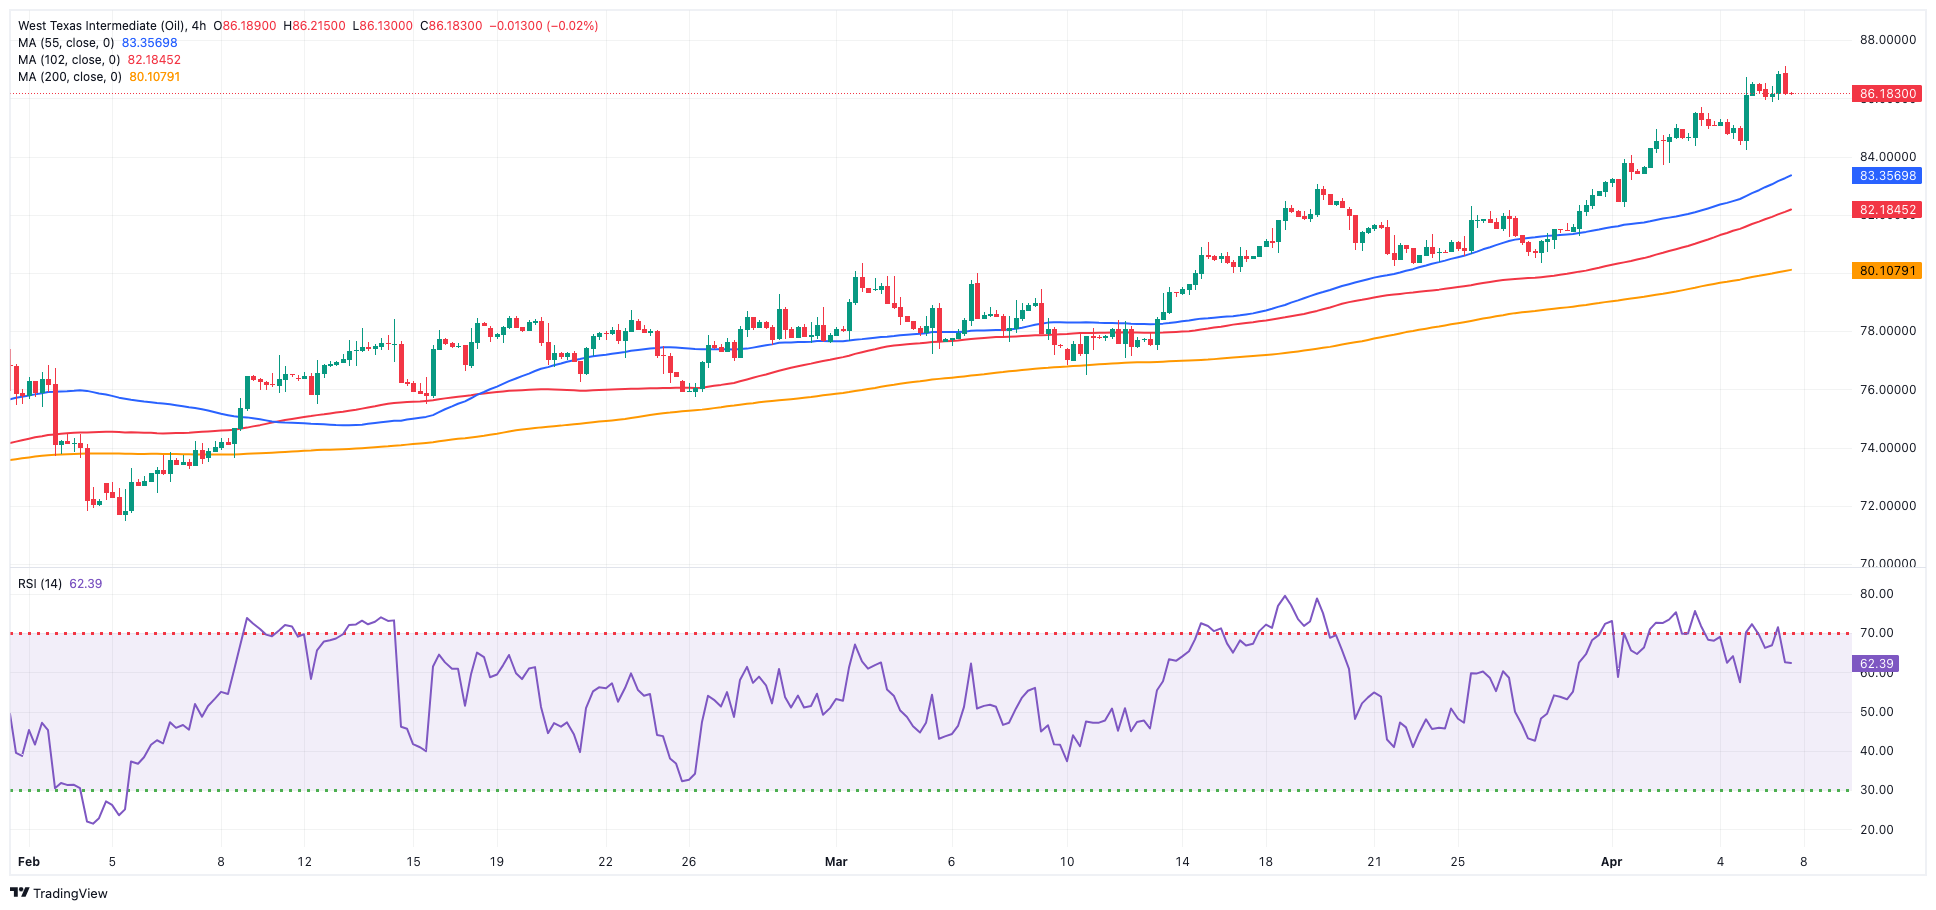
WTI prices concluded the week with a slight downturn despite enjoying six consecutive days of gains, even reaching new highs not seen since mid-October, surpassing the $87.00 per barrel mark.
Geopolitical tensions in the Middle East and the ongoing conflict between Russia and Ukraine sustained the commodity's upward momentum throughout the week, reinforcing the narrative of constrained supply.
Furthermore, the recent resolution by OPEC+ to maintain their current production cut levels depicted a constrained outlook for crude oil in the immediate future and contributed to the weekly price uptick.
Closing the docket, oil rig count went up by 2 to 508 US total active oil rigs in the week ended on April 5 according to energy services firm Baker Hughes.
The next upward challenge for WTI is the 2024 peak of $87.59 (April 5), which comes before the weekly high of $89.83 (October 18, 2023) and the 2023 top of $94.99 (September 28, 2023). Further north, the weekly peak of $97.65 (August 30) is barely short of the psychological $100.00 mark. The other way around, the 200-day SMA should provide some support at $79.17, prior to the February low of $71.43 (February 5) and the key $70.00 barrier. Additional losses might drive prices over the 2024 bottom of $69.31 (January 3) ahead of the December 2023 low of $67.74 (December 13).
Resistance levels: $87.59 $89.82 $94.99 (4H chart)
Support levels: $84.61 $82.58 $80.51 (4H chart)
GER40
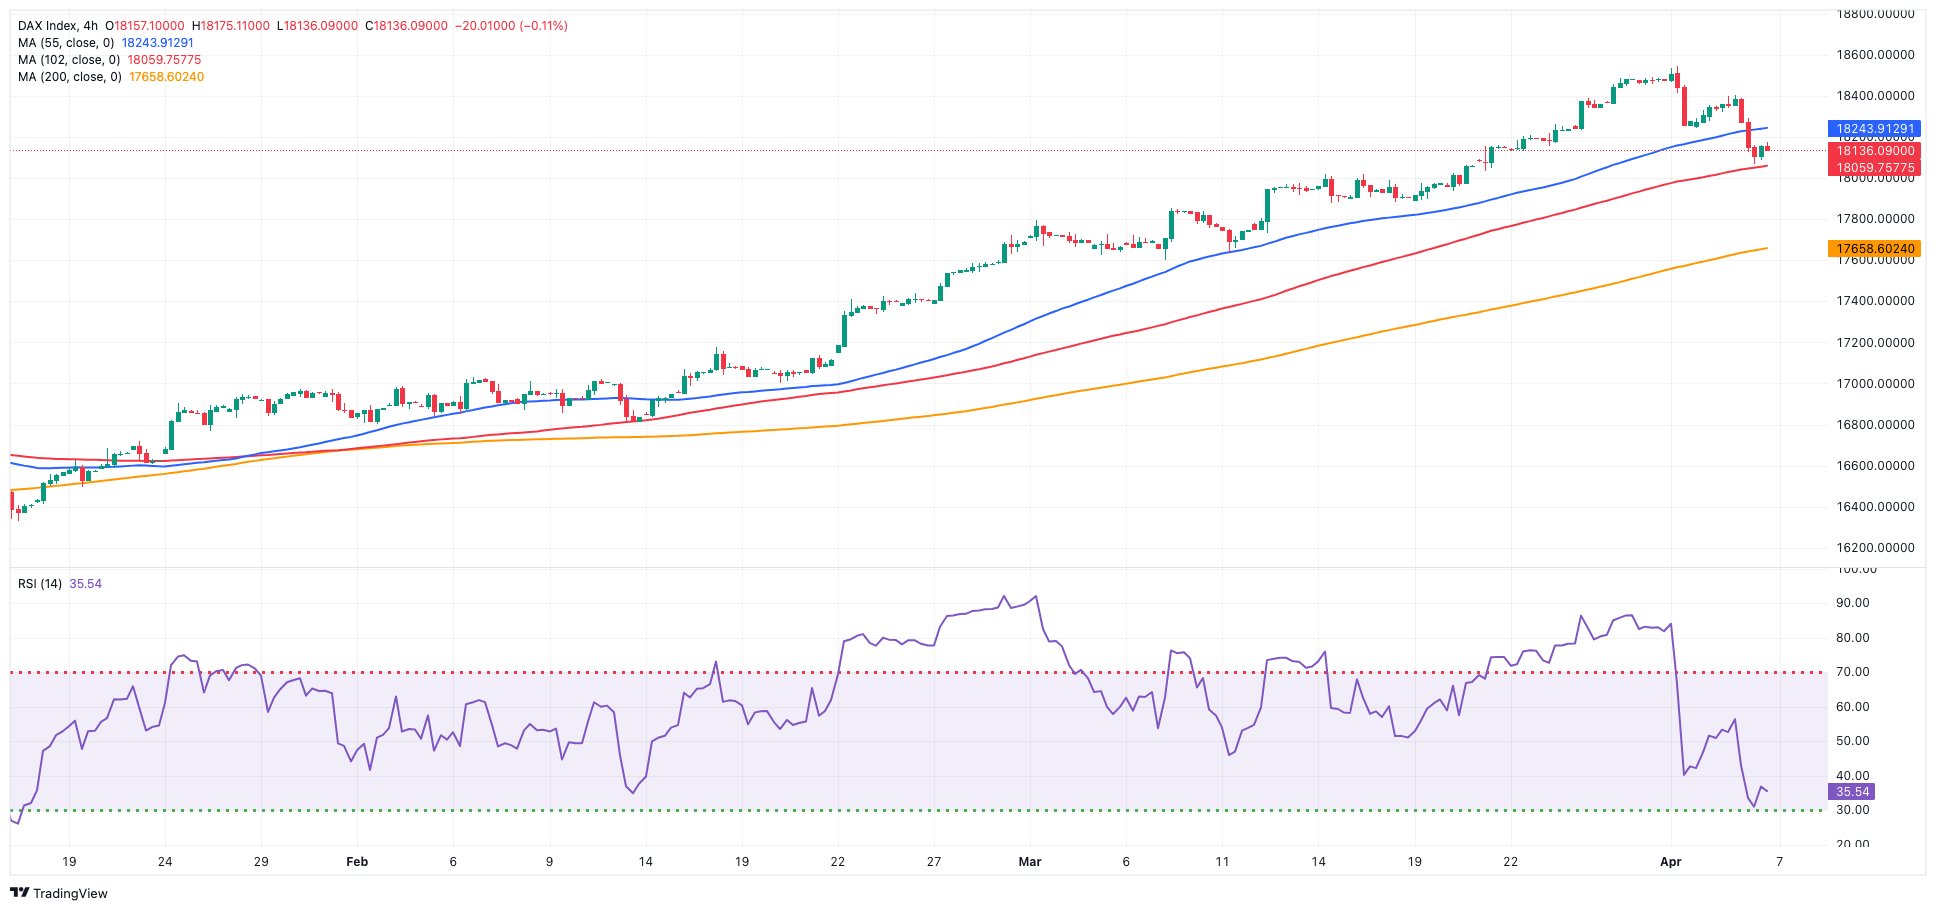
Germany's stock benchmark DAX40 experienced a significant decline on Friday, reaching fresh two-week lows and simultaneously putting an end to an eight-week positive streak.
The prevailing market downturn weighed heavily on investors towards the end of the week, largely in response to hawkish comments from select Fed officials, escalating tensions in the Middle East, and unexpectedly robust US jobs data.
Adding to the subdued sentiment, German 10-year bund yields surged notably, surpassing the 2.40% mark.
Regarding the ECB, investors widely anticipate that the bank will maintain interest rates unchanged at its upcoming policy meeting next week, with a 25 bps rate cut being forecasted for June.
The DAX40's next level of resistance is the record high of 18,567 (April 2). Alternatively, the 55-day SMA of 17,475 should provide temporary support before the February low of 16,821 (February 1). A dip below this level might send the index to its 2024 low of 16,345 (January 17), ahead of the crucial 200-day SMA of 16,312. After falling below the latter, the weekly low of 15,915 (November 28) might be tested, seconded by the October low of 14,630 (October 23) and the 2023 bottom of 14,458 (March 20). The daily RSI plummeted to the sub-59 area.
Best Performers: Deutsche Boerse, Daimler Truck Holding, Siemens Healthineers
Worst Performers: Zalando SE, Bayer, Munich Re Group
Resistance levels: 18,567 (4H chart)
Support levels: 18,088 17,619 17,322 (4H chart)
GBPJPY
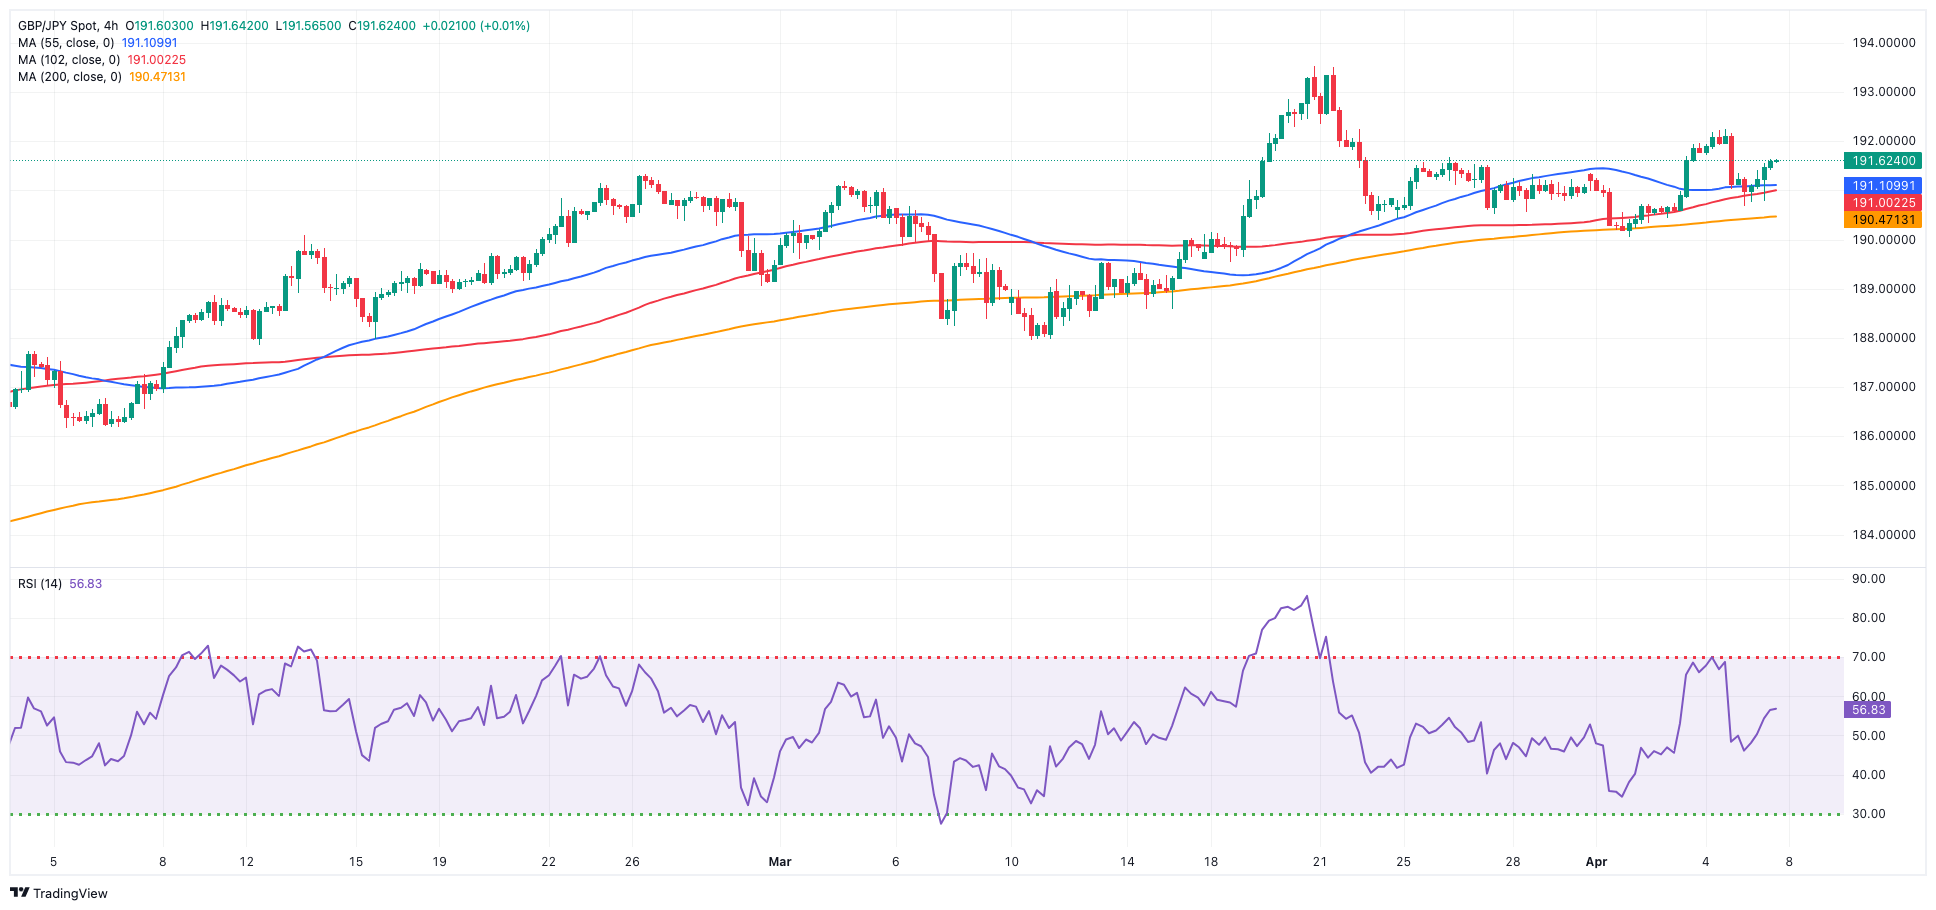
Increasing selling pressure in the Japanese yen bolstered daily gains in GBP/JPY north of the 191.00 barrier at the end of the week.
Indeed, the cross rapidly left behind Thursday’s pullback and resumed its uptrend against the backdrop of further gains in the greenback and the tepid selling bias around the British pound.
Currently, downside swings in the cross appear to be contained around the 190.00 level, with yearly highs in the mid-193.00s acting as a barrier to any upward movement.
If bulls push harder, GBP/JPY may face an immediate upward obstacle at the April peak of 192.25 (April 4), ahead of the 2024 high of 193.53 (March 20). Further up are the August 2015 top of 195.28 (August 18) and the record peak of 195.88 (June 24, 2015). In the opposite direction, the 55-day SMA at 189.56 strengthens the April low of 190.04, ahead of March low of 187.96 (March 11) and the intermediate 100-day SMA at 187.13. If the latter is crossed, the cross may approach the February low of 185.22 (February 1), which falls before the key 200-day SMA of 185.10. A deeper decline may bring the December 2023 low of 178.33 (December 14) back into view before the October 2023 bottom of 178.08 (October 3). The day-to-day RSI ticked higher to the 57 zone.
Resistance levels: 192.25 193.53 195.28 (4H chart)
Support levels: 190.67 190.04 189.54 (4H chart)
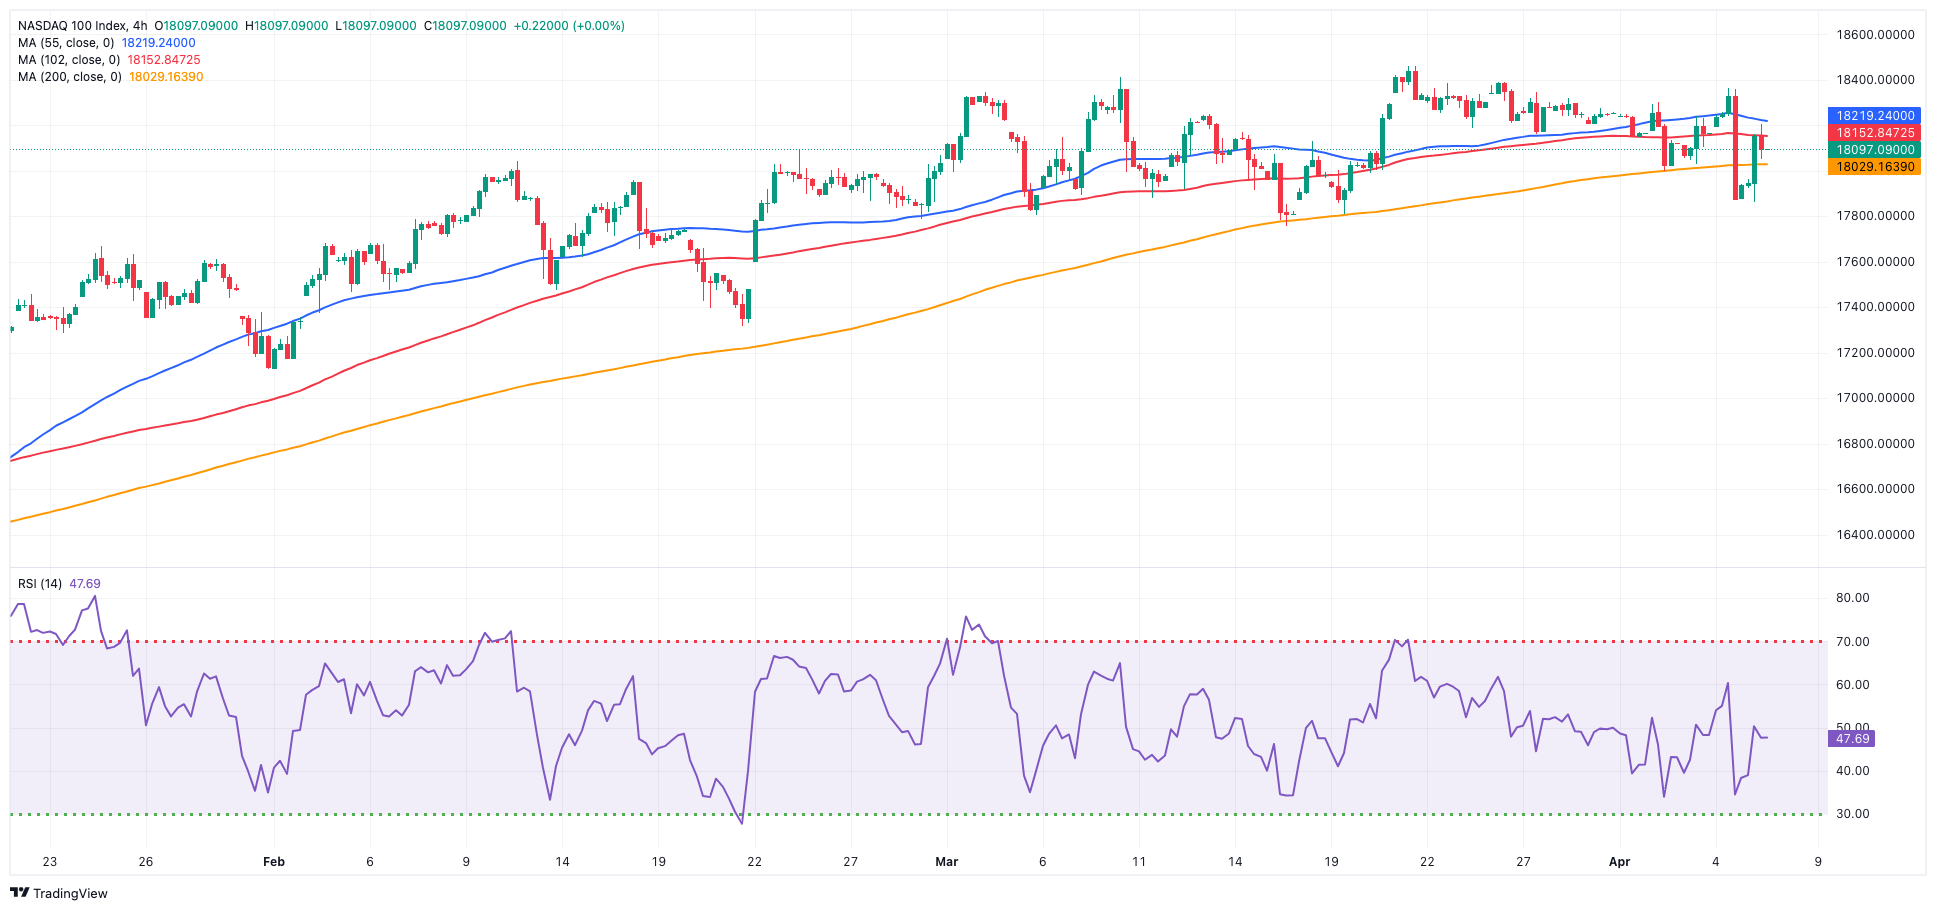
NASDAQ
The tech benchmark Nasdaq 100 swiftly recovered from Thursday's significant retracement and ended the week on a positive note.
The tech sector notably regained positive momentum following March's stronger-than-expected job additions in the US economy. This resurgence in optimism has led to speculation that the Fed may delay its plans for rate reduction.
Currently, the likelihood of a rate cut in June has decreased to approximately 46%, as indicated by the FedWatch Tool provided by CME Group.
Additionally, the index's further advancement was supported by a notable rebound in US yields across various maturity periods.
Further advances might push the Nasdaq 100 above its all-time high of 18,464 (March 21). Having said that, the index is projected to find immediate support at the April low of 17,875 before sliding to weekly lows of 17,319 (February 21) and 17,128 (January 31). If the latter is breached, a challenge to the 2024 low of 16,249 (January 5) could arise ahead of the critical 200-day SMA of 16,126 and the December 2023 low of 15,695 (December 4). Additional losses from here may return to the October 2023 level of 14,058 (October 26), which is prior to the April 2023 low of 12,724 (April 25) and the March 2023 bottom of 11,695 (March 13). The daily RSI climbed beyond 51.
Top Gainers: MongoDB, Constellation Energy, DexCom
Top Losers: Tesla, Intel, Sirius XM
Resistance levels: 18,464 (4H chart)
Support levels: 17,875 17,764 17,319 (4H chart)
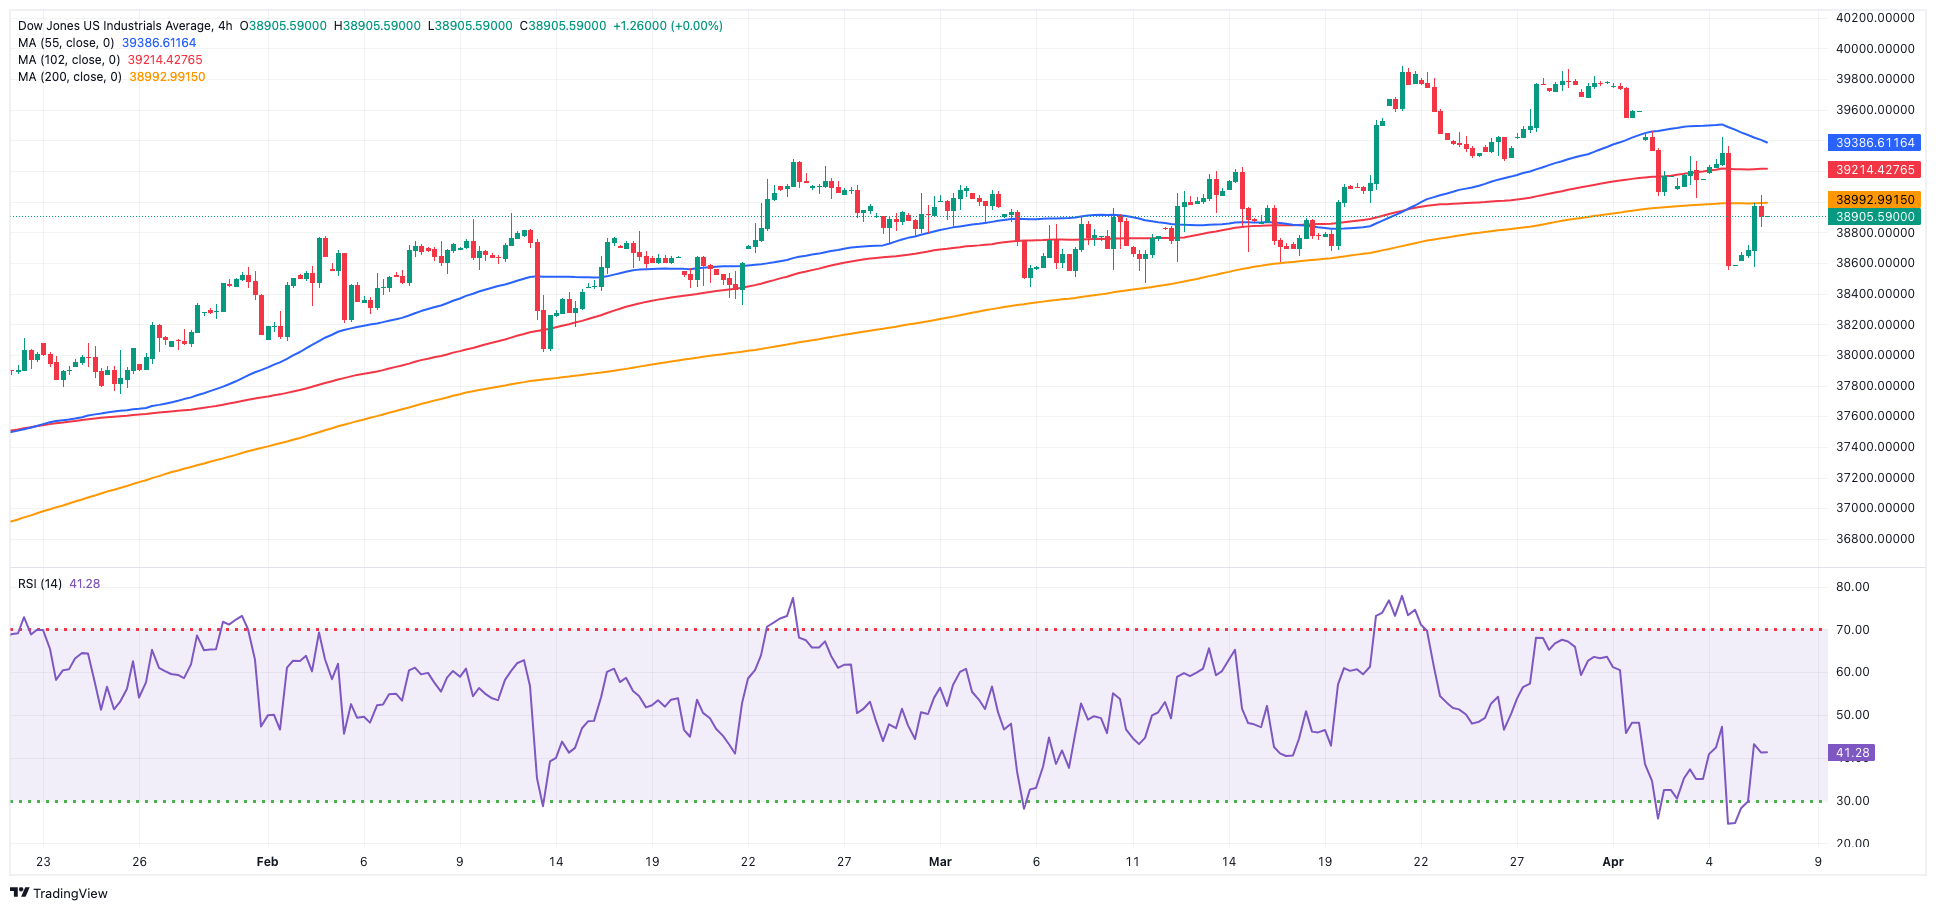
DOW JONES
On Friday, US stocks saw their first weekly rise after rebounding from three-week lows set earlier in the week.
The benchmark Dow Jones index ended the day with decent gains, buoyed by a robust Non-farm Payrolls report (+303K), which underscored the belief in a healthy economy, although it also suggested the Fed might delay interest rate cuts.
Adding weight to the latter, Fed officials Logan and Bowman cautioned against premature speculation regarding potential interest rate cuts.
At the end of the week, the Dow Jones gained 0.80% to 38,904, the S&P 500 rose 1.11% to 5,204, and the tech-centric Nasdaq Composite advanced 1.24% to 16,248.
If bulls recover the initiative, the Dow Jones may attempt to break its previous record high of 39,889 (March 21). On the flip side, the April low of 38,559 (April 4) provides initial support before the 2024 low of 37,122 (January 18) and the weekly low of 37,073 (December 20, 2023). The loss of this region could put a test of the interim 100-day SMA at 37,752 back on the radar prior to the 200-day SMA at 36,007. The weekly low of 33,859 (November 7, 2023) comes next ahead of the October 2023 low of 32,327 (October 27), all before the 2023 bottom of 31,429 (March 15). The daily RSI rose above 47.
Top Performers: Amazon.com, Salesforce Inc, Caterpillar
Worst Performers: Intel, McDonald’s, Verizon
Resistance levels: 39,889 (4H chart)
Support levels: 38,559 38,039 37,736 (4H chart)
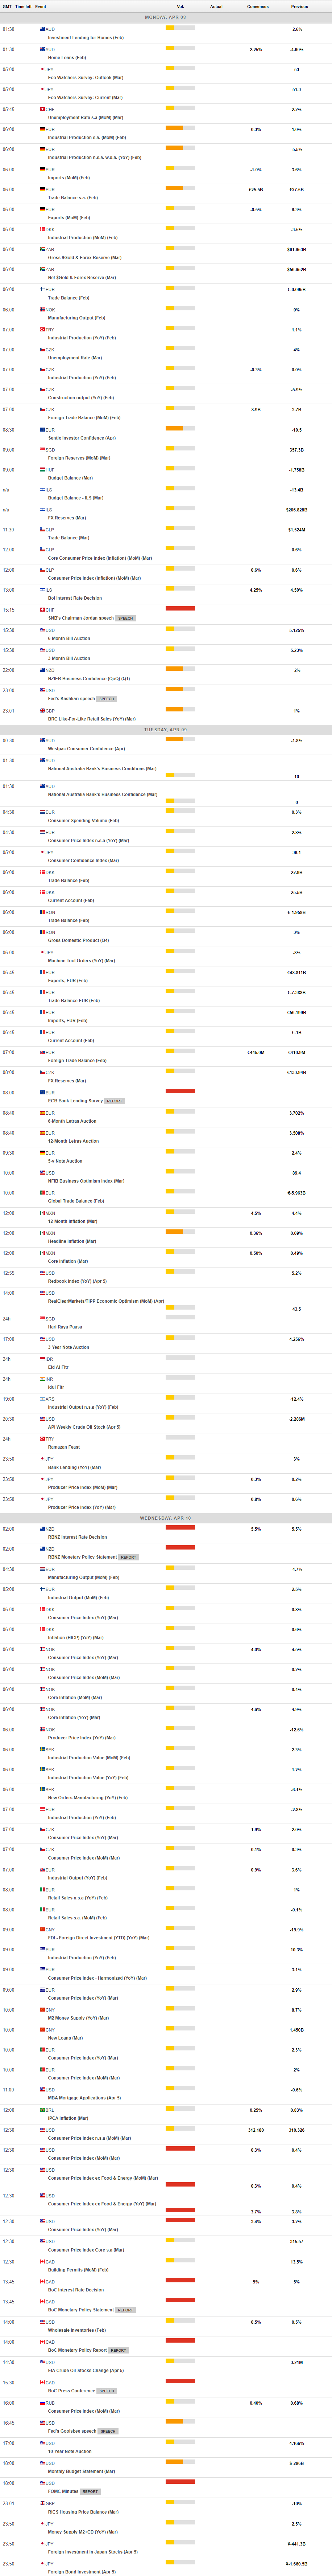
MACROECONOMIC EVENTS
All Information & Updates provided by:

All information relating to the financial markets available on this page has been prepared and issued by FXStreet (Forexstreet SL, Spain, Reg: B62498233) on the basis of publicly available information and all information believed to be reliable and does not conflict with Kuwaiti local laws, and all necessary care has been taken to before the company to ensure that the facts mentioned are correct from the source.
NCM Investment nor any of its directors or employees shall in any way be held responsible for the contents of this news, and the information contained on this page is intended only to provide clients with publicly available information and should not be construed as investment advice, report or analysis and/or constitute an offer or invitation to buy or sell financial instruments of any kind.
RISK WARNING: Forex and CFDs are highly risky leveraged products, as losses can exceed deposits. Please ensure you understand all the risks and take independent advice if necessary. NCM will segregate the clients based on the criteria of the regulator and its bylaws. NCM does not provide any advisory service; the material published does not constitute advice or a recommendation for a transaction in any financial instrument. NCM accepts no responsibility for any use of the content presented and any consequences of that use. Anyone acting on the information provided does so at their own risk.