
- Contact Us:
-

-

-

-


Daily Market Updates
10 Apr 2024
EURUSD
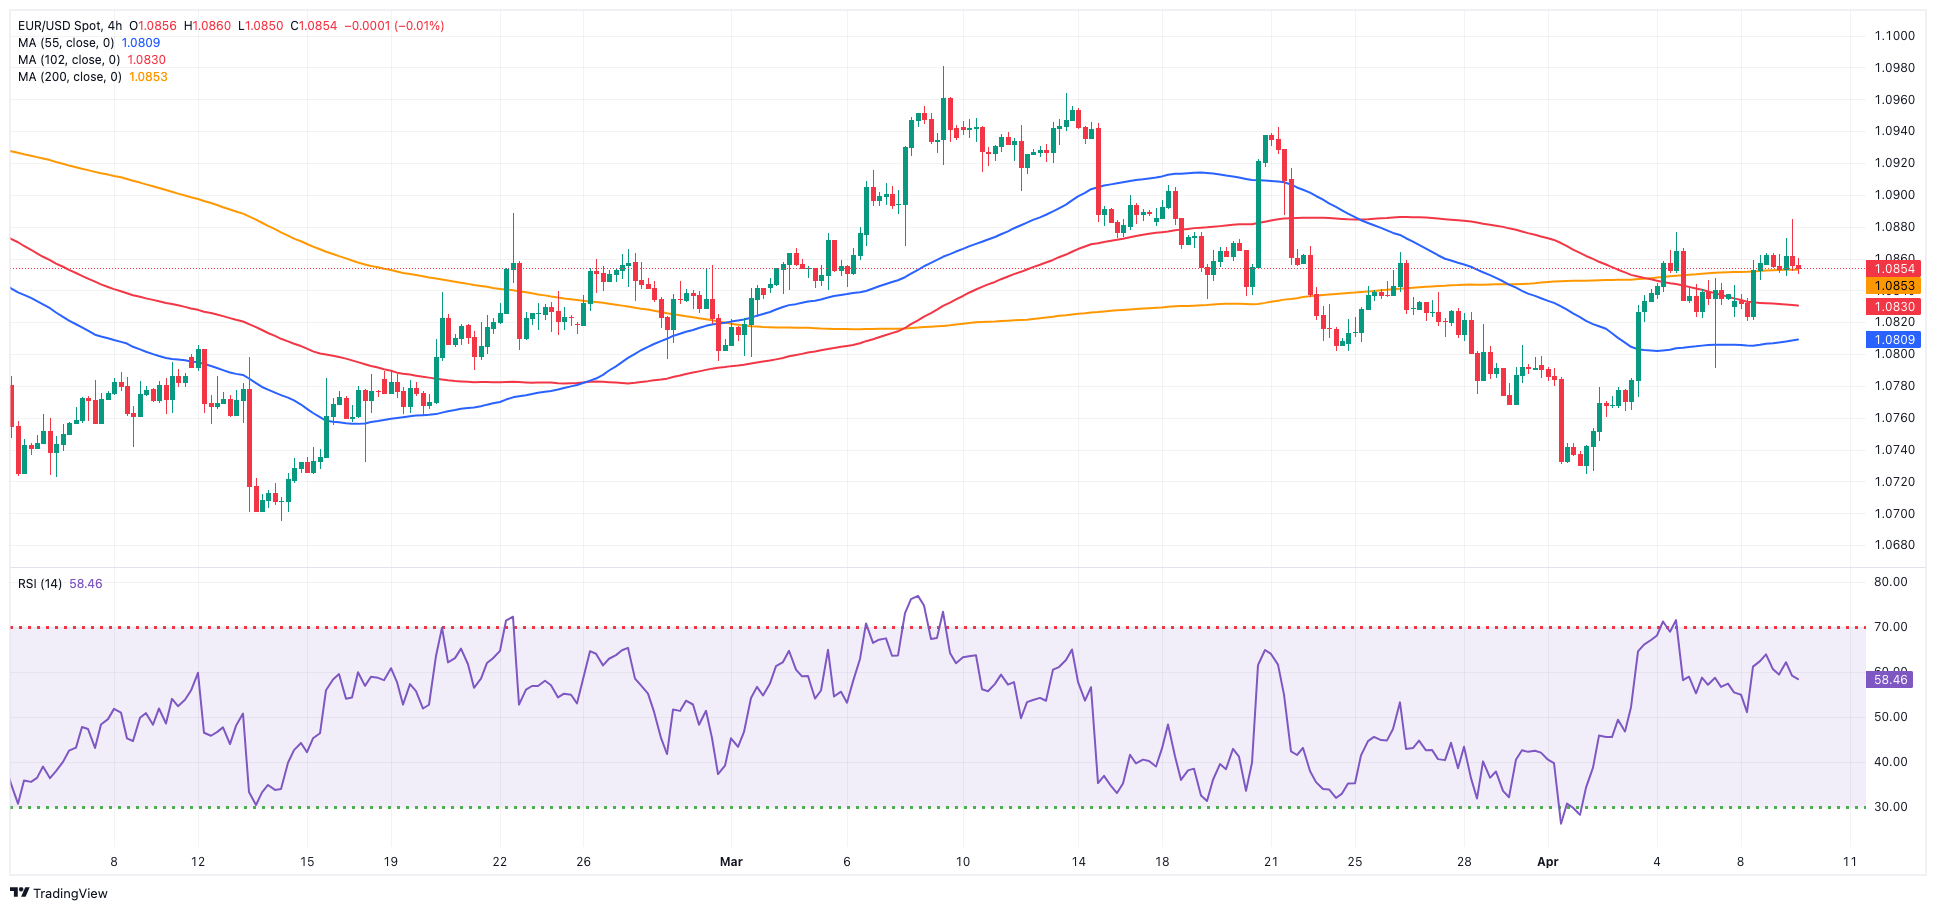
The generalized risk-friendly sentiment in the global markets prompted EUR/USD to leave behind Friday’s inconclusive price action and climb to two-day peaks near 1.0860 at the beginning of the week.
On the USD side of the equation, the USD Index (DXY) resumed its downward bias and retested the low 104.00s against the backdrop of further advances in US yields across different timeframes.
In the meantime, investors continued to assess firm prints from the US Non-farm Payrolls released on Friday, which showed a healthy job creation (+303K) and a move lower in the jobless rate (3.8%), reinforcing the case for a “soft landing” of the US economy and trimming bets on an interest rate cut by the Fed at its June event.
In the domestic calendar, Germany’s trade surplus narrowed to €21.4B in February, and Industrial Production expanded by 2.1% MoM in the same month. In the broader Euroland, the Investor Confidence measured by the Sentix index rose to -5.9 in April.
Extra gains in EUR/USD may potentially test the weekly peak of 1.0876 (April 4), followed by the March high of 1.0981 (March 8), and the weekly top of 1.0998 (January 5, 2011), which is supported by the psychological 1.1000 barrier. The breakout of this zone may put pressure on the December 2023 peak of 1.1139 (December 27), which is still supported by the 200-week SMA of 1.1142 and occurs before the 2023 high of 1.1275 (July 18). In contrast, the pair may confront the April low of 1.0724 (April 2) before falling to the 2024 low of 1.0694 (February 14). A deeper drop may show the weekly low of 1.0495 (October 13, 2023), which comes ahead of the 2023 low of 1.0448 (October 3) and the round milestone of 1.0400. The daily RSI hovered climbed past 53.
Resistance levels: 1.0876 1.0942 1.0963 (4H chart)
Support levels: 1.0791 1.0724 1.0694 (4H chart)
USDJPY
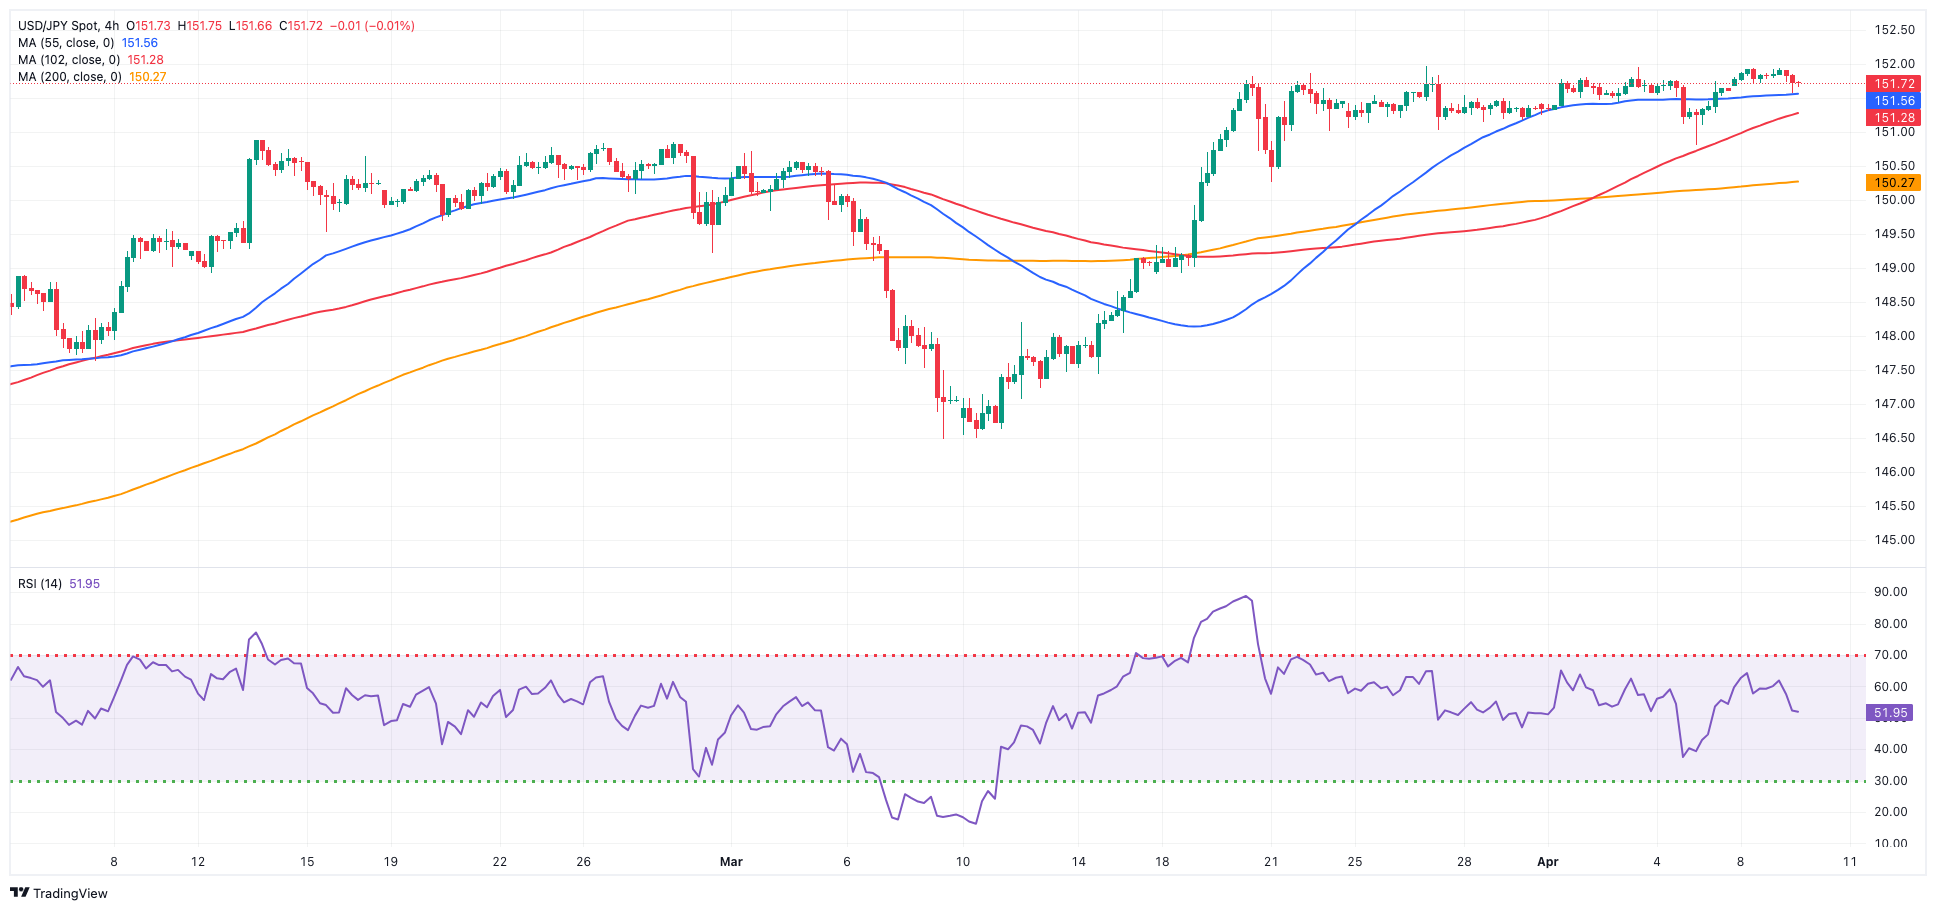
Higher US yields seem to have lent some support to USD/JPY at an auspicious start to the week, although the pair once again failed to test or surpass the key 152.00 hurdle.
In the Japanese money market, JGB 10-year yields remained close to 0.80%, up for the seventh consecutive session.
Meanwhile, investors are advised to be cautious about FX intervention as spot trading remains near 152.00. Japan's PM Kishida and Finance Minister Suzuki have emphasized on Friday the importance of addressing excessive FX volatility, while BoJ Ueda highlighted the significance of FX stability and its alignment with economic fundamentals, stating that the BoJ does not directly influence foreign exchange rates.
In Japan, the Eco Watchers Survey Current eased to 49.8 in March, and the Eco Watchers Survey Outlook receded to 51.2.
USD/JPY faces an immediate upward obstacle at the 2024 high of 151.97 (March 27), just below the round number of 152.00. On the flip side, the pair is expected to find temporary support around the 55-day and 100-day SMAs of 149.65 and 147.71, respectively, before reaching the crucial 200-day SMA of 147.09 and the March low of 146.47 (March 8). A breakdown of this zone might lead to a return to the February low of 145.89 (February 1), which comes before the December 2023 low of 140.24 (December 28), the round number 140.00, and the July low of 137.23 (July 14). The daily RSI rose above 63.
Resistance levels: 151.97 155.80 155.88 (4H chart)
Support levels: 150.80 150.26 148.91 (4H chart)
GBPUSD
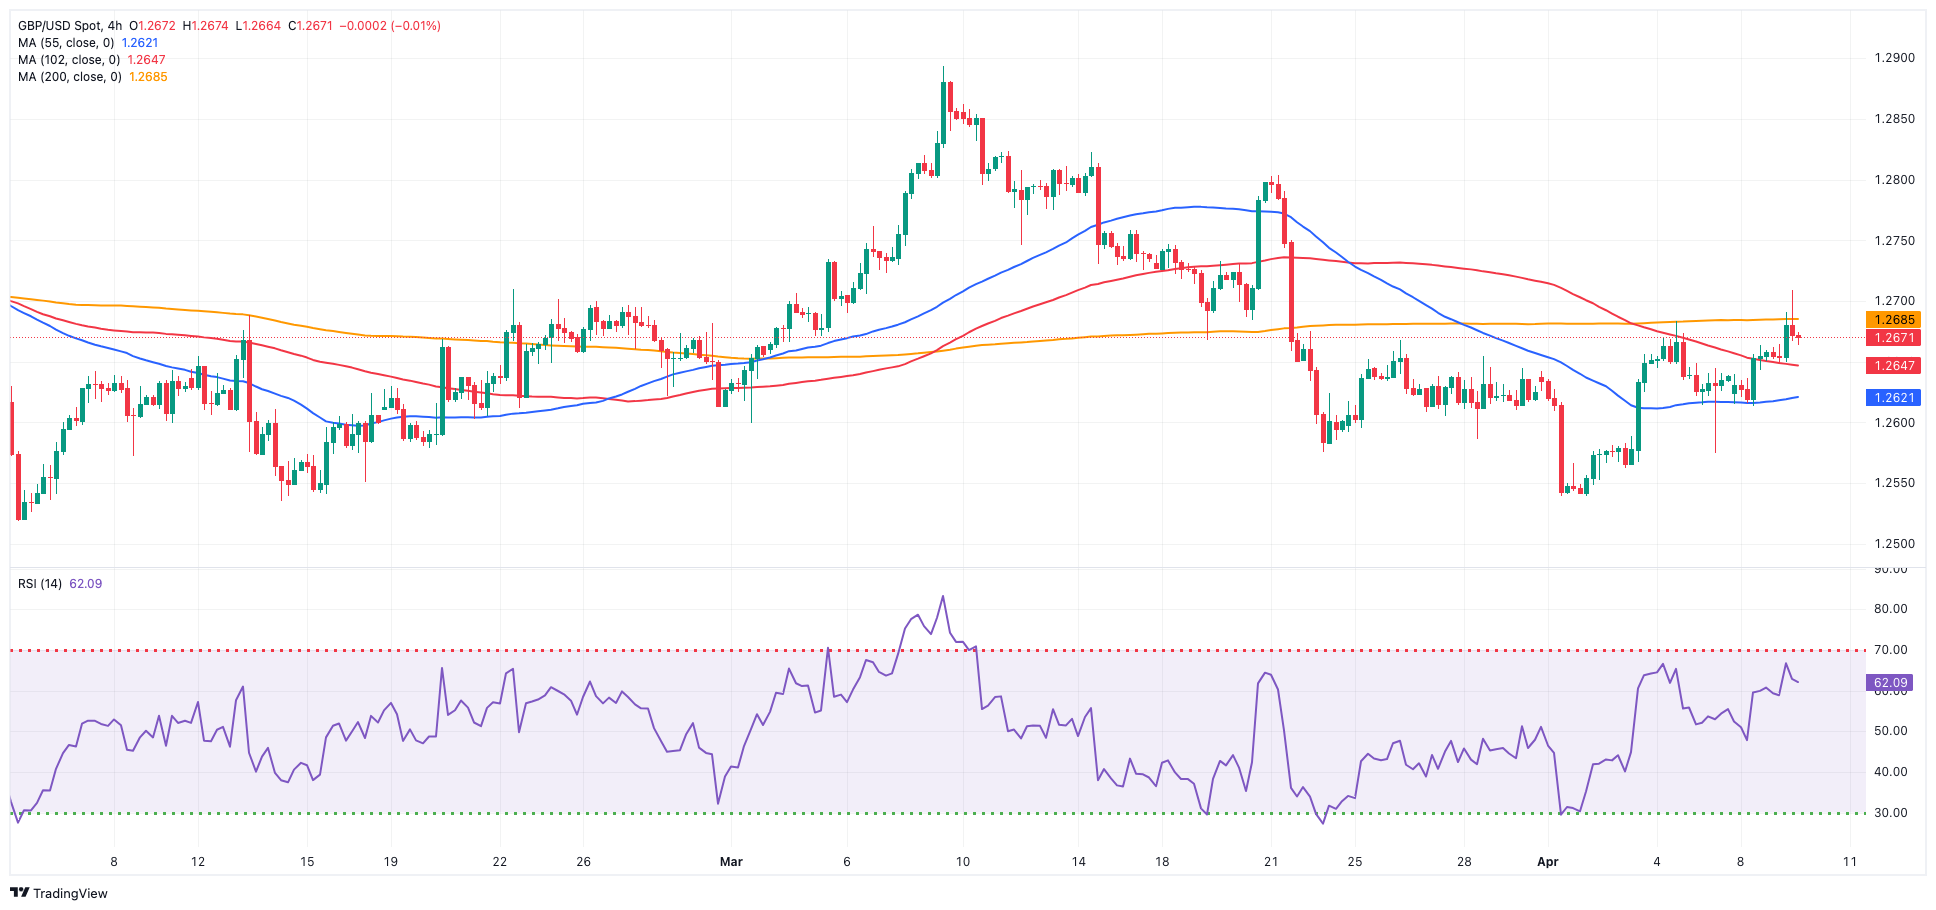
The broad-based upbeat mood in the FX universe left GBP/USD with marked gains around the 1.2660 area on Monday.
In fact, Cable’s positive price action came in response to the renewed bearish tone around the greenback and followed the persistent pessimism seen in the second half of the last week.
Meanwhile, price activity around spot was supported by further gains in UK 10-year gilts, this time surpassing the 4.1% level.
There were no data releases across the Channel at the beginning of the week.
The continuation of the comeback could see GBP/USD challenge the 2024 high of 1.2893 (March 8), seconded by the weekly top of 1.2995 (July 27, 2023) and the important 1.3000 yardstick. On the other hand, there is immediate contention at the April low of 1.2539 (April 1, 2), which comes before the 2024 low of 1.2518 (February 5) and the December 2023 low of 1.2500 (December 13). A deeper decline would not find significant support until the weekly low of 1.2187 (November 10, 2023), which comes before the October 2023 low of 1.2037 and the main 1.2000 line. On the daily chart, the RSI rose past the 50 threshold.
Resistance levels: 1.2683 1.2803 1.2823 (4H chart)
Support levels: 1.2573 1.2539 1.2518 (4H chart)
GOLD
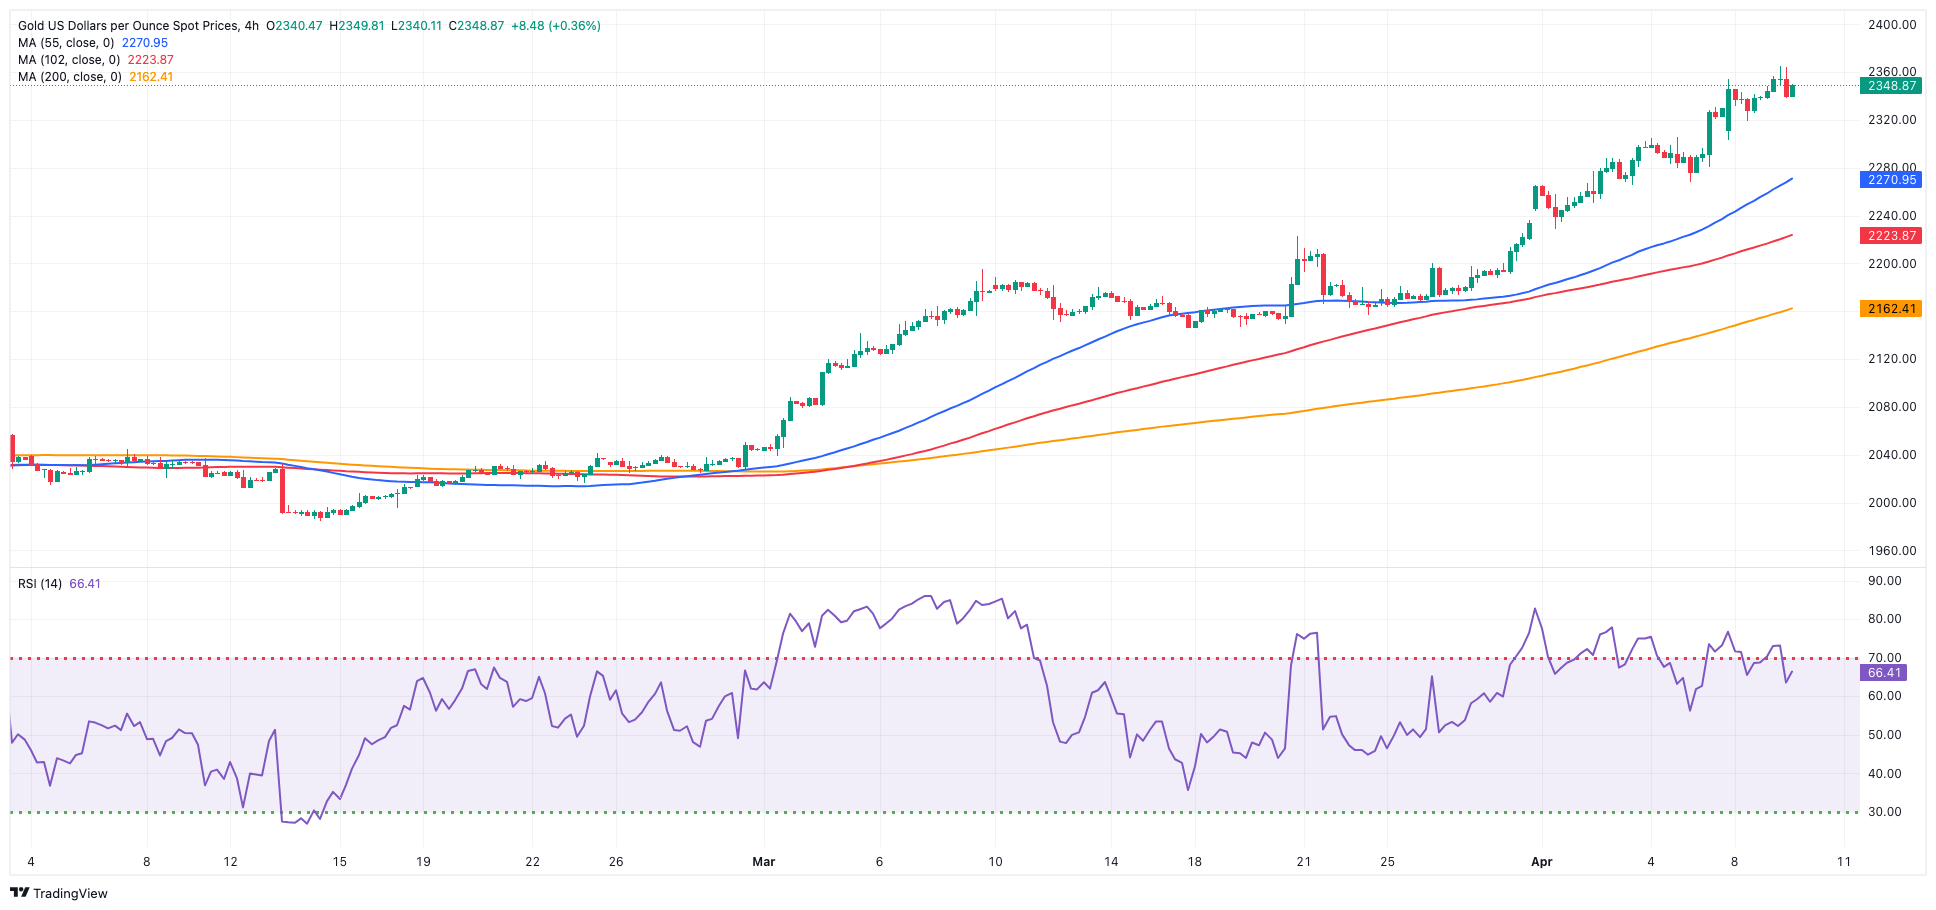
Gold prices soared to achieve a fresh record high above the $2,350 level per troy ounce, propelled by multiple factors, including speculation regarding potential interest rate cuts by the Fed, heightened speculative buying, and ongoing acquisitions by central banks.
Sustaining the upside in the yellow metal, the PBoC’s 17th consecutive gold purchase streak in March, along with the Reserve Bank of India (RBI), has boosted spot gold prices, as both central banks are buying gold to supplement their reserves.
Looking forward, focus shifts to the upcoming publication of US inflation data gauged by the CPI, set for later this week, which could provide indications regarding the possible timing of the Fed's first rate cut.
Gold faces immediate resistance above its all-time high of $2,330 (April 5). On the downside, the weekly low of $2,146 (March 18) takes first place, followed by the preliminary 55-day and 100-day SMAs of $2,100 and $2,066, respectively. Further south, the 2024 low of $1,984 (February 14) appears to be supported by its proximity to the 200-day moving average ($1,997). Once the latter is resolved, a visit to the December 2023 low of $1,973 may appear on the horizon before the November 2023 low of $1,931. The failure in this region may cause the metal to test its October 2023 bottom of $1,810, followed by the 2023 low of $1,804 and the critical $1,800 conflict zone.
Resistance levels: $2,354 (4H chart)
Support levels: $2,267 $2,228 $2,157 (4H chart)
CRUDE WTI
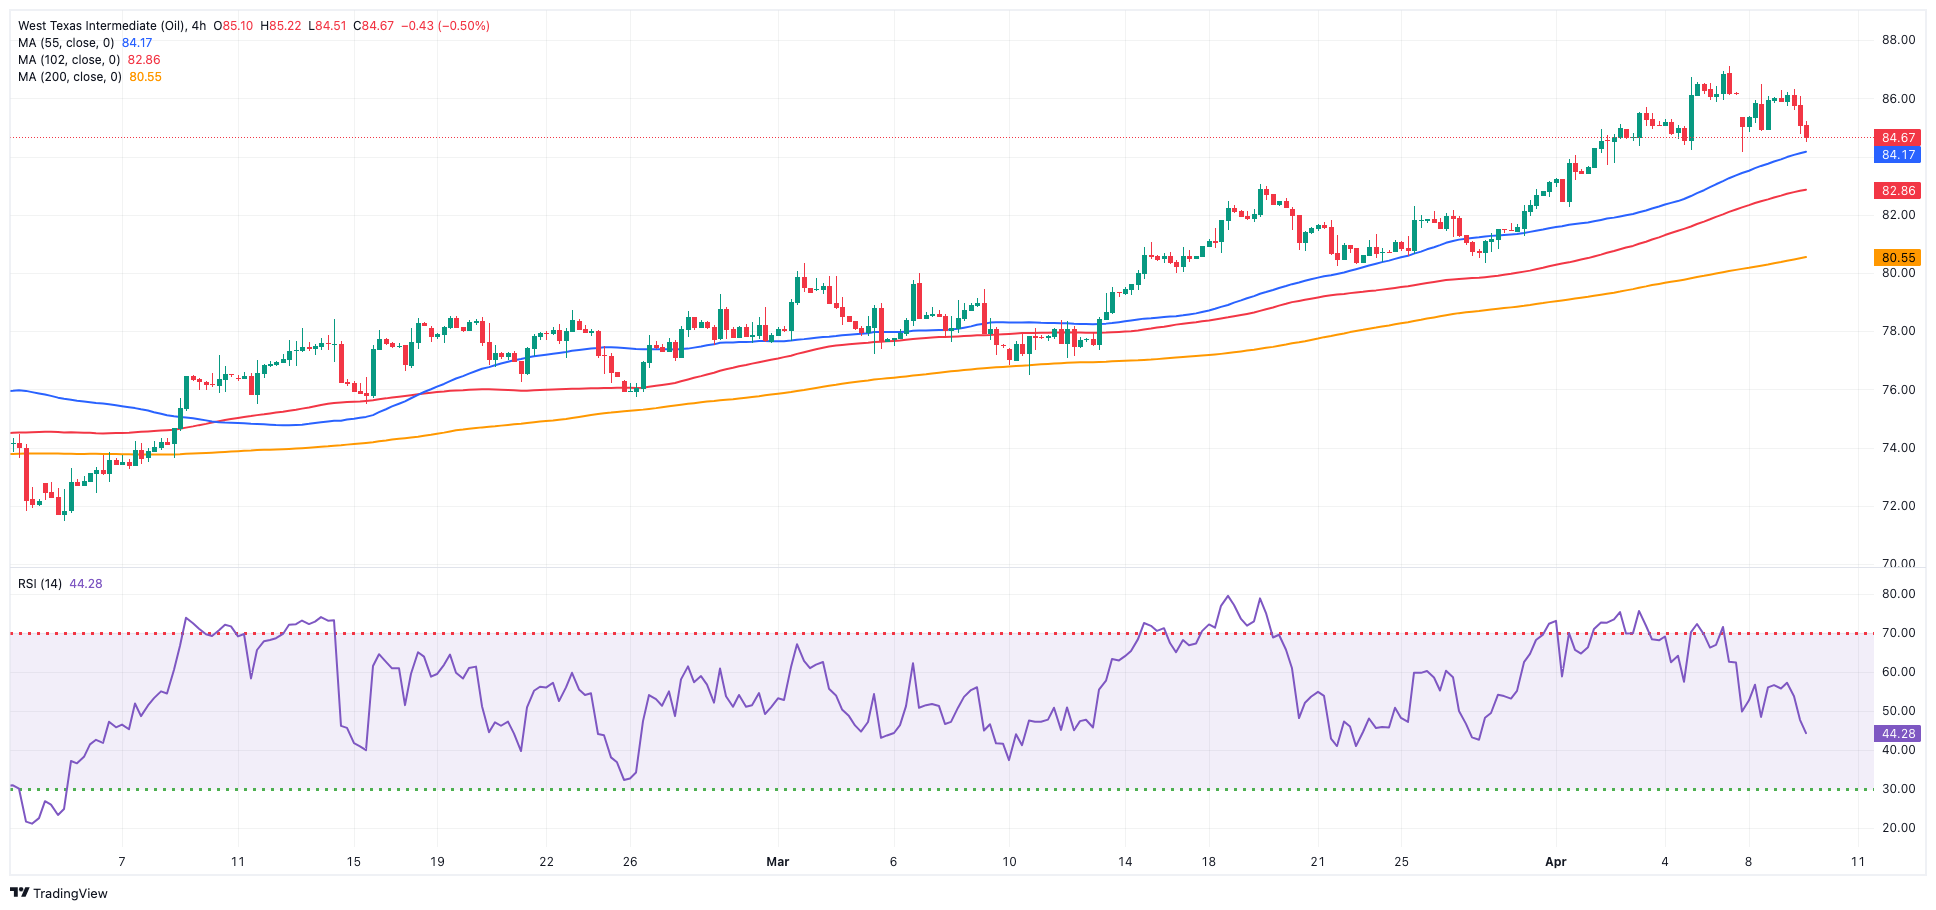
Prices of WTI added to Friday’s losses and briefly visited the area below the $85.00 mark per barrel on Monday.
The corrective decline in the commodity came on the back of diminishing geopolitical concerns in the Middle East, as ceasefire talks between Israel and Hamas continued to look for common ground on Monday.
On the other hand, OPEC+'s recent decision to uphold their existing production cuts signalled a restricted outlook for crude oil in the near term and contributed to the recent increase in prices.
Later in the week, the API and the EIA will report on weekly US crude oil inventories on Tuesday and Wednesday, respectively.
The next upward challenge for WTI is the 2024 peak of $87.59 (April 5), which precedes the weekly high of $89.83 (October 18, 2023) and the 2023 top of $94.99 (September 28, 2023). Further north, the weekly peak of $97.65 (August 30) falls just shy of the psychological $100.00 threshold. Just the opposite, the weekly low of $80.33 (March 21) emerges as the immediate down-barrier seconded by the 200-day SMA at $79.25, and the February low of $71.43 (February 5). The breach of this region could put a probable test of the critical $70.00 barrier back on the radar before the 2024 low of $69.31 (January 3), and the December 2023 low of $67.74 (December 13).
Resistance levels: $87.59 $89.82 $94.99 (4H chart)
Support levels: $84.66 $82.58 $80.51 (4H chart)
GER40
European stocks started the week in a positive fashion, printing decent gains across the continent amidst auspicious data from Germany and rising prudence ahead of the ECB event and the release of US CPI later in the week.
Also adding to the upbeat tone, investor confidence in the broader euro area tracked by the Sentix index improved further in April.
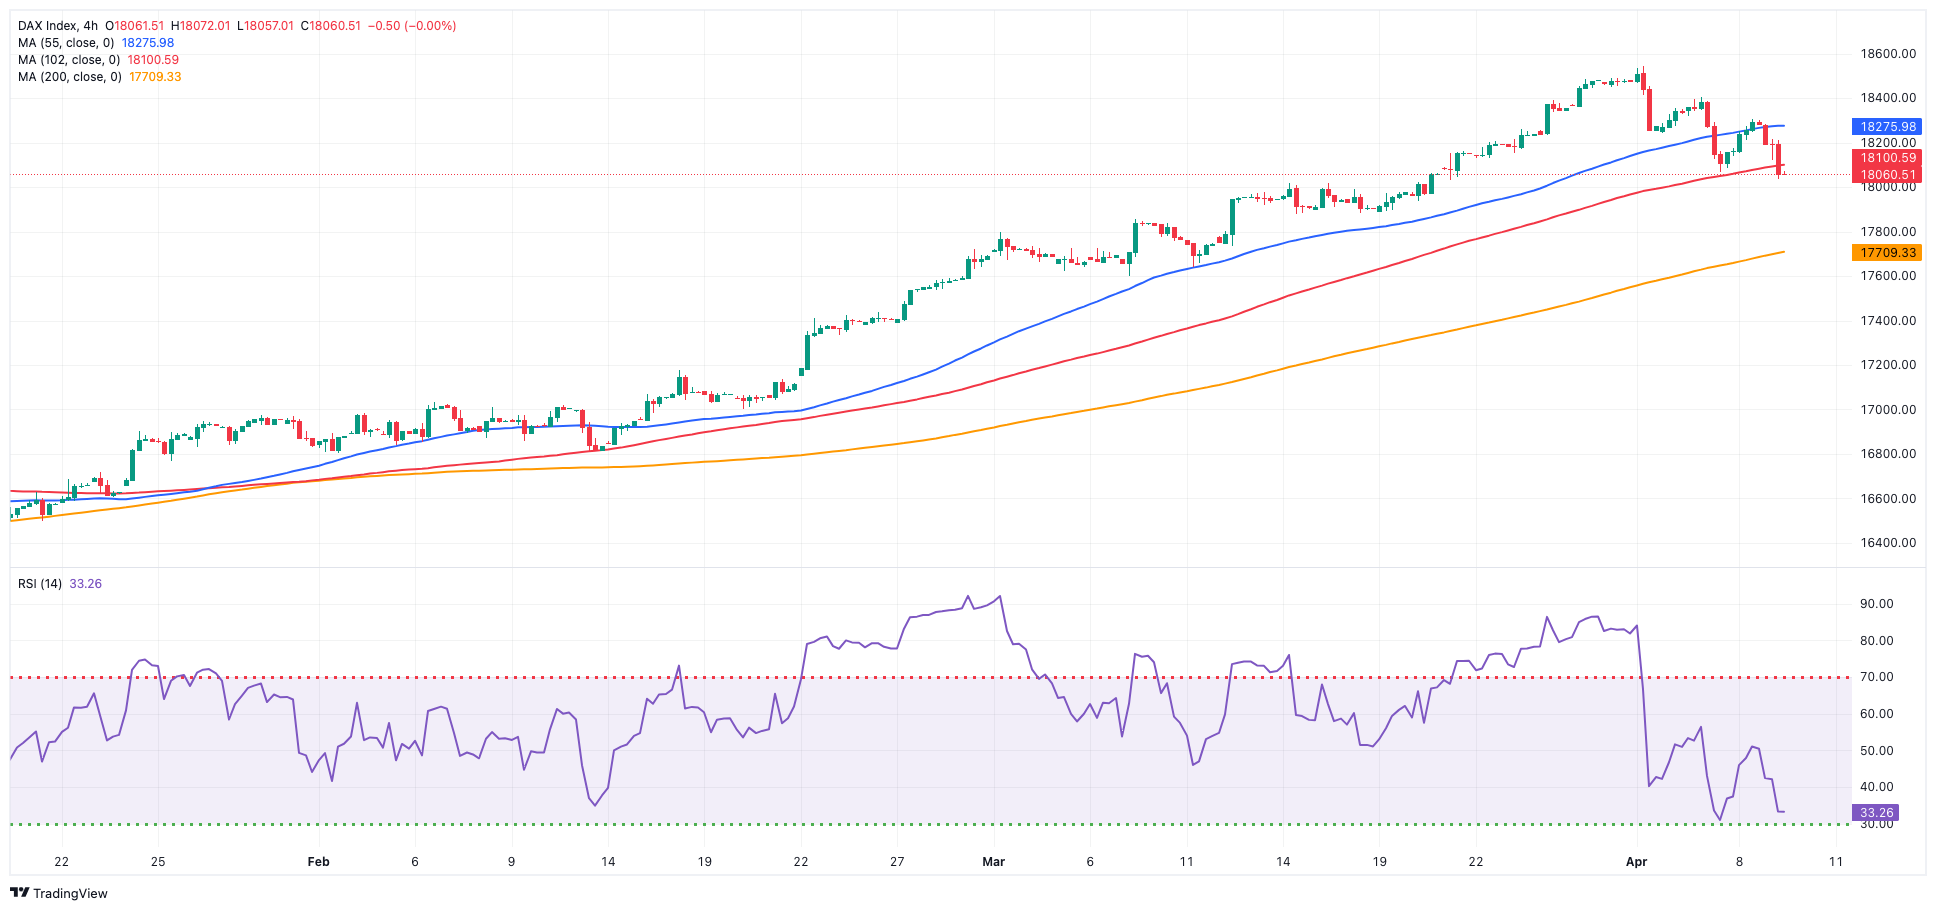
Against that backdrop, Germany’s benchmark DAX40 left behind Friday’s marked retracement and advanced strongly to the 18,300 zone on Monday.
Concerning the ECB, there is widespread anticipation among investors that the bank will keep interest rates unchanged at its upcoming policy meeting, with a projected 25 bps rate cut still expected for June.
Daily gains in the index came in tandem with the move to multi-session tops in German 10-year bund yields, which surged to the 2.45% zone.
The DAX40's next level of resistance is the record high of 18,567 (April 2). Conversely, the 55-day SMA of 17,506 should serve as temporary support until the February low of 16,821 (February 1). A decline below this level might bring the index to its 2024 low of 16,345 (January 17), ahead of the critical 200-day SMA of 16,324. After dropping below the latter, the weekly low of 15,915 (November 28) may be tested, followed by the October low of 14,630 (October 23) and the 2023 low of 14,458 (March 20). The daily RSI climbed past the 63 yardstick.
Best Performers: Zalando SE, Rheinmetall AG, Mercedes Benz Group
Worst Performers: MTU Aero, Brenntag AG, Hannover Rueck SE
Resistance levels: 18,567 (4H chart)
Support levels: 18,088 17,902 17,619 (4H chart)
GBPJPY
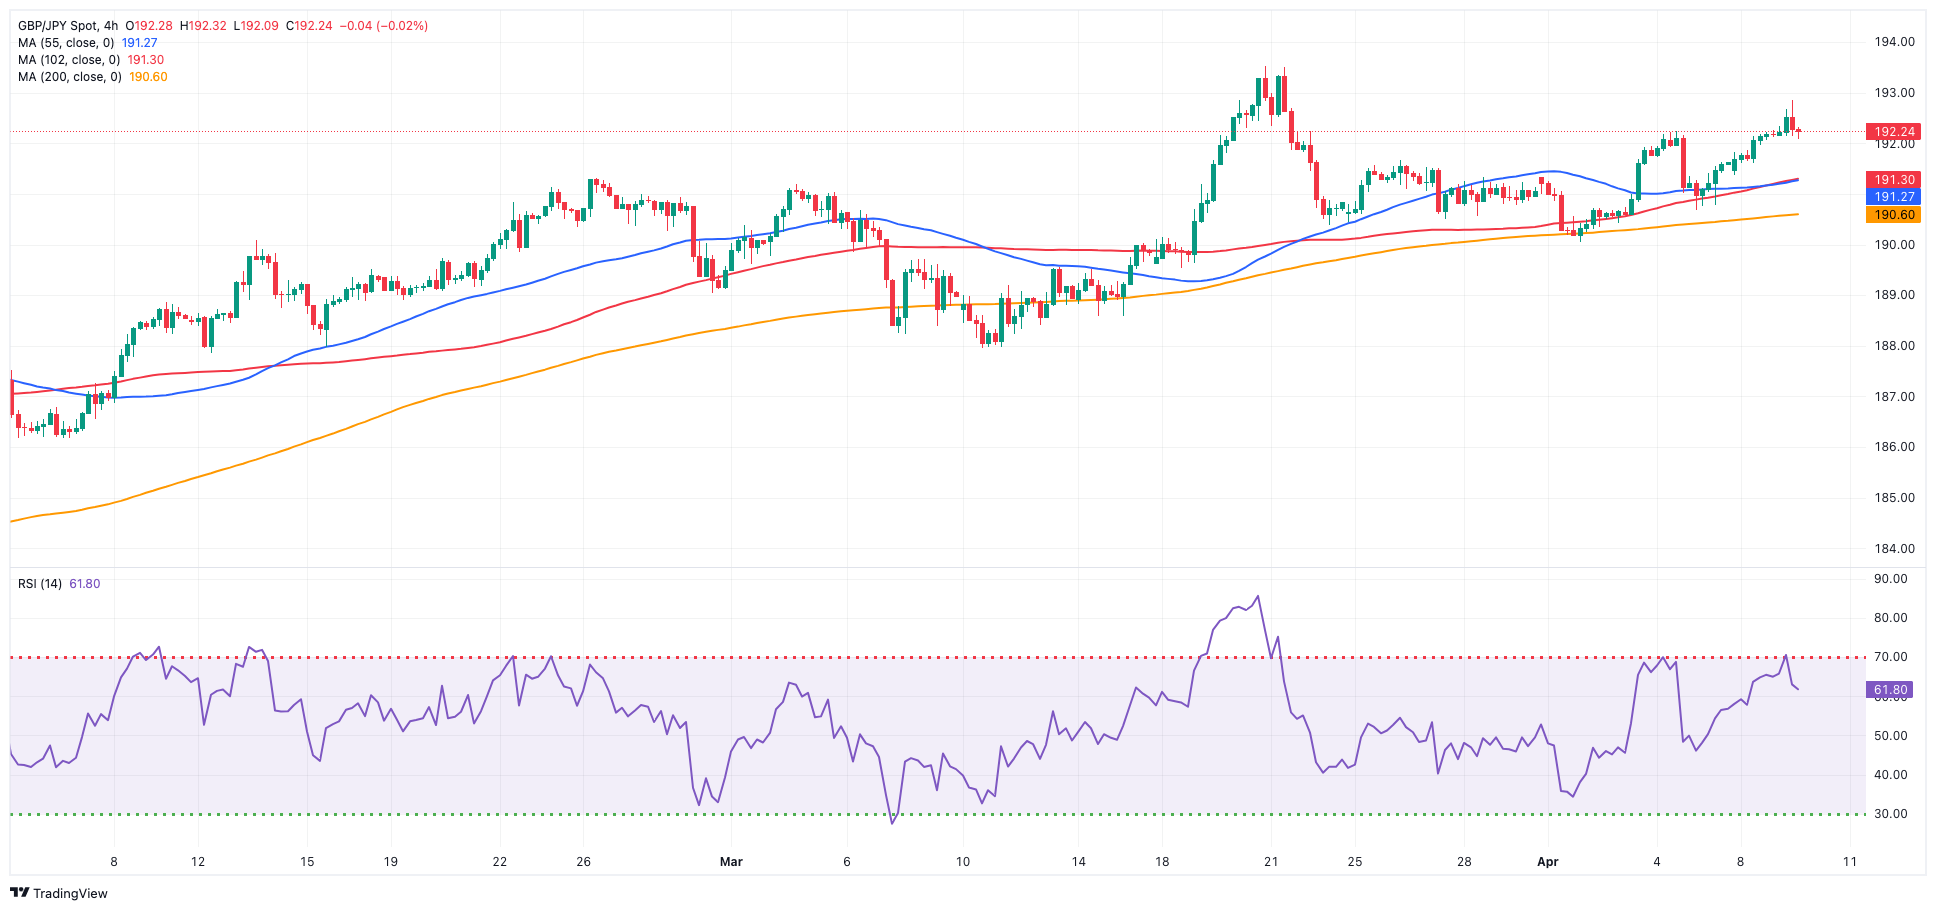
GB/JPY managed to add to Friday’s advance and surpassed the key 192.00 barrier against the backdrop of the resurgence of the selling bias in the greenback at the beginning of the week.
In addition, further depreciation of the Japanese yen and the firm price action surrounding the British pound prompted decent gains in the cross, which flirted with the so-far April tops beyond 192.00.
Currently, downside swings in the cross appear to be limited to the 190.00 level, with yearly highs in the mid-193.00s acting as a barrier to any upward rise.
If bulls push stronger, GBP/JPY could encounter an immediate upward block at the April peak of 192.25 (April 4), which is ahead of the 2024 high of 193.53 (March 20). Further up are the August 2015 top of 195.28 (August 18) and the record peak of 195.88 (June 24, 2015). In the opposite direction, the 55-day SMA at 189.62 reinforces the April bottom of 190.04. The loss of the latter exposes a probable drop to the March low of 187.96 (March 11) prior to the intermediate 100-day SMA at 187.18 and the February low of 185.22 (February 1), which is ahead of the crucial 200-day SMA of 185.15. A deeper slide might put the December 2023 low of 178.33 (December 14) back into view before the October 2023 bottom of 178.08 (October 3). The day-to-day RSI climbed above 59.
Resistance levels: 192.25 193.53 195.28 (4H chart)
Support levels: 190.67 190.04 189.54 (4H chart)
NASDAQ
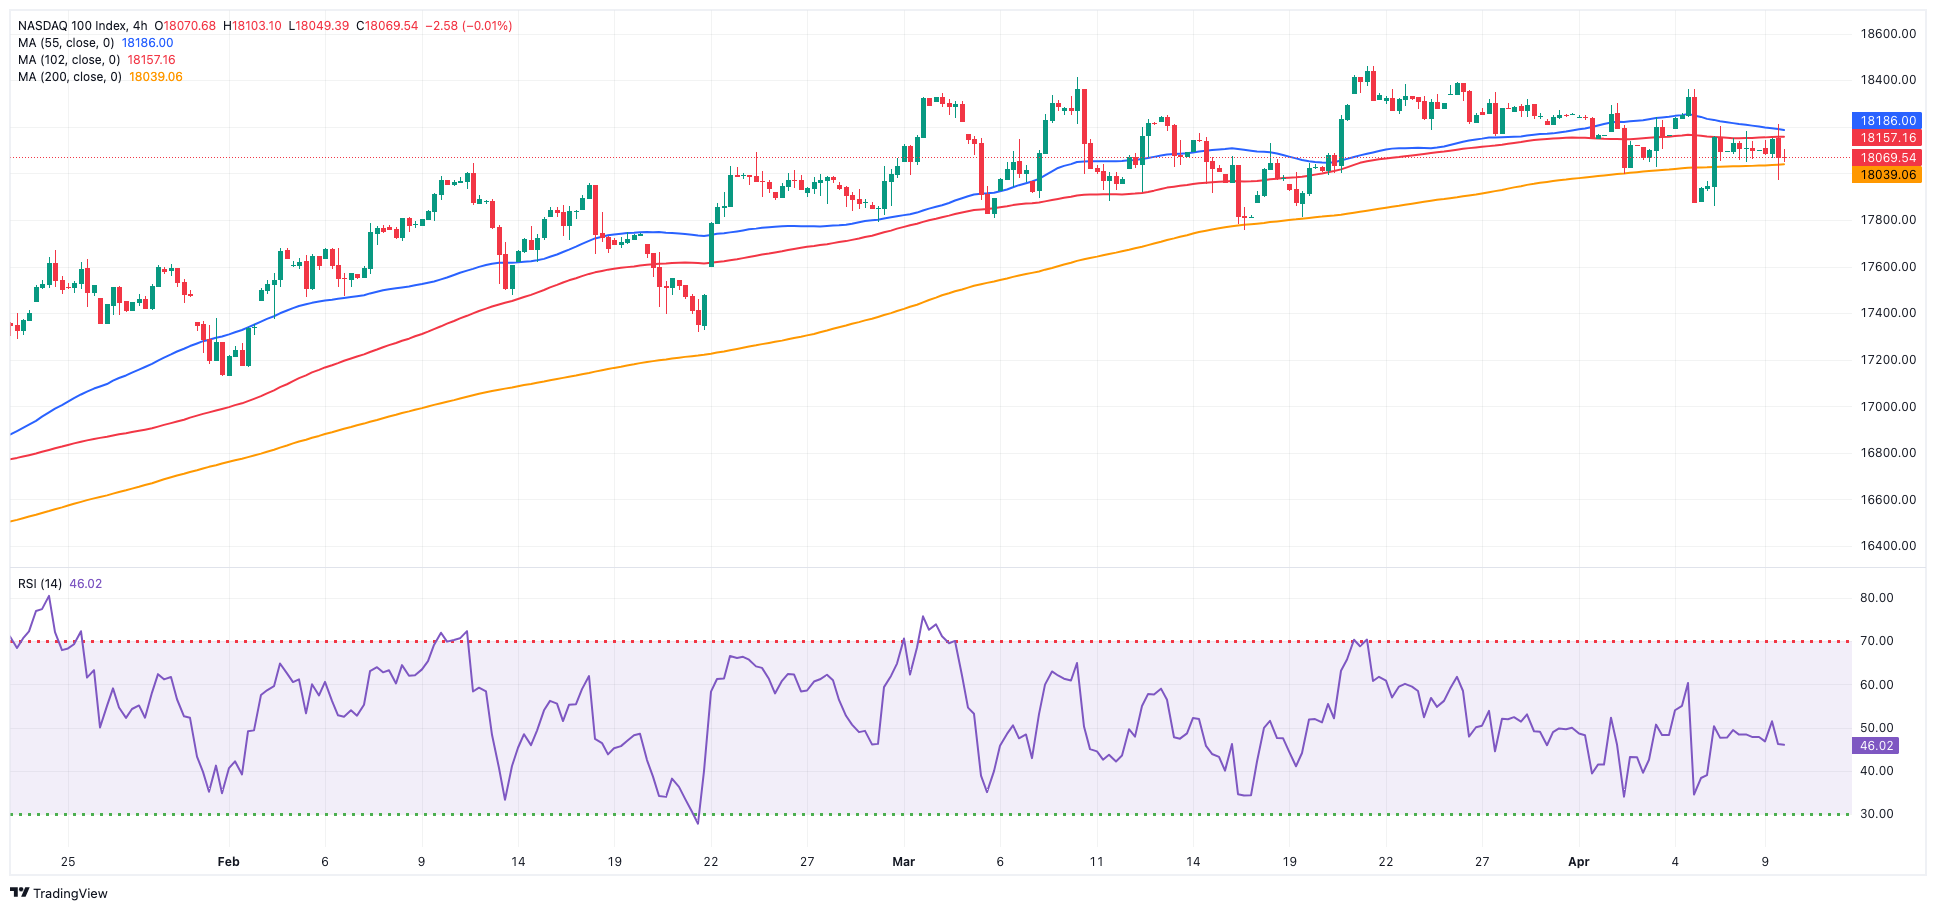
The US tech sector began the week with marginal gains near the 18,200 zone when tracked by the Nasdaq 100, all against the backdrop of the generalized flattish mood in the global markets.
Meanwhile, market participants rapidly digested Friday’s Payrolls figures and shifted their attention to the upcoming US CPI prints, as well as the FOMC Minutes and further messages from the Fed's rate setters.
The slight advance in the tech benchmark came amidst an equally small move higher in US yields across the curve, while the solid performance of EV maker Tesla contributed to the uptick.
Further gains might lift the Nasdaq 100 past its all-time high of 18,464 (March 21). Having said that, the index is expected to find immediate support at its April low of 17,875, before falling to weekly lows of 17,319 (February 21) and 17,128 (January 31). If the latter is broken, a challenge to the 2024 low of 16,249 (January 5) may emerge, ahead of the crucial 200-day SMA of 16,142 and the December 2023 low of 15,695 (December 4). Additional losses from here may return to the October 2023 level of 14,058 (October 26), which precedes the April 2023 low of 12,724 (April 25) and the March 2023 low of 11,695 (March 13). The daily RSI held steady near 52.
Top Gainers: Tesla, Warner Bros Discovery, Take-Two
Top Losers: Fortinet, Sirius XM, Intel
Resistance levels: 18,464 (4H chart)
Support levels: 17,875 17,764 17,319 (4H chart)
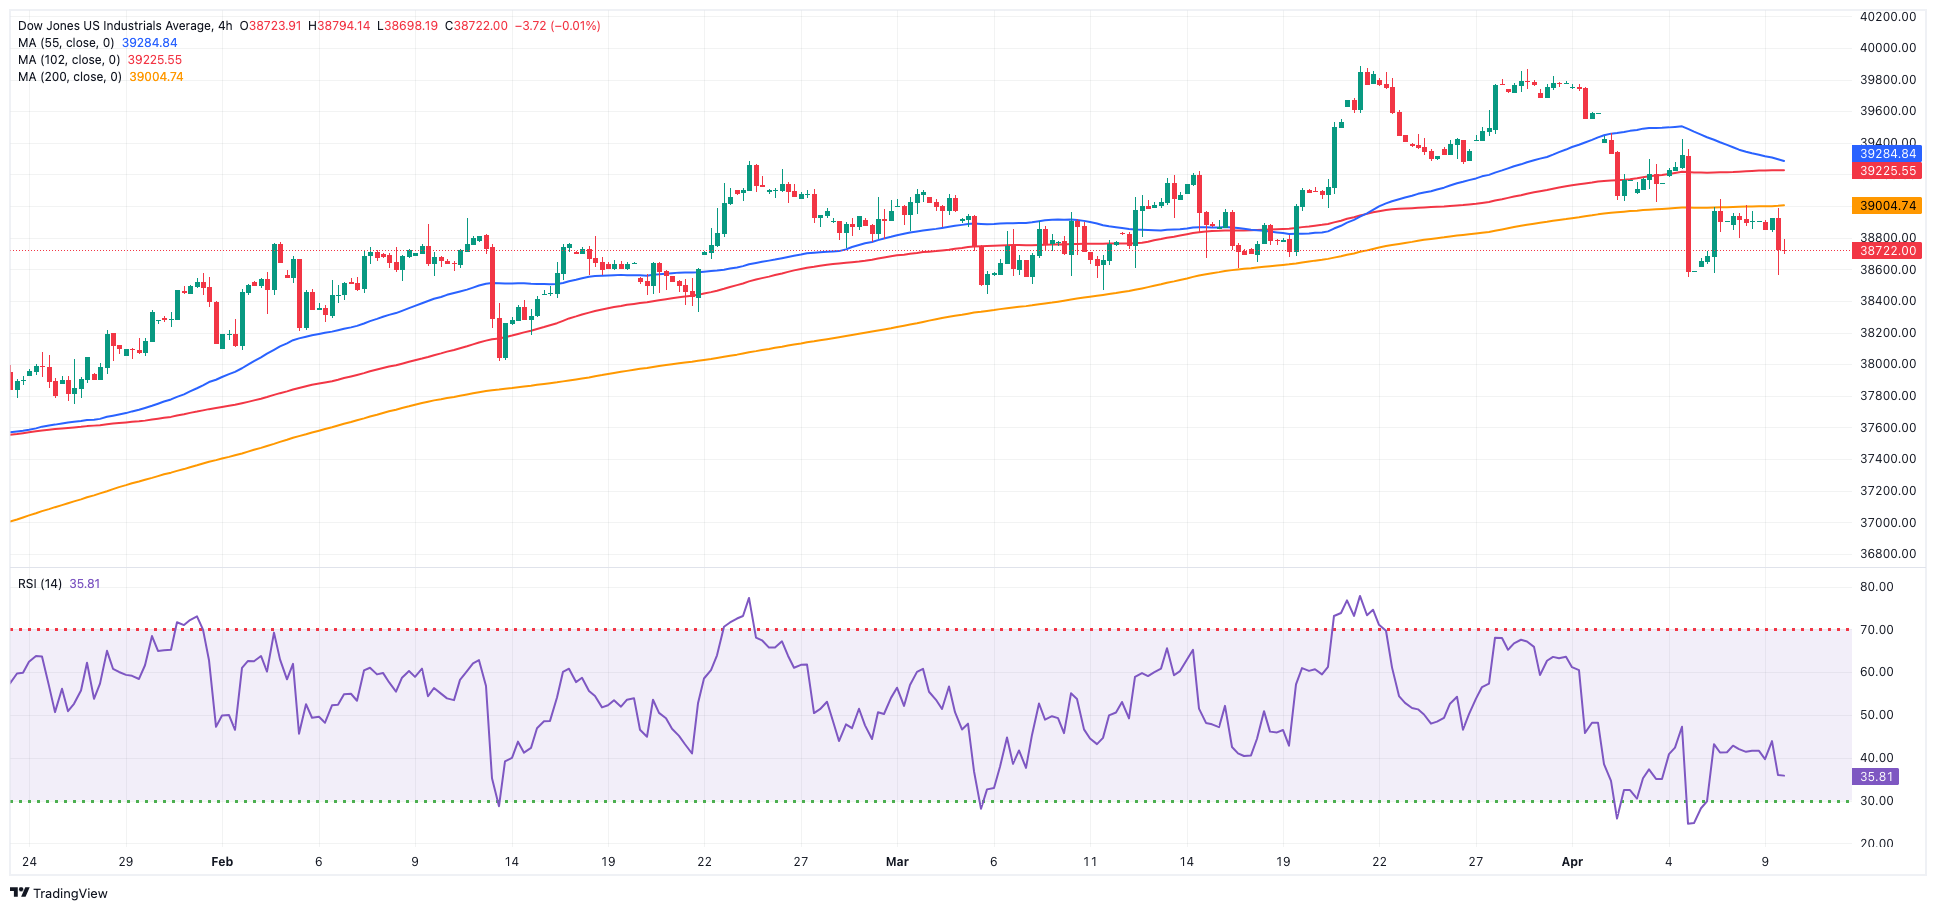
DOW JONES
US equities kicked off the week on a choppy note, with the reference Dow Jones hovering around the 39,000 region amidst modest gains in its peers, the S&P500 and the Nasdaq Composite.
In the meantime, investors’ cautiousness kicked in ahead of the release of US inflation figures gauged by the CPI, the FOMC Minutes, scheduled Fed speak, and the start of the earnings season, all due later in the week.
It's important to highlight that Fed officials Logan and Bowman warned last Friday against premature speculation regarding potential interest rate cuts.
At the beginning of the week, the Dow Jones advanced 0.05% to 38,925, the S&P 500 gained 0.10% to 5,209, and the tech-heavy Nasdaq Composite rose 0.11% to 16,265.
If bulls regain the initiative, the Dow Jones could try to dispute its previous record high of 39,889 (March 21). On the flip side, the April low of 38,559 (April 4) offers initial support before the 2024 low of 37,122 (January 18) and the weekly low of 37,073 (December 20, 2023). The breakdown of this region could bring the intermediate 100-day SMA at 37,799 back into focus before the 200-day SMA at 36,032. The weekly low of 33,859 (November 7, 2023) comes next, followed by the October 2023 low of 32,327 (October 27), all before the 2023 bottom of 31,429 (March 15). The daily RSI looked stable above 47.
Top Performers: Nike, Home Depot, 3M
Worst Performers: Intel, Merck&Co, Walt Disney
Resistance levels: 39,421 39,889 (4H chart)
Support levels: 38,559 38,039 37,736 (4H chart)
MACROECONOMIC EVENTS

All Information & Updates provided by:

All information relating to the financial markets available on this page has been prepared and issued by FXStreet (Forexstreet SL, Spain, Reg: B62498233) on the basis of publicly available information and all information believed to be reliable and does not conflict with Kuwaiti local laws, and all necessary care has been taken to before the company to ensure that the facts mentioned are correct from the source.
NCM Investment nor any of its directors or employees shall in any way be held responsible for the contents of this news, and the information contained on this page is intended only to provide clients with publicly available information and should not be construed as investment advice, report or analysis and/or constitute an offer or invitation to buy or sell financial instruments of any kind.
RISK WARNING: Forex and CFDs are highly risky leveraged products, as losses can exceed deposits. Please ensure you understand all the risks and take independent advice if necessary. NCM will segregate the clients based on the criteria of the regulator and its bylaws. NCM does not provide any advisory service; the material published does not constitute advice or a recommendation for a transaction in any financial instrument. NCM accepts no responsibility for any use of the content presented and any consequences of that use. Anyone acting on the information provided does so at their own risk.