
- Contact Us:
-

-

-

-


Daily Market Updates
11 Apr 2024
EURUSD
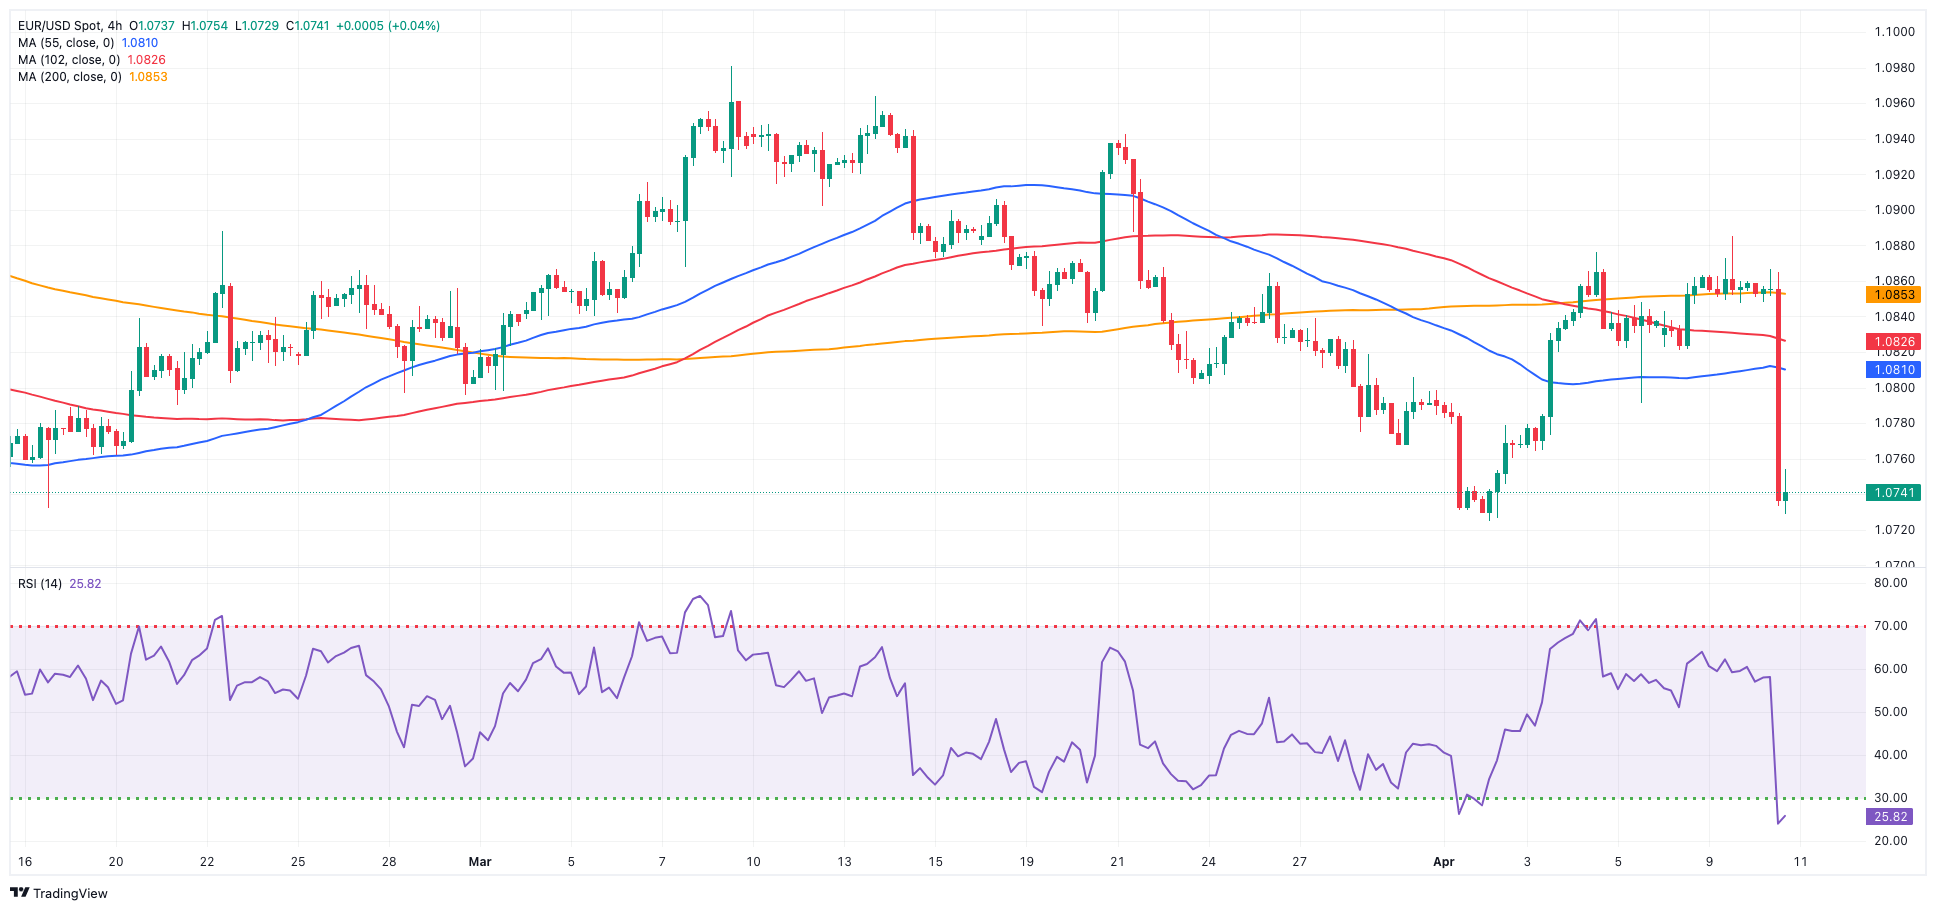
The sudden and strong CPI-led rebound in the greenback sparked a sharp knee-jerk in EUR/USD, dragging it to multi-day lows in the vicinity of the 1.0730 region on Wednesday. This steep retracement also breached the key 200-day SMA, opening the door to extra losses in the short-term horizon.
In the meantime, the USD Index (DXY) rose markedly to new yearly peaks north of the 105.00 barrier pari passu with multi-month tops in US yields across the curve and shrinking bets on an interest rate cut by the Fed in June.
On the latter, the probability of such a move at the June 12 event shrank to around 20% when tracked by CME Group’s FedWatch Tool.
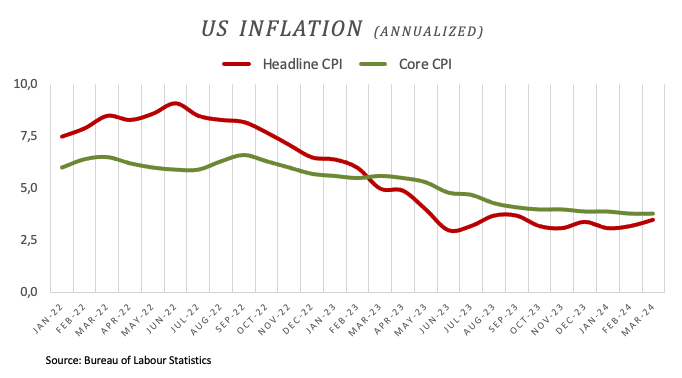
The robust bounce in the dollar came in response to higher-than-expected US inflation figures gauged by the CPI for the month of March. In fact, consumer prices rose by 3.5% from a year earlier and 3.8% over the last twelve months when it came to the Core CPI.
From the FOMC Minutes, participants in a meeting expressed uncertainty about the persistence of elevated inflation and the lack of confidence in it trending sustainably towards the 2% target. The Fed is considering whether the greater risk lies in overly restrictive monetary policy or premature easing and failure to achieve the 2% inflation target.
Additional US data saw Mortgage Applications rise by 0.1% in the week to April 5 and Wholesale Inventories expand by 0.5% MoM during February.
Extra losses in EUR/USD might test the April low of 1.0724 (April 2) before the 2024 low of 1.0694 (February 14). A deeper drop may expose the weekly low of 1.0495 (October 13, 2023), which comes ahead of the 2023 bottom of 1.0448 (October 3) and the round milestone of 1.0400. In contrast, immediate resistance aligns at the weekly peak of 1.0885 (April 9), prior to the March high of 1.0981 (March 8), and the weekly top of 1.0998 (January 5, 2011), all closely followed by the psychological 1.1000 barrier. The breakout of this zone may put pressure on the December 2023 peak of 1.1139 (December 27), which is still supported by the 200-week SMA of 1.1142 and occurs before the 2023 high of 1.1275 (July 18). The daily RSI collapsed to around 39.
Resistance levels: 1.0885 1.0942 1.0963 (4H chart)
Support levels: 1.0728 1.0724 1.0694 (4H chart)
USDJPY
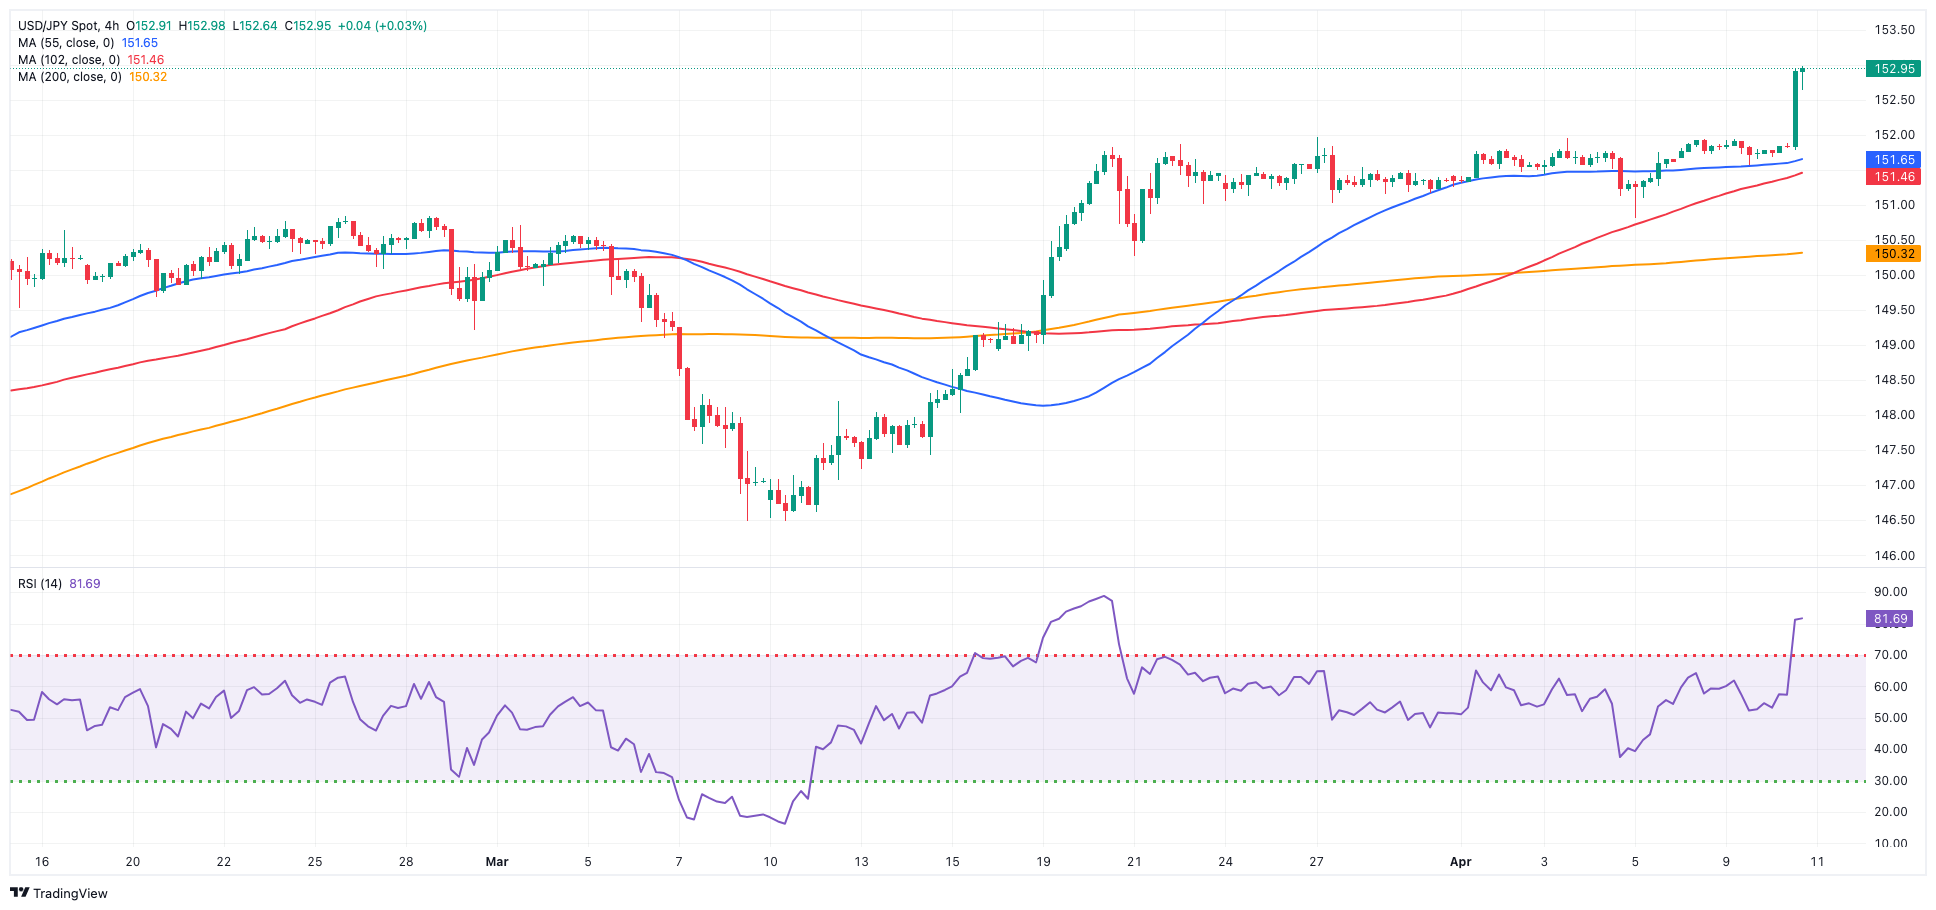
The sharp rebound in the greenback and US yields propelled USD/JPY to the vicinity of the 153.00 hurdle for the first time since June 1990 on Wednesday.
Indeed, spot gathered rapid upside traction soon after US inflation figures surprised to the upside in March, eventually lending extra wings to the buck and kicking back expectations for a June rate cut by the Fed for later in the year.
Along with the rise in US yields, JGB 10-year yields advanced to multi-month peaks near 0.85%.
On the BoJ front, Governor Ueda presented his semi-annual report to parliament. He outlined the factors behind the BoJ's departure from its ultra-loose policy in March and reiterated the importance of maintaining accommodating monetary conditions as core inflation remains below 2%. Ueda also stressed that the bank would not alter its monetary policy solely to address fluctuations in FX rates but warned that adjustments might be necessary if such movements not only raise import prices but also pose a risk of elevating core inflation beyond expectations.
In Japan, Bank Lending expanded by 3.2% in the year to March, and Producer Prices rose by 0.2% MoM in March and by 0.8% vs. the same month in 2023.
USD/JPY faces an imminent upward barrier at the round number of 153.00 ahead of the June 1990 top of 155.80. On the flip side, the pair is expected to find temporary support at the 55-day and 100-day SMAs of 149.81 and 147.79, respectively, before reaching the crucial 200-day SMA of 147.17 and the March low of 146.47 (March 8). A breakdown of this zone might lead to a return to the February low of 145.89 (February 1), which comes before the December 2023 low of 140.24 (December 28), the round number 140.00, and the July low of 137.23 (July 14). The daily RSI entered the overbought zone beyond 71.
Resistance levels: 152.98 155.80 155.88 (4H chart)
Support levels: 151.56 150.80 150.26 (4H chart)
GBPUSD
The renewed and strong buying pressure in the greenback kept the risk complex under heightened pressure and sponsored a deep pullback in the British pound on Wednesday.
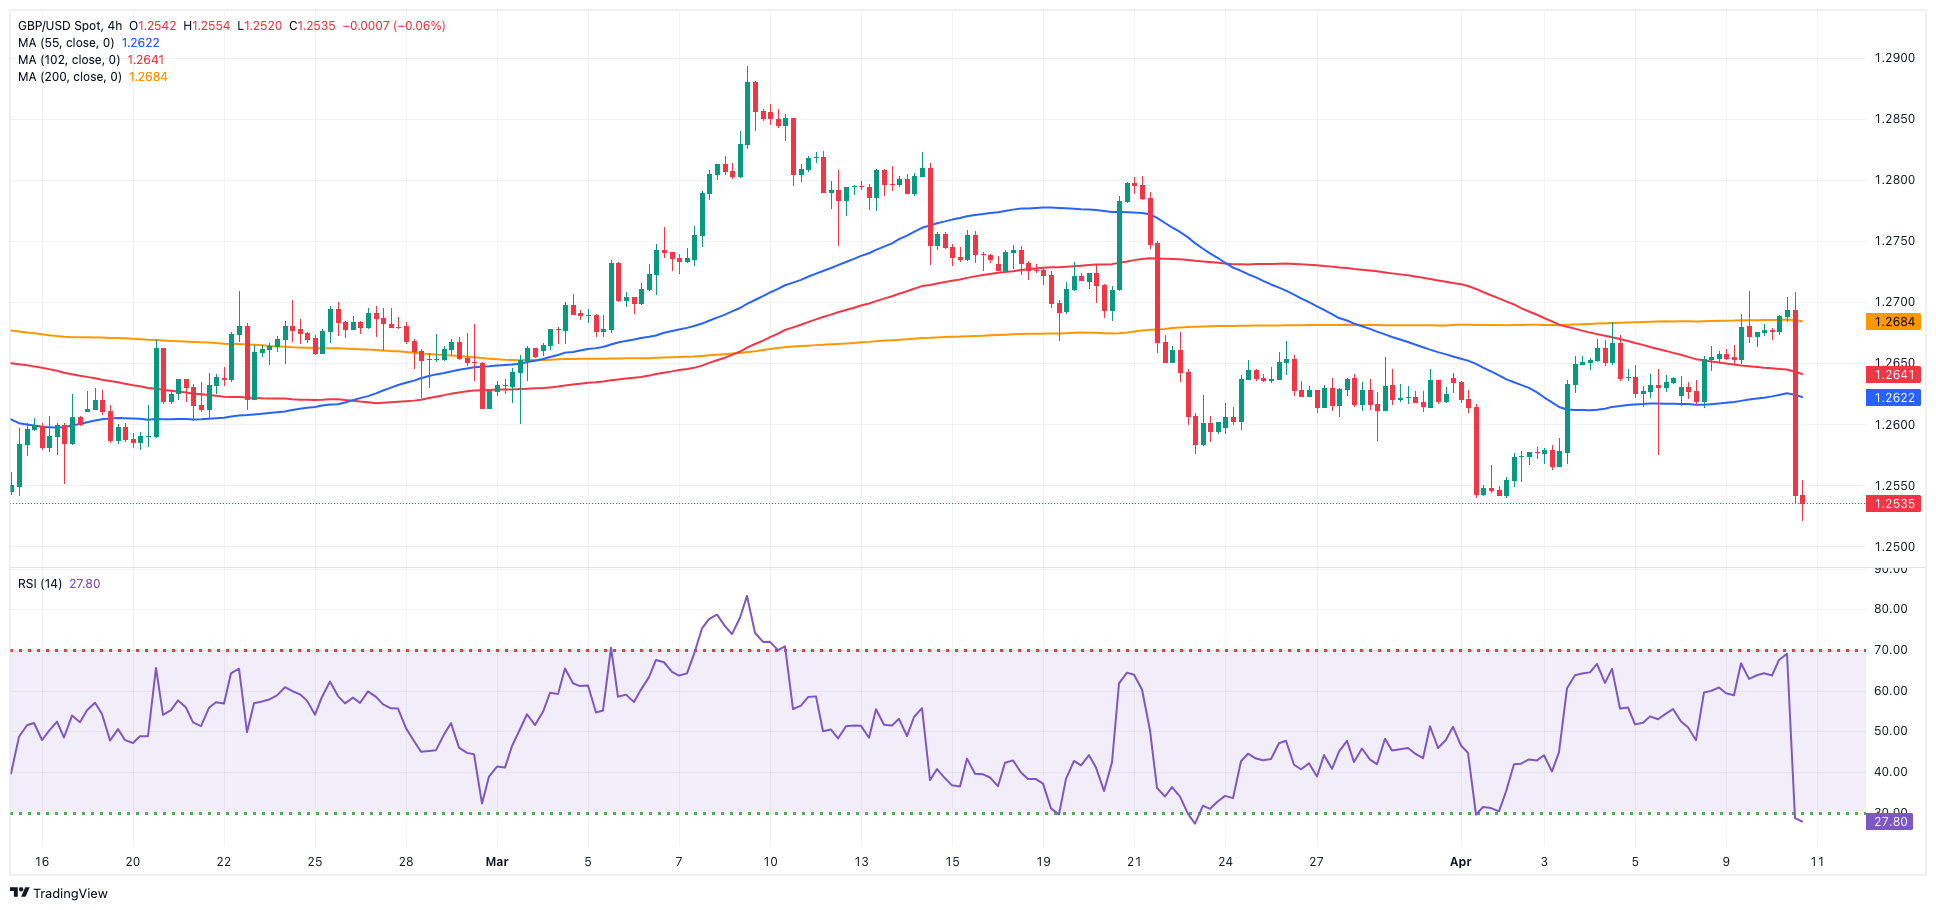
That said, GBP/USD tumbled to multi-session lows and revisited the low-1.2500s after two daily advances in a row, trading just pips away from the area of monthly lows and breaking below the critical 200-day SMA.
In the bond market, the firm rebound in UK 10-year gilt yields to the proximity of 4.15% accompanied the deep decline in Cable.
Next of note for the sterling will be the release of GDP readings on Friday along with other results from key fundamentals.
A deeper drop could see GBP/USD retest the April low of 1.2539 (April 1, 2), which precedes the 2024 bottom of 1.2518 (February 5) and the December 2023 low of 1.2500 (December 13). A deeper decline would not find significant support until the weekly low of 1.2187 (November 10, 2023), which comes before the October 2023 low of 1.2037 and the main 1.2000 line. On the other hand, initial up-barrier is at the April top of 1.2709 (April 9) seconded by the weekly peak of 1.2803 (March 21) and the 2024 high of 1.2893 (March 8). Further north comes the weekly top of 1.2995 (July 27, 2023), ahead of the important 1.3000 level. On the daily chart, the RSI plummeted below 40.
Resistance levels: 1.2709 1.2803 1.2823 (4H chart)
Support levels: 1.2520 1.2500 1.2448 (4H chart)
GOLD
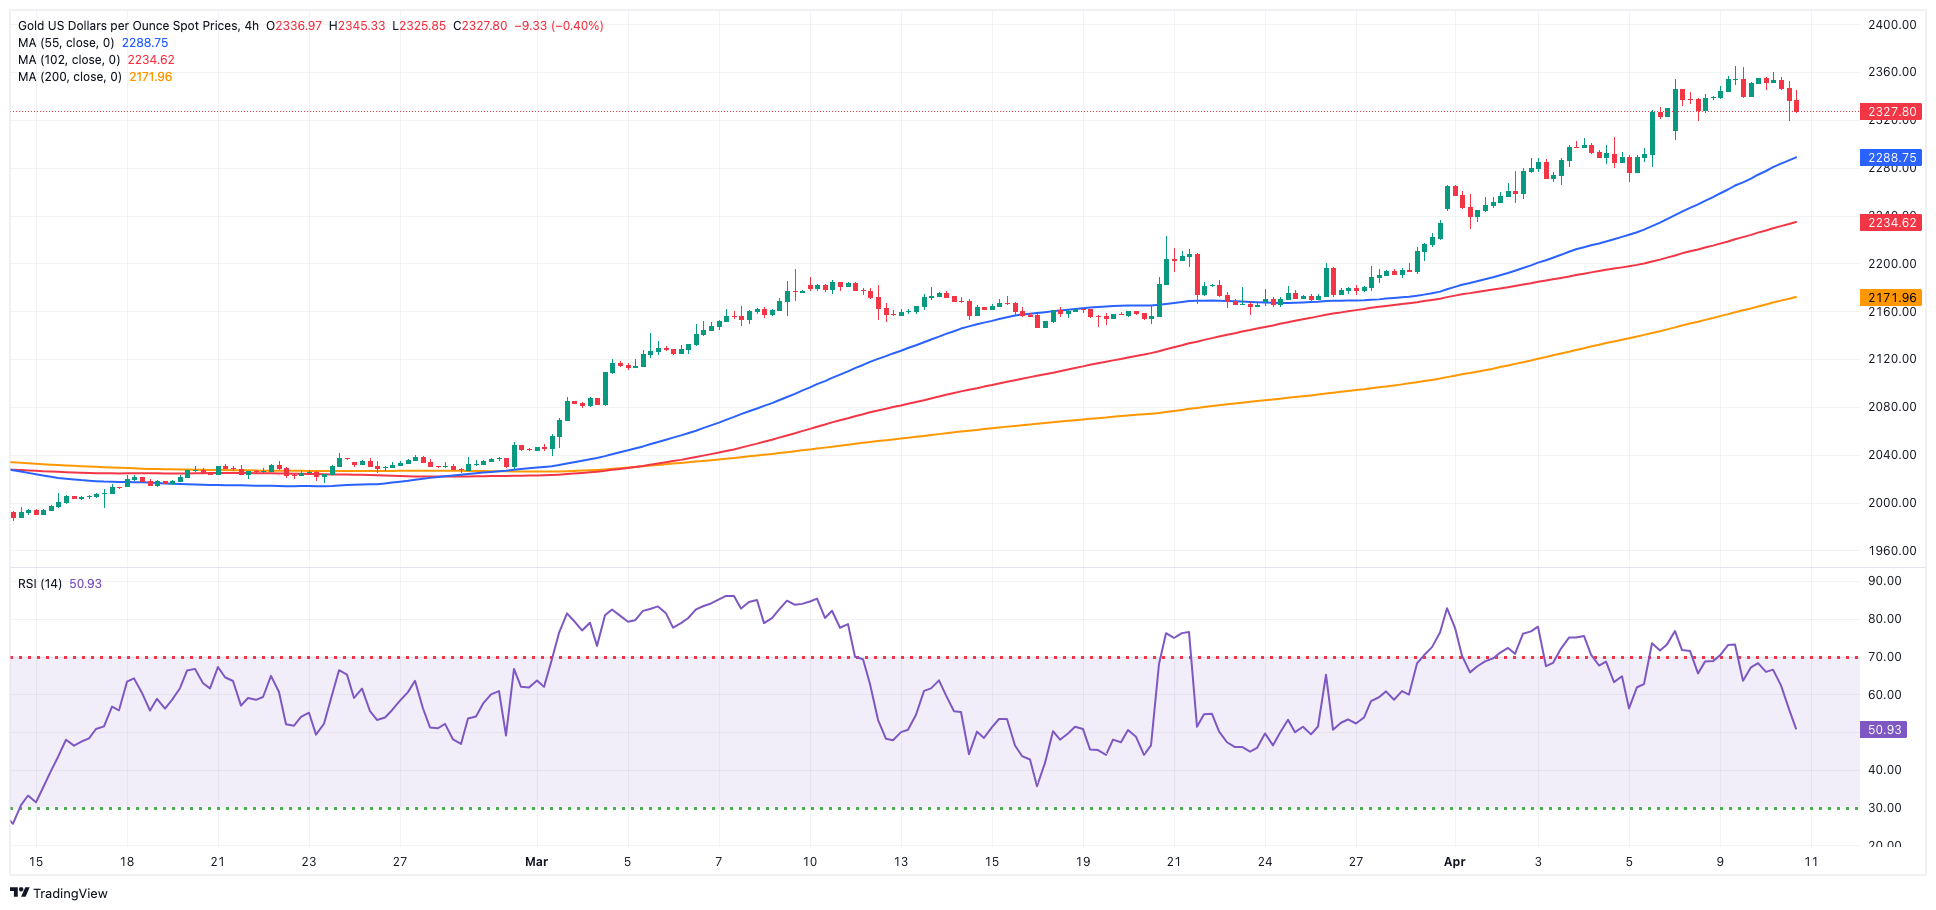
Gold prices fell from record highs on Wednesday as the greenback and US yields strengthened following a stronger-than-expected inflation report that dampened prospects of a potential interest rate cut by the Fed in the summer.
Against that backdrop, the USD Index (DXY) rose to a new yearly high north of the 105.00 barrier, while US yields climbed to multi-week tops in tandem with diminishing bets of a rate cut at the Fed’s June 12 event.
Gold faces immediate resistance at its all-time top of $2,365 (April 9). On the downside, the weekly low of $2,146 (March 18) is first, followed by the preliminary 55-day and 100-day SMAs of $2,117 and $2,077, respectively, all ahead of the more important 200-day SMA of $2,003. Further south, the 2024 low of $1,984 (February 14) is followed by the December 2023 low of $1,973, and the November 2023 low of $1,931. The failure in this region may cause the metal to test its October 2023 low of $1,810, followed by the 2023 low of $1,804 and the crucial $1,800 conflict zone.
Resistance levels: $2,365 (4H chart)
Support levels: $2,319 $2,267 $2,228 (4H chart)
CRUDE WTI
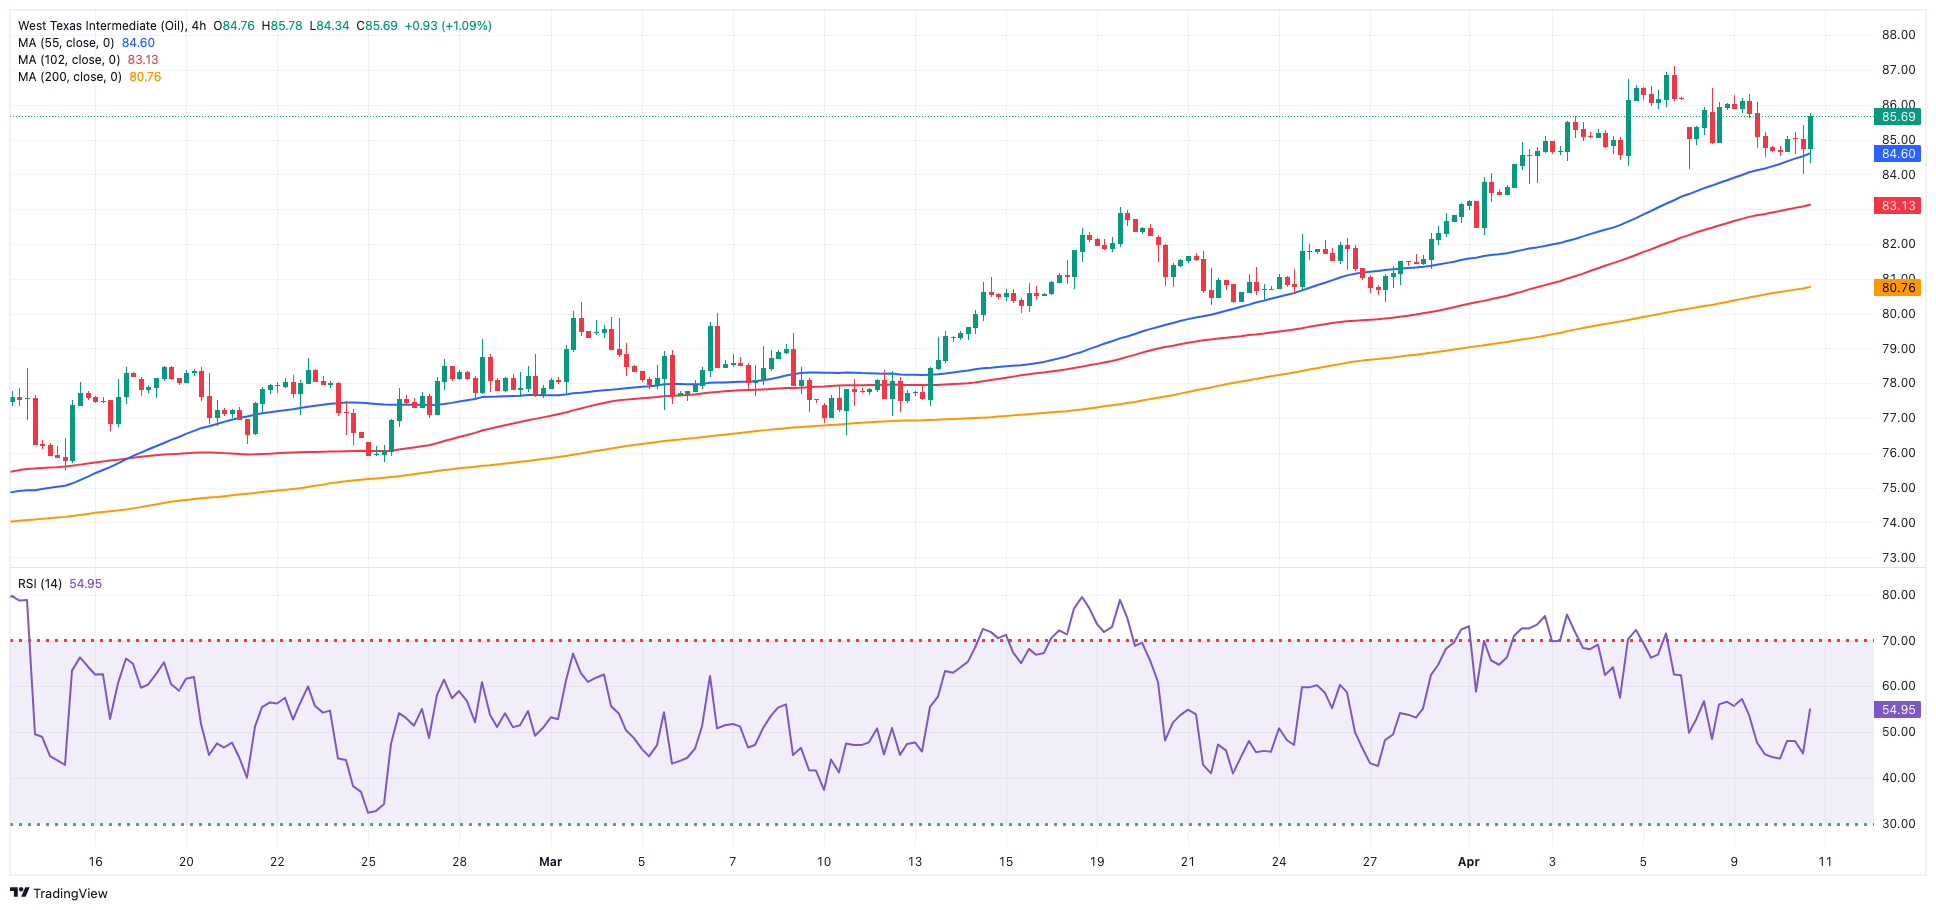
Prices of WTI set aside three consecutive sessions of losses and reclaimed the area beyond the $86.00 mark per barrel on Wednesday.
The commodity's daily gains coincided with the pickup in geopolitical concerns in the Middle East after ceasefire talks between Israel and Hamas appeared to have struggled to show some progress in the past hours.
In fact, persistent geopolitical tensions prompted crude oil to by-pass the larger-than-anticipated increases in crude oil and fuel inventories, attributed to subdued demand and decreased oil exports. On this, the EIA reported that US crude oil inventories went up by 5.841M barrels in the week to April 5, while supplies at Cushing shrank by 0.170M barrels, Weekly Distillate Stocks increased by 1.659M barrels and gasoline stockpiles unexpectedly rose by 0.715M barrels
The next upward challenge for WTI is the 2024 peak of $87.59 (April 5), which precedes the weekly high of $89.83 (October 18, 2023) and the 2023 top of $94.99 (September 28, 2023). Further north, the weekly peak of $97.65 (August 30) falls just short of the psychological $100.00 yardstick. On the contrary, the weekly low of $80.33 (March 21) serves as the immediate downward barrier, followed by the 200-day SMA at $79.41 and the February low of $71.43 (February 5). The breakout of this zone may put a test of the critical $70.00 barrier back on the radar before the 2024 low of $69.31 (January 3) and the December 2023 low of $67.74 (December 13).
Resistance levels: $87.59 $89.82 $94.99 (4H chart)
Support levels: $84.52 $82.58 $80.51 (4H chart)
GER40
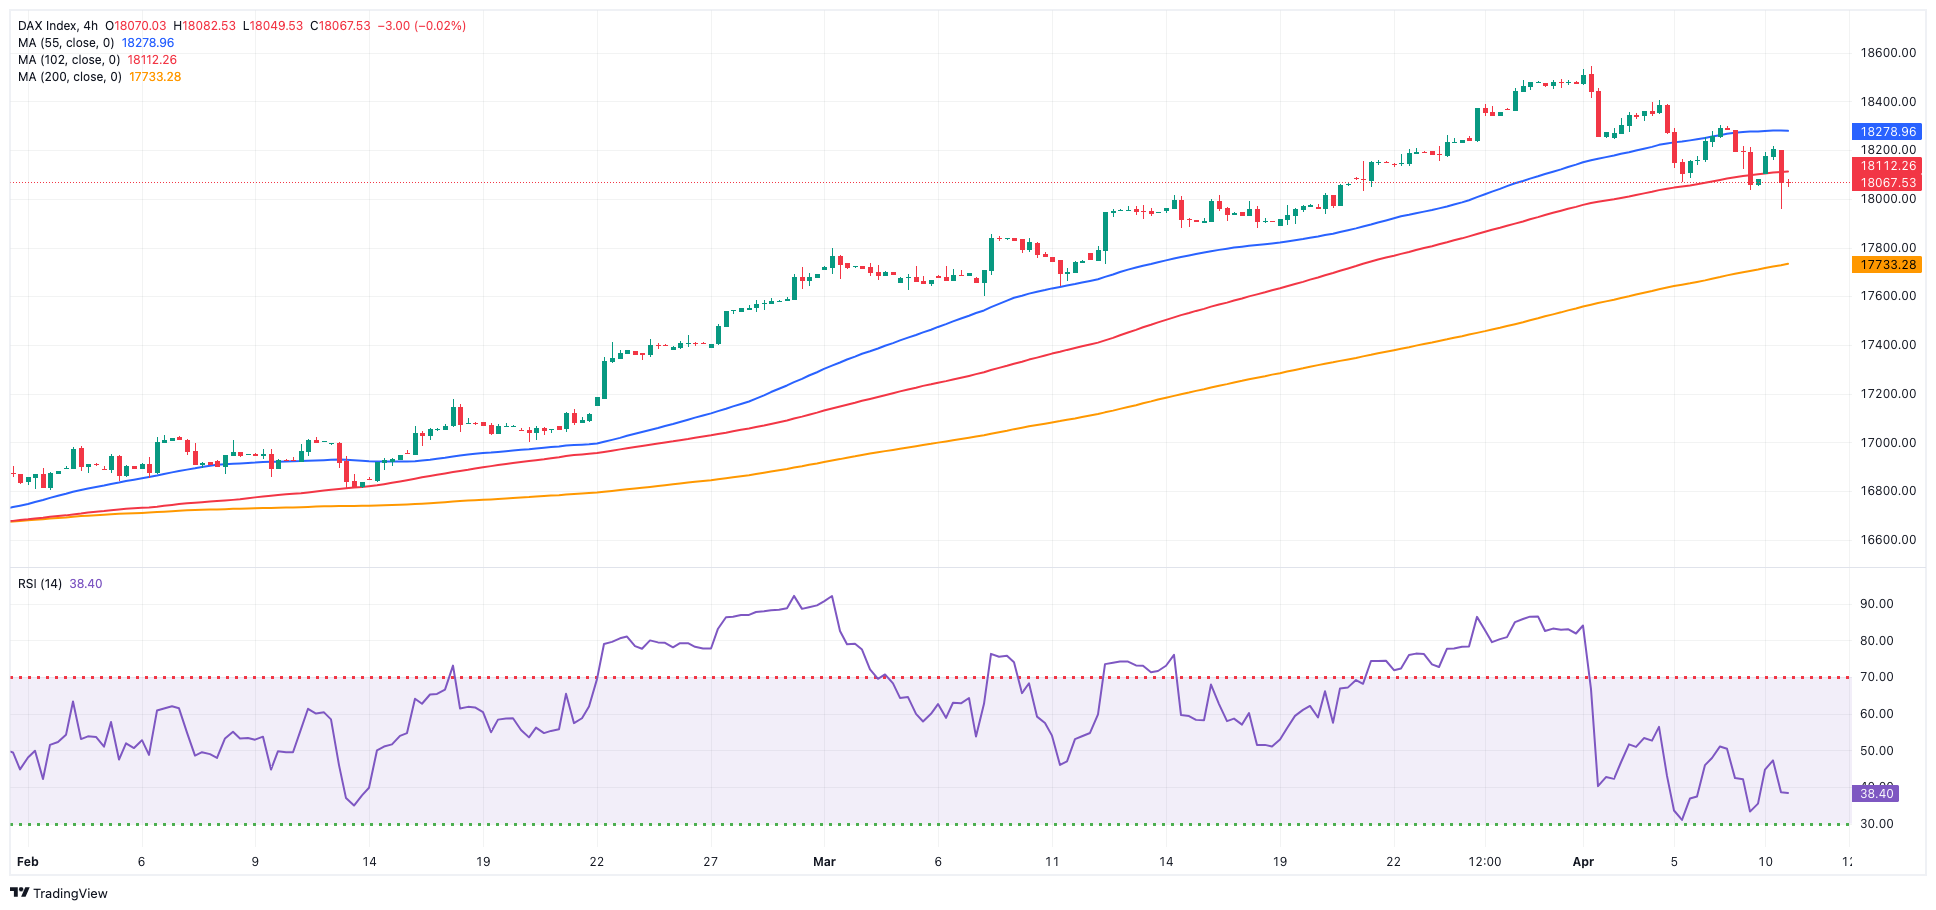
European equities recovered following a knee-jerk response to a strong US inflation report on Wednesday, with investors now looking ahead to the ECB’s monetary policy announcement on Thursday.
Nevertheless, the German benchmark DAX40 successfully rebounded from Tuesday's decline and experienced a modest increase, reflecting growing caution ahead of the ECB event.
It is worth recalling that traders widely anticipate that the central bank will retain its current monetary stance, with expectations for the start of its easing cycle to be sometime during the summer.
Meanwhile, Germany’s money market saw 10-year bund yields rise to the area of recent highs near 2.45%.
The DAX40's next level of resistance is the record high of 18,567 (April 2). Just the opposite, immediate support comes from the April low of 17,975 (April 10) ahead of the March low of 17,619 (March 7), which appears to be reinforced by the provisional 55-day SMA of 17,560. The breach of this region might bring the February low of 16,821 (February 1) back to the forefront, ahead of the 2024 bottom of 16,345 (January 17) and the critical 200-day SMA of 16,346. After dropping below the latter, the weekly low of 15,915 (November 28) may be tested, followed by the October low of 14,630 (October 23) and the 2023 low of 14,458 (March 20). The daily RSI rose marginally to around 53.
Best Performers: Deutsche Bank AG, Commerzbank, Deutsche Telekom AG
Worst Performers: Sartorius AG VZO, Merck, BMW ST
Resistance levels: 18,427 18,567 (4H chart)
Support levels: 17,975 17,619 17,393 (4H chart)
GBPJPY
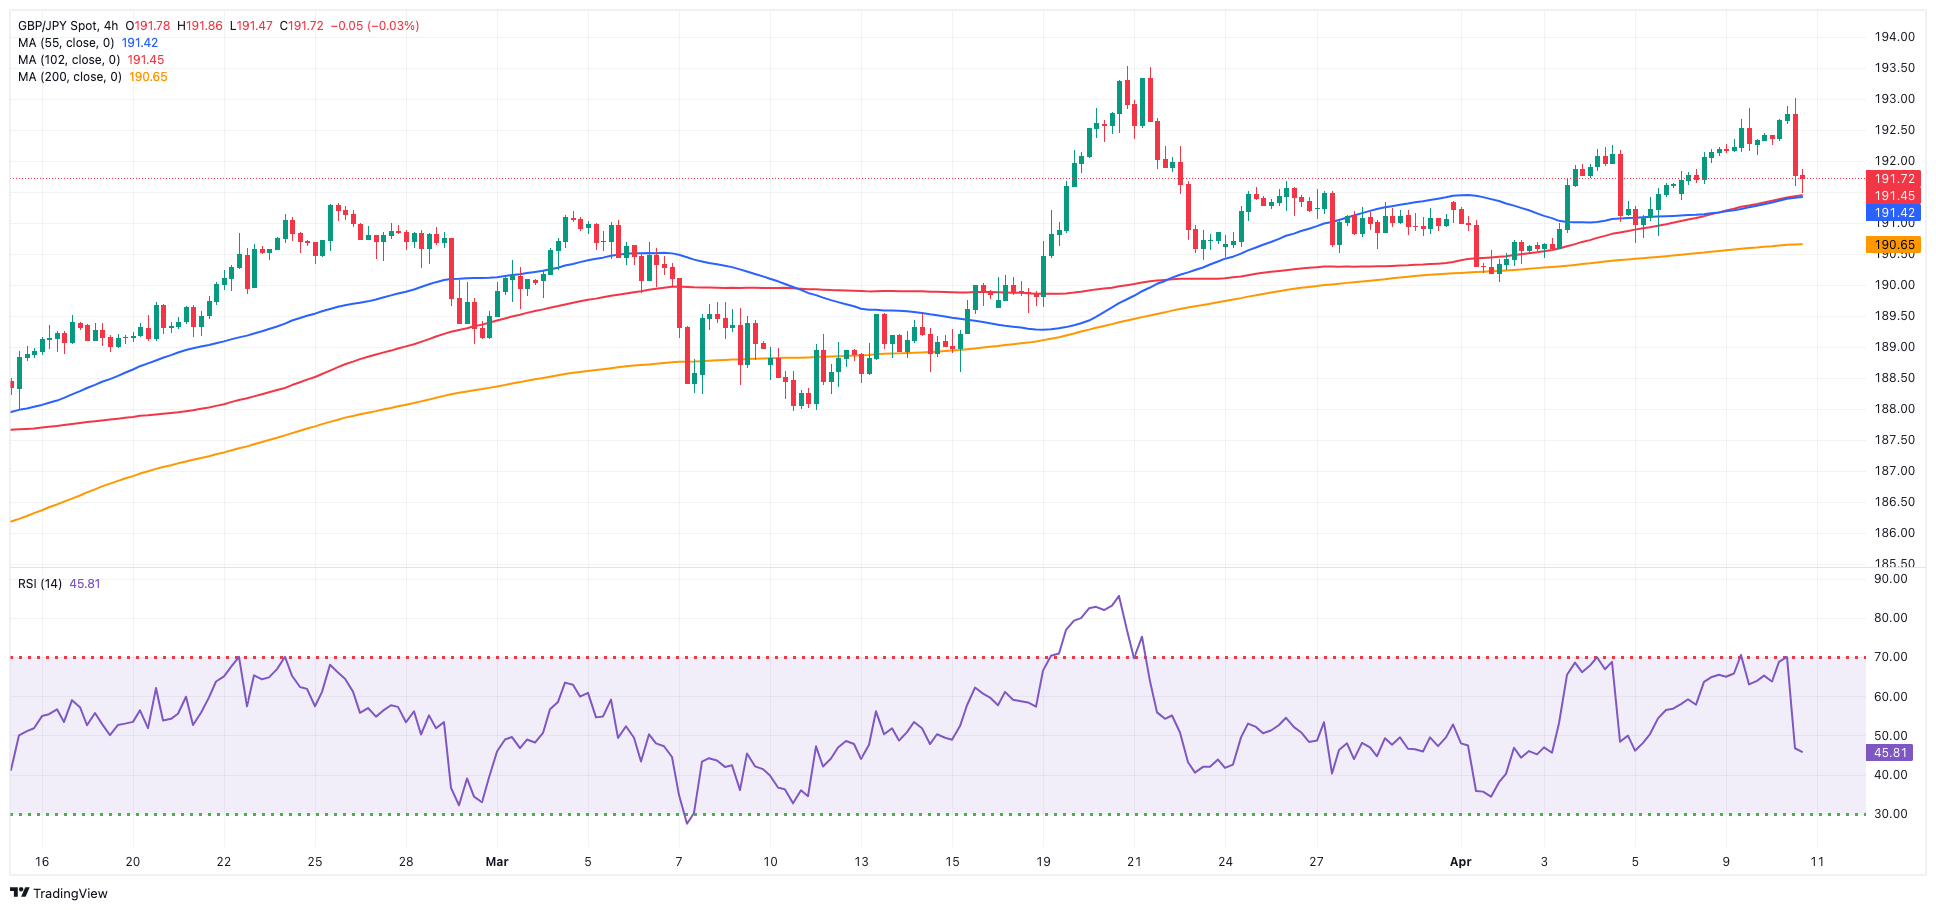
GBP/JPY came under renewed downside pressure soon after hitting a new monthly high in levels just shy of 193.00 the figure on Wednesday.
In fact, the strong bias towards the greenback sparked an equally marked decline in the British pound, dragging the cross to two-day lows in the area of 191.60 despite the increasing depreciation of the Japanese yen.
Meanwhile, downward swings in the cross appear to be limited around the 190.00 level, while annual peaks in the mid-193.00s stymie any upward impetus.
If bulls push stronger, GBP/JPY may hit an immediate upward hurdle at the April peak of 192.97 (April 10), which comes before the 2024 high of 193.53 (March 20). Further up is the August 2015 top of 195.28 (August 18), seconded by the record peak of 195.88 (June 24, 2015). In the other direction, the 55-day SMA at 189.78 underpins the April low of 190.04. The breakdown of the latter suggests a likely slide to the March low of 187.96 (March 11), prior to the intermediate 100-day SMA of 187.30, and the February low of 185.22 (February 1), which appears to be supported by the crucial 200-day SMA of 185.24. A deeper decline might lead to the December 2023 bottom of 178.33 (December 14). The day-to-day RSI retreated to around 55.
Resistance levels: 192.97 193.53 195.28 (4H chart)
Support levels: 191.58 190.67 190.04 (4H chart)
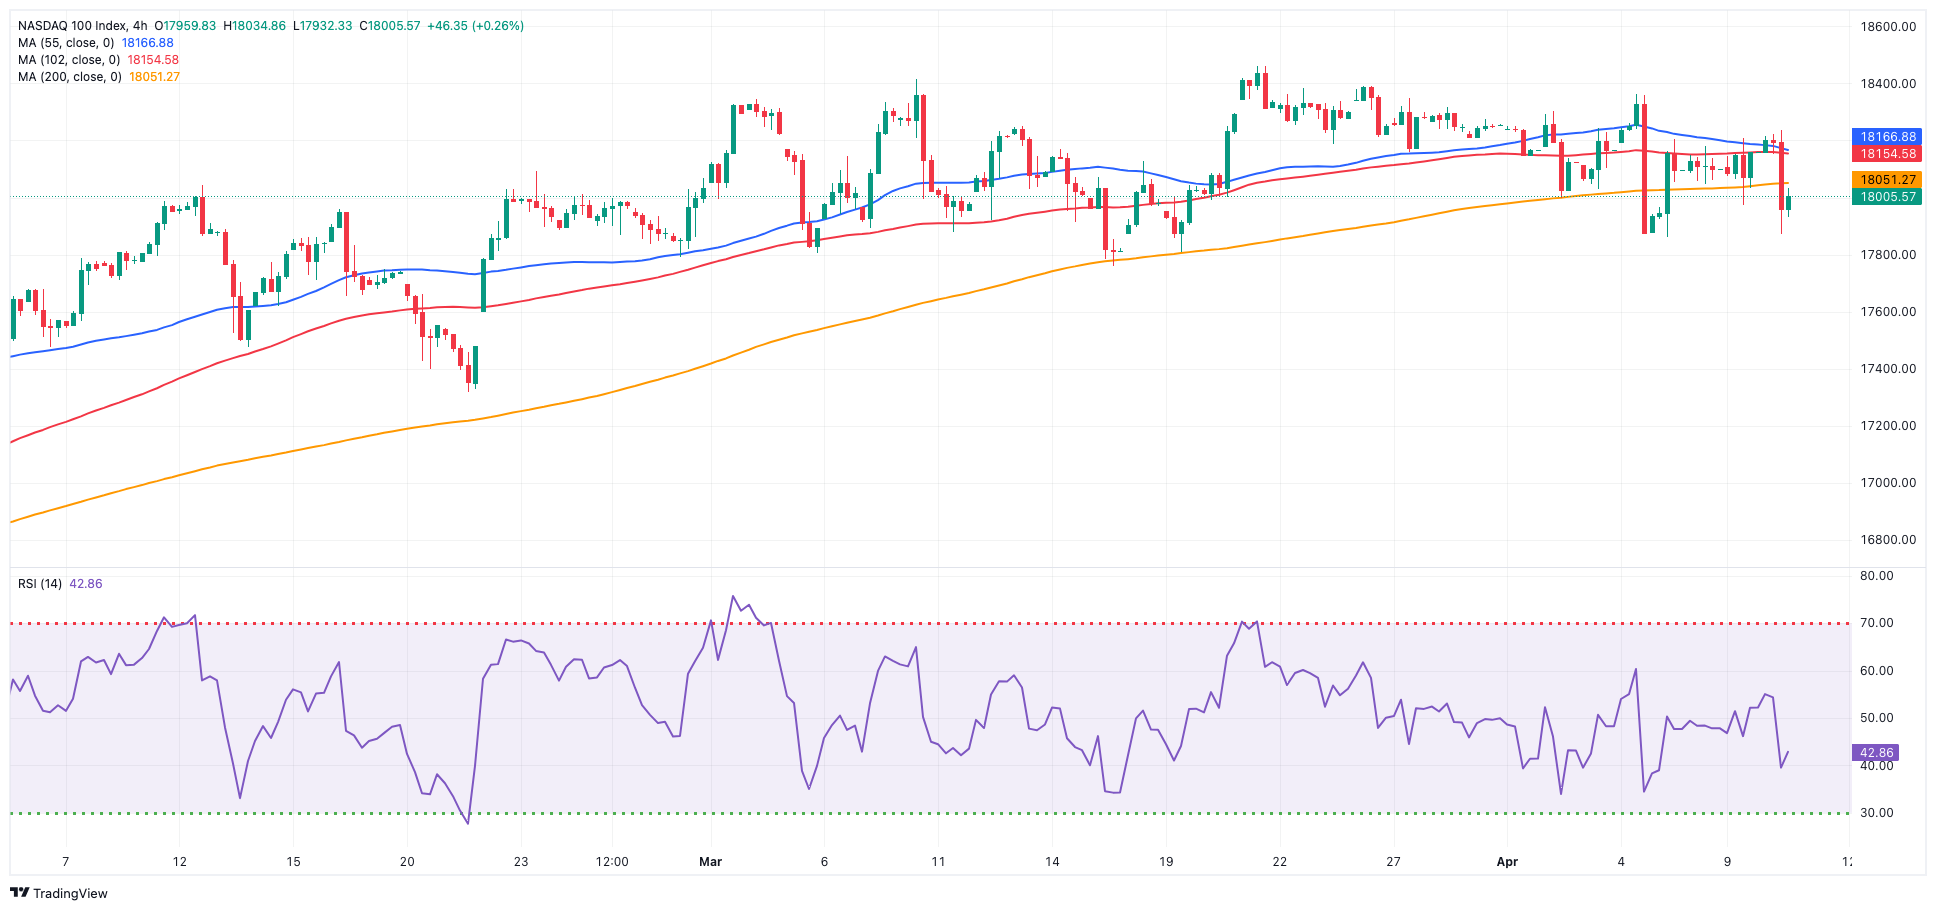
NASDAQ
In tandem with the rest of the US markets, the tech reference Nasdaq 100 receded to three-day lows and returned to the sub-18,000 region midweek.
Stronger-than-estimated US inflation figures tracked by the CPI now seem to favour the first interest rate cut by the Fed in September, pouring cold water over speculation of the start of the easing cycle in June.
The sharp bounce in the greenback and the move to multi-week tops in yields across different maturities also collaborated with the decline in the index.
The return of upward momentum may propel the Nasdaq 100 to an all-time high of 18,464 (March 21). Conversely, the index is expected to find immediate support at its April low of 17,875, followed by weekly lows of 17,319 (February 21) and 17,128 (January 31). If the latter is broken, a challenge to the 2024 bottom of 16,249 (January 5) may emerge, ahead of the crucial 200-day SMA of 16,173 and the December 2023 low of 15,695 (December 4). Additional losses from here may return to the October 2023 level of 14,058 (October 26), which is prior to the April 2023 low of 12,724 (April 25) and the March 2023 low of 11,695 (March 13). The daily RSI retreats to around 47.
Top Gainers: NVIDIA, Constellation Energy, Dollar Tree
Top Losers: Walgreen Boots, CoStar, Warner Bros Discovery
Resistance levels: 18,464 (4H chart)
Support levels: 17,875 17,764 17,319 (4H chart)
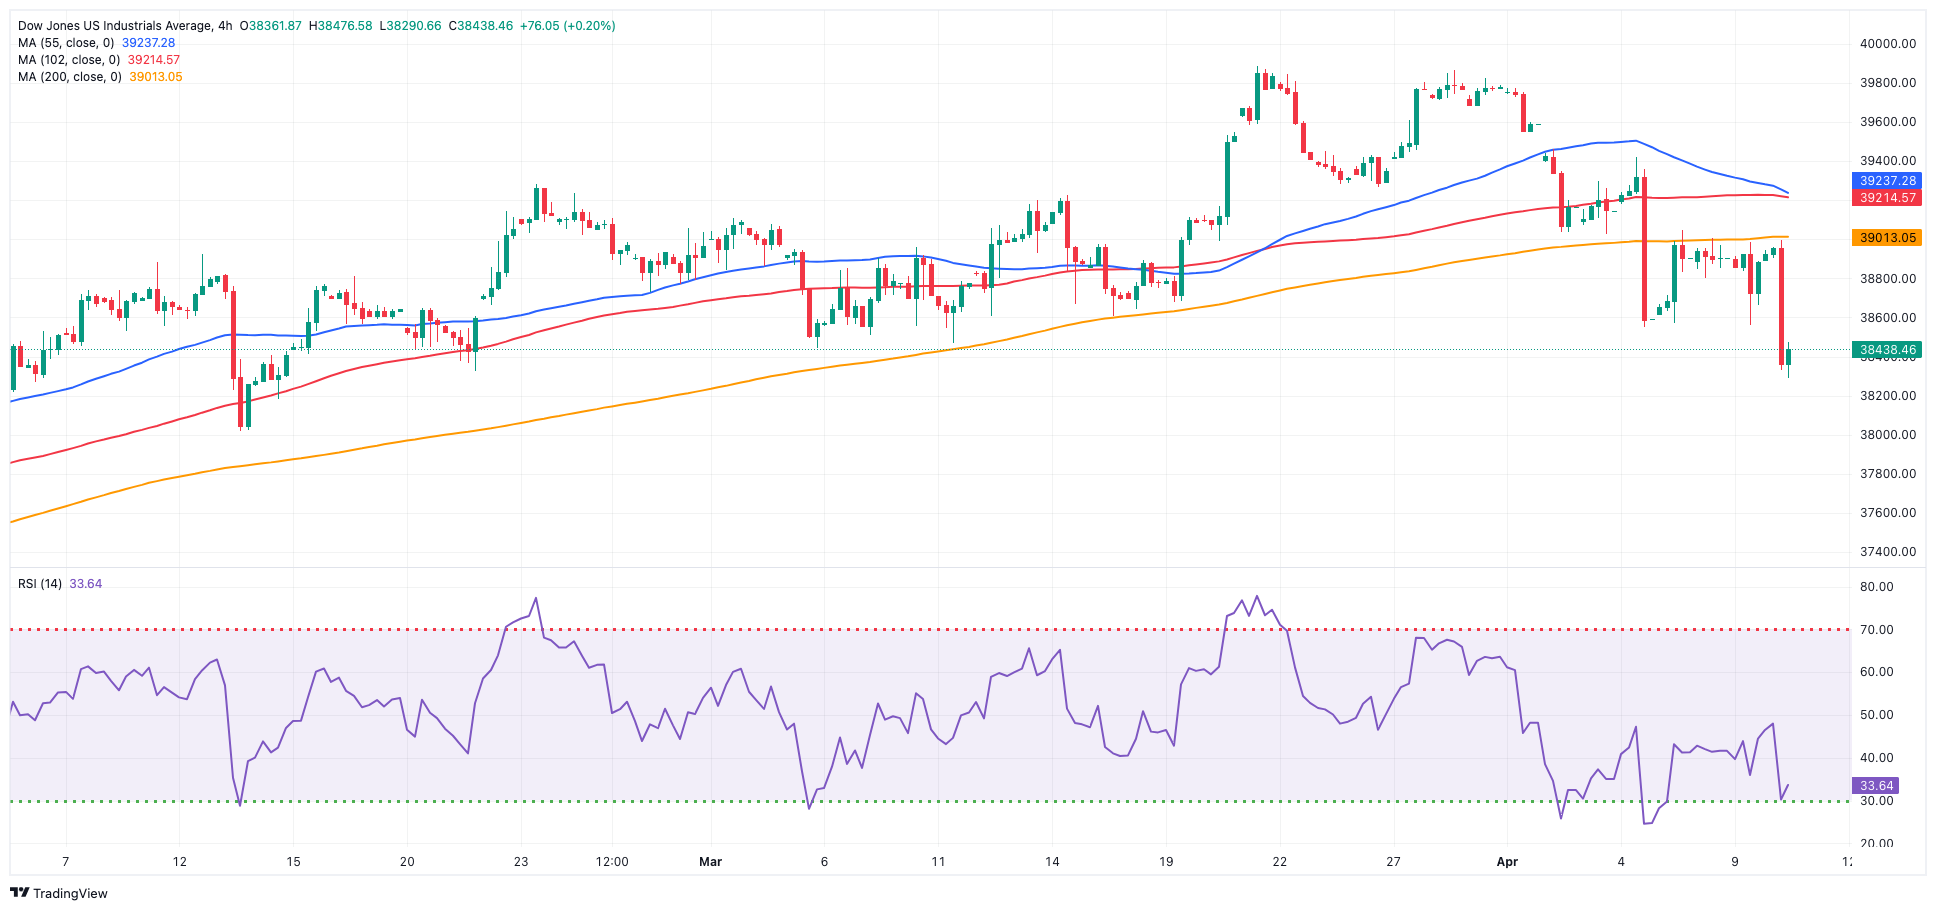
DOW JONES
US equities tracked by the Dow Jones tumbled to fresh two-month lows around the 38,300 region on Wednesday, adding to the current weekly leg lower.
In fact, the selling pressure in the risk complex picked up extra pace after firmer-than-estimated US inflation figures measured by the CPI in March weighed on expectations of a Fed’s rate cut in June, sparking at the same time a risk-off mood among market participants.
Indeed, US consumer prices rose beyond expectations during last month, driven by higher costs for gasoline and rental housing, leading financial markets to speculate that the central bank would postpone interest rate cuts until September.
On Wednesday, the Dow Jones deflated 1.46% to 38,319, the S&P 500 retreated 1.25% to 5,145, and the tech-heavy Nasdaq Composite dropped 0.99% to 16,145.
If the selling pressure continues, the Dow Jones could revisit the February low of 38,039 (February 13) ahead of the interim 100-day SMA of 37,879. The loss of this zone might lead to a test of the 2024 low of 37,122 (January 18), which is just ahead of the crucial 200-day SMA at 36,080. The weekly low of 33,859 (November 7, 2023) comes next, followed by the October 2023 low of 32,327 (October 27), all before the 2023 bottom of 31,429 (March 15). Having stated that, the next up-barrier is the record high of 39,889 (March 21). The daily RSI dropped to around 38.
Top Performers: Walmart, Chevron, Procter&Gamble
Worst Performers: Home Depot, Intel, Goldman Sachs
Resistance levels: 39,421 39,889 (4H chart)
Support levels: 38,304 38,039 37,829 (4H chart)
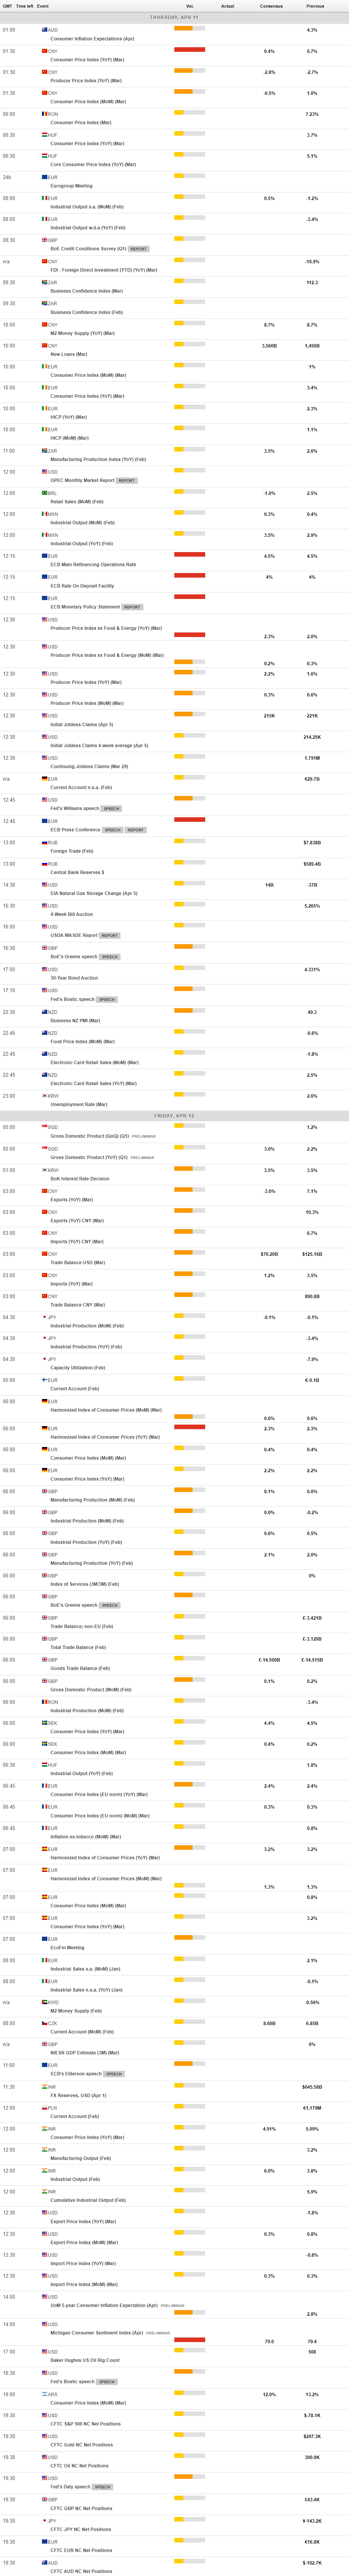
MACROECONOMIC EVENTS
All Information & Updates provided by:

All information relating to the financial markets available on this page has been prepared and issued by FXStreet (Forexstreet SL, Spain, Reg: B62498233) on the basis of publicly available information and all information believed to be reliable and does not conflict with Kuwaiti local laws, and all necessary care has been taken to before the company to ensure that the facts mentioned are correct from the source.
NCM Investment nor any of its directors or employees shall in any way be held responsible for the contents of this news, and the information contained on this page is intended only to provide clients with publicly available information and should not be construed as investment advice, report or analysis and/or constitute an offer or invitation to buy or sell financial instruments of any kind.
RISK WARNING: Forex and CFDs are highly risky leveraged products, as losses can exceed deposits. Please ensure you understand all the risks and take independent advice if necessary. NCM will segregate the clients based on the criteria of the regulator and its bylaws. NCM does not provide any advisory service; the material published does not constitute advice or a recommendation for a transaction in any financial instrument. NCM accepts no responsibility for any use of the content presented and any consequences of that use. Anyone acting on the information provided does so at their own risk.