
- Contact Us:
-

-

-

-


Daily Market Updates
12 Apr 2024
EURUSD
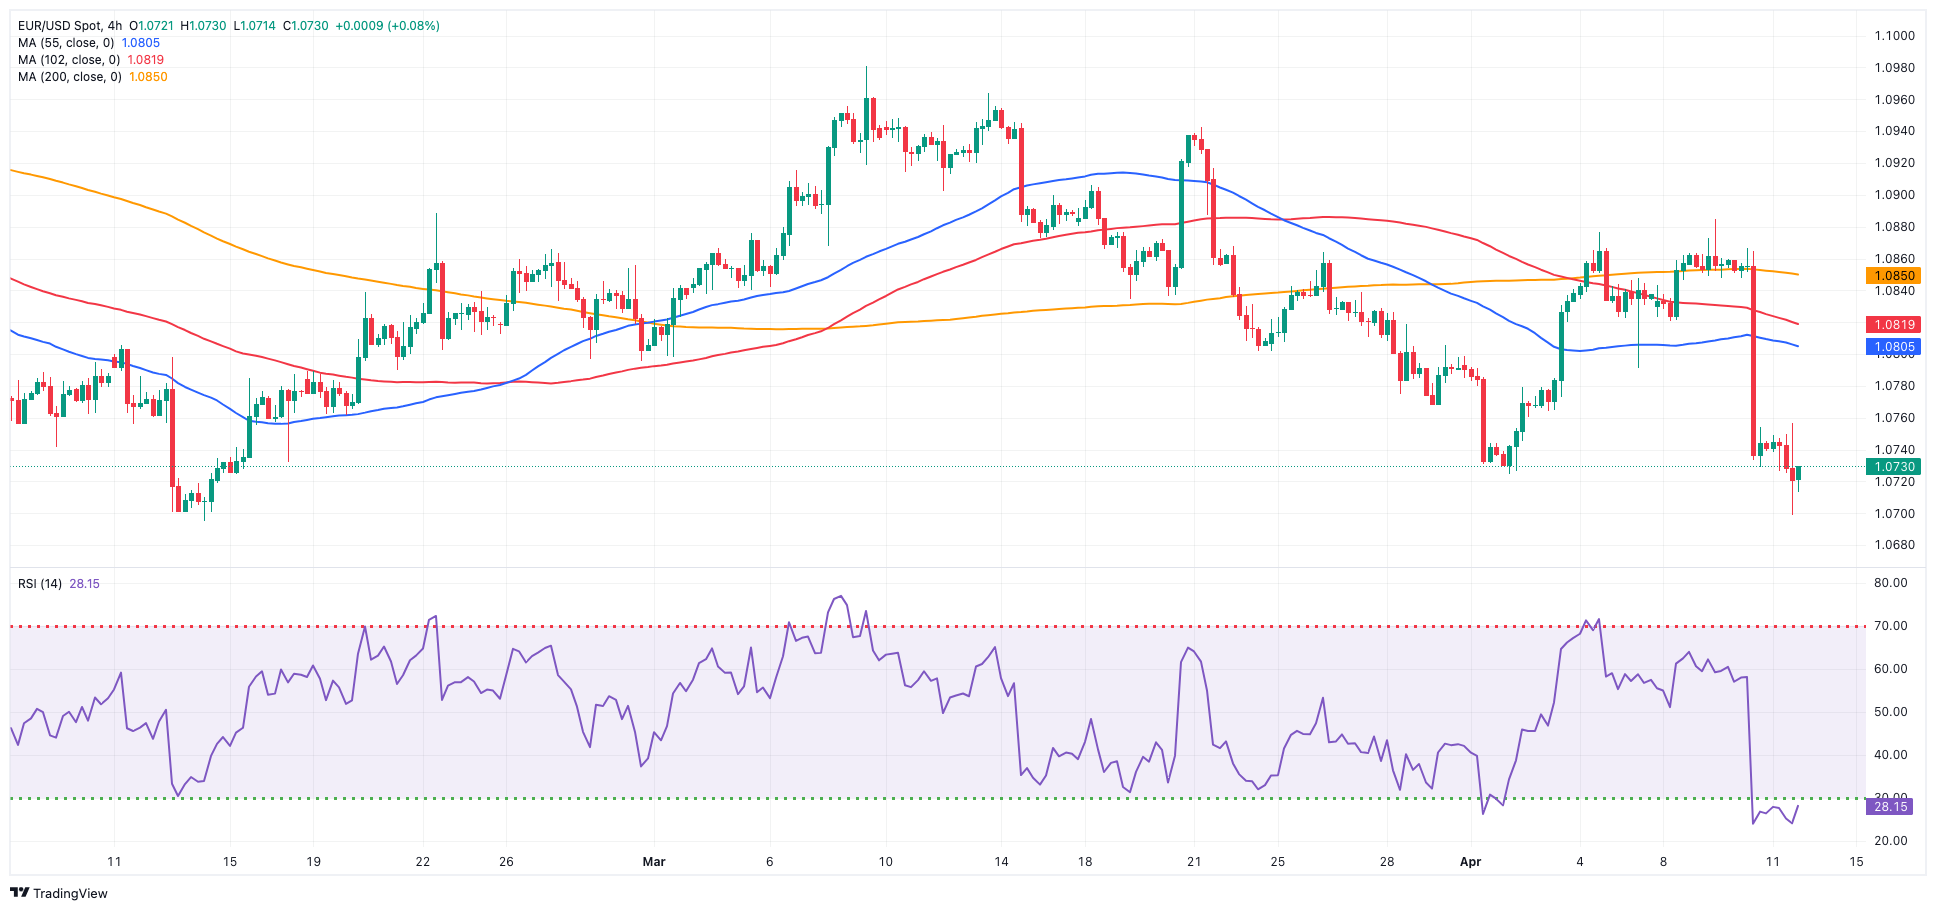
Marginal gains in the greenback seem to have been enough to maintain the bearish note around the risk-associated universe on Thursday, motivating EUR/USD to slip back to the area of two-month lows near 1.0700.
The greenback rose slightly and reached a new five-month peak near 105.40 on the back of further gains in the belly and the long end of the yield curve vs. a lacklustre pullback in the short end, all against the backdrop of rising expectations of the start of the Fed’s easing cycle in September.
On this, CME Group’s FedWatch Tool sees the probability of a rate reduction at the September 18 meeting at around 46%.
There was no noticeable reaction from the single currency after the European Central Bank maintained interest rates at historically elevated levels at its meeting on Thursday, but it conveyed a stronger indication that it might be gearing up for a reduction (in June?) particularly as inflation in the euro zone continues its downward trend.
ECB President Lagarde emphasized the economy's fragility, with labour market tightness easing and price pressures diminishing. She expects inflation to reach target levels next year, with growth risks skewed to the downside. Lagarde clarified that the ECB's decisions are not influenced by the Fed's actions, and the Governing Council will not delay action until each inflation component reaches the 2% target.
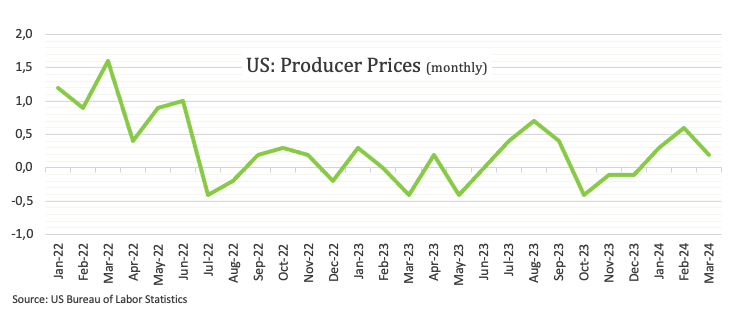
Data-wise, in the US, Producer Prices rose by 0.2% MoM in March and 2.1% from a year earlier. In addition, weekly Initial Claims rose by 211K in the week ending on April 6.
Extra losses in the EUR/USD might challenge the April low of 1.0714 (April 11) before reaching the 2024 bottom of 1.0694 (February 14). A deeper slide might disclose the weekly low of 1.0495 (October 13, 2023), which is above the 2023 bottom of 1.0448 (October 3) and the round milestone of 1.0400. In contrast, immediate resistance is aligned at the key 200-day SMA of 1.0830 prior to the weekly peak of 1.0885 (April 9), and the March high of 1.0981 (March 8). Up from here comes the weekly top of 1.0998 (January 5, 2011), just before the psychological 1.1000 barrier. The breakout of this zone could put pressure on the December 2023 peak of 1.1139 (December 27), which is still supported by the 200-week SMA of 1.1141 and aligns before the 2023 high of 1.1275 (July 18). The daily RSI deflated to around 37.
Resistance levels: 1.0849 1.0885 1.0942 (4H chart)
Support levels: 1.0699 1.0694 1.0656 (4H chart)
USDJPY
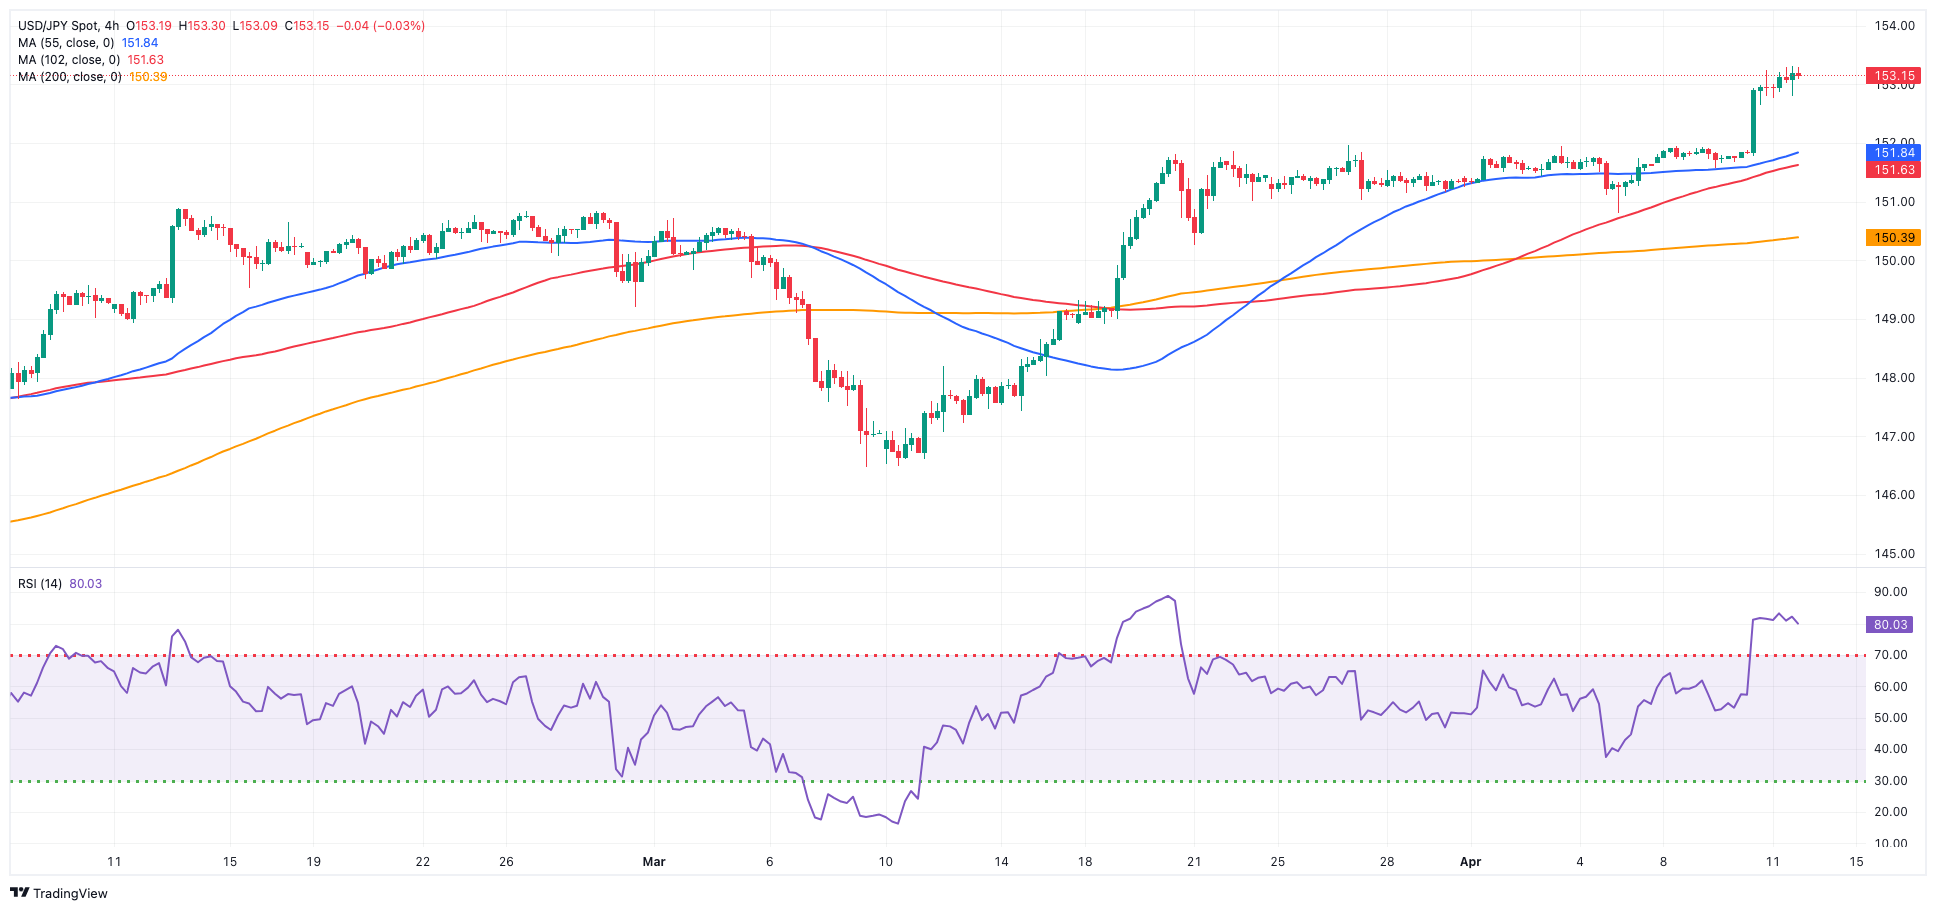
USD/JPY traded in a vacillating fashion despite hitting a new high near 153.30, an area last traded in June 1990.
Once again, higher US yields and extra upside momentum in the greenback accompanied the pair’s price action. However, investors remained wary of the likelihood of FX intervention, particularly after spot surpassed the 152.00 barrier in the previous session.
Regarding potential intervention, Vice Finance Minister for International Affairs Kanda stated that authorities are always prepared for any scenario, whether it necessitates currency intervention or not. Additionally, Finance Minister Suzuki mentioned that officials are closely monitoring currency movements "with a strong sense of urgency."
In tandem with the rise in USD/JPY, JGB 10-year yields climbed to multi-month tops and approached 0.90%.
In the Japanese docket, Foreign Bond Investment rose to ¥346.4B in the week to April 6.
USD/JPY is approaching an upward hurdle at the round figure of 153.00, just ahead of the June 1990 high of 155.80. On the other hand, the pair is projected to find temporary support around the 55-day and 100-day SMAs of 149.81 and 147.79, respectively, before approaching the critical 200-day SMA of 147.17 and the March low of 146.47 (March 8). A breakdown of this zone might result in a return to the February low of 145.89 (February 1), which is prior to the December 2023 low of 140.24 (December 28), the round number 140.00, and the July low of 137.23 (July 14). The daily RSI settled above 72, indicating the overbought condition of the pair.
Resistance levels: 153.29 155.80 155.88 (4H chart)
Support levels: 150.80 150.38 150.26 (4H chart)
GBPUSD
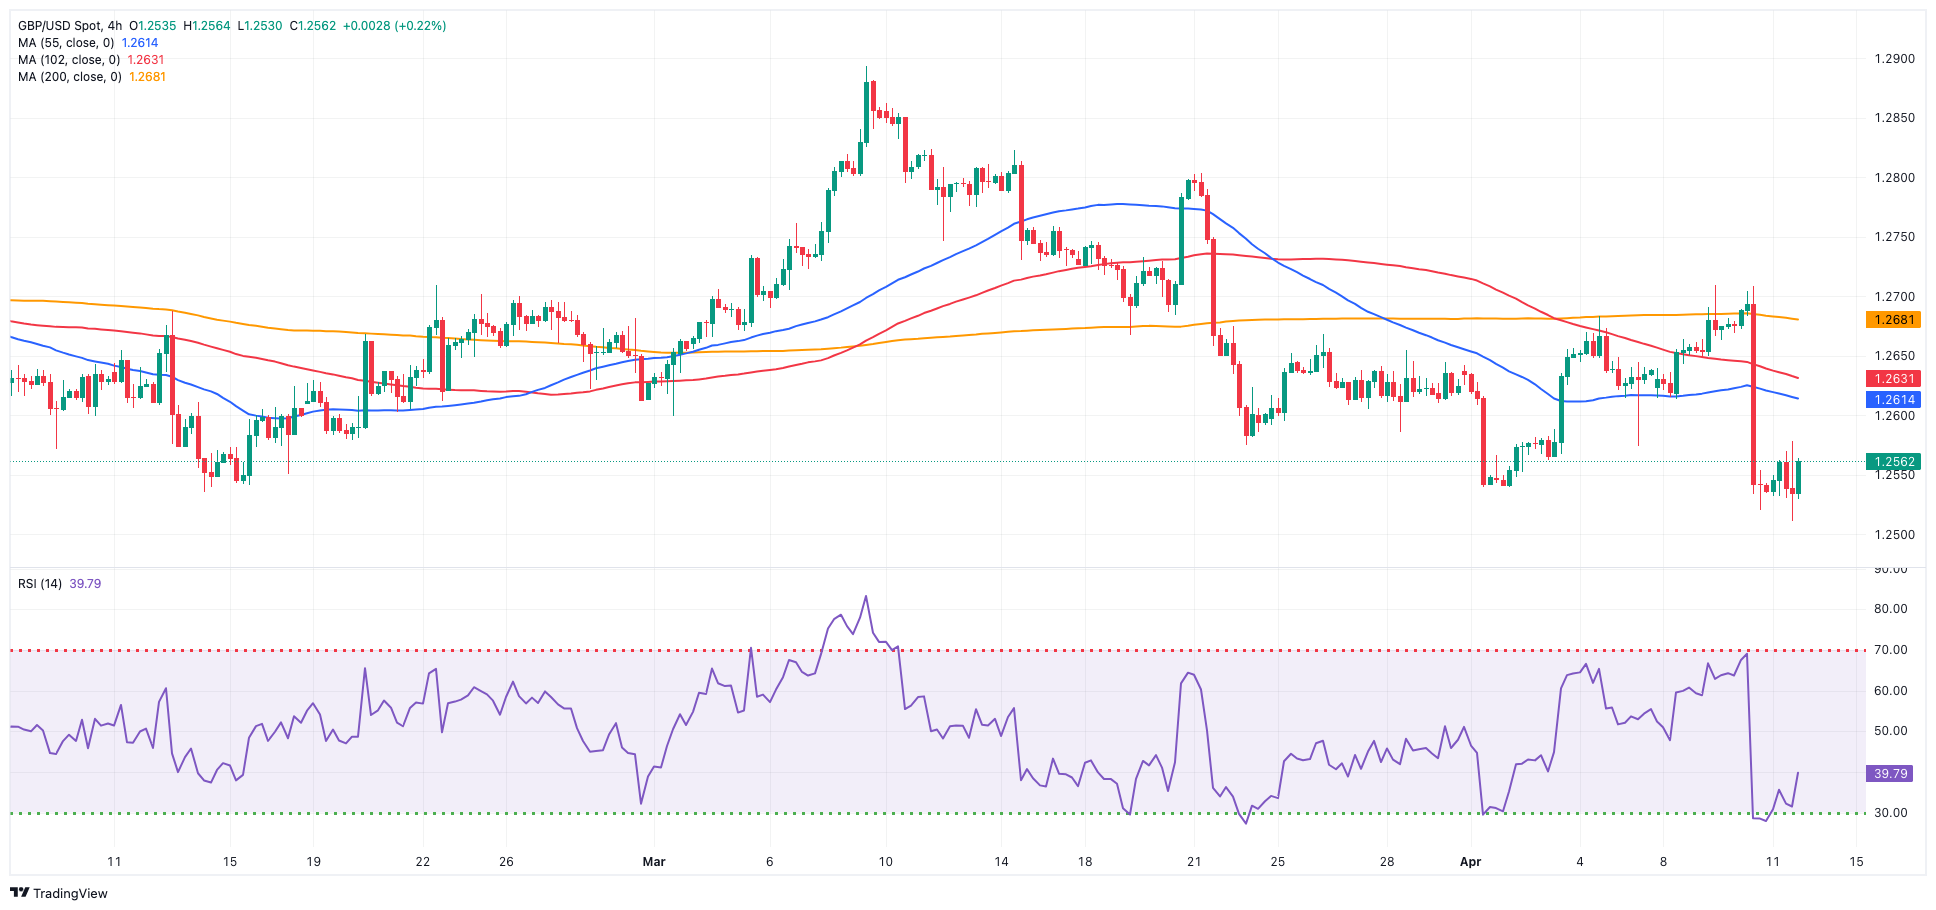
GBP/USD ended with decent gains around 1.2560 after bottoming out near the 2024 low on Thursday.
The British pound faded Wednesday’s steep decline despite the still bullish tone in the greenback, which advanced to fresh YTD peaks near the 105.50 zone when tracked by the USD Index (DXY). This move in the dollar, however, lost traction towards the end of the session in Wall Street.
In the UK money market, 10-year gilt yields advanced to multi-week tops near 4.25% as investors seem to have fully priced in the first rate cut by the BoE in August, although just two cuts are expected in 2024, compared to three at the beginning of the week.
A deeper slide could see GBP/USD retest the 2024 bottom of 1.2518 (February 5) ahead of the December 2023 low of 1.2500 (December 13). A deeper drop would not find a support of note until the weekly low of 1.2187 (November 10, 2023), which is preceding the October 2023 low of 1.2037 and the main 1.2000 contention zone. On the other hand, the initial up-barrier is the April top of 1.2709 (April 9), followed by the weekly peak of 1.2803 (March 21) and the 2024 high of 1.2893 (March 8). Further north, the weekly high of 1.2995 (July 27, 2023) comes just ahead of the critical 1.3000 threshold. On the daily chart, the RSI rose to around 41.
Resistance levels: 1.2680 1.2709 1.2803 (4H chart)
Support levels: 1.2510 1.2500 1.2448 (4H chart)
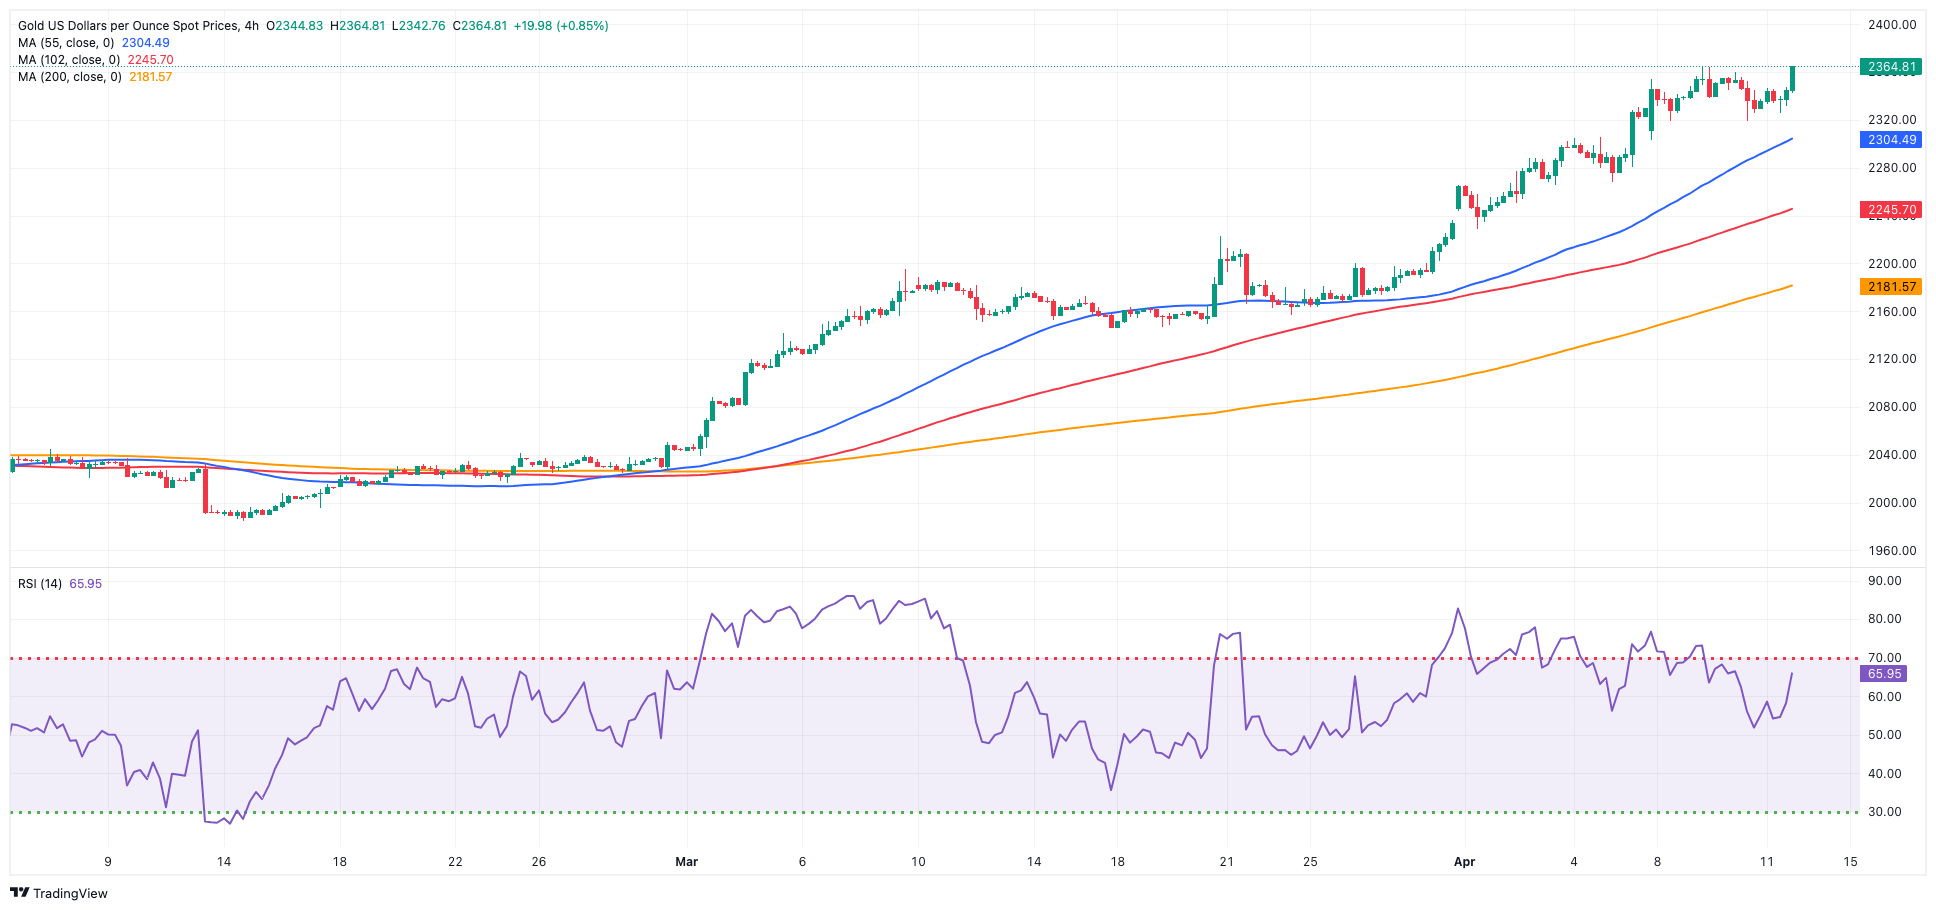
GOLD
Prices of Gold rapidly left behind Wednesday’s CPI-led pullback and resumed their uptrend on Thursday, challenging the area of record highs past $2,360 per troy ounce.
The bid bias around the precious metal resurged after US Producer Prices took on a soft tone in March, bolstering investors’ hopes of interest rate cuts by the Fed.
Extra support for the yellow metal also came from persistent central bank purchases and geopolitical uncertainty, as the likelihood of a ceasefire in the Middle East has dwindled as of late.
Gold is facing immediate resistance at its all-time top of $2,365 (April 9). Just the opposite, the weekly low of $2,146 (March 18) comes first, followed by the preliminary 55-day and 100-day SMAs of $2,123 and $2,081, respectively, all before the more critical 200-day SMA of $2,006. Moving south, the 2024 low of $1,984 (February 14) is followed by the December 2023 low of $1,973 and the November 2023 low of $1,931. The failure in this location might drive the metal to test its October 2023 bottom of $1,810, then the 2023 low of $1,804 and the critical $1,800 conflict zone.
Resistance levels: $2,365 (4H chart)
Support levels: $2,319 $2,267 $2,228 (4H chart)
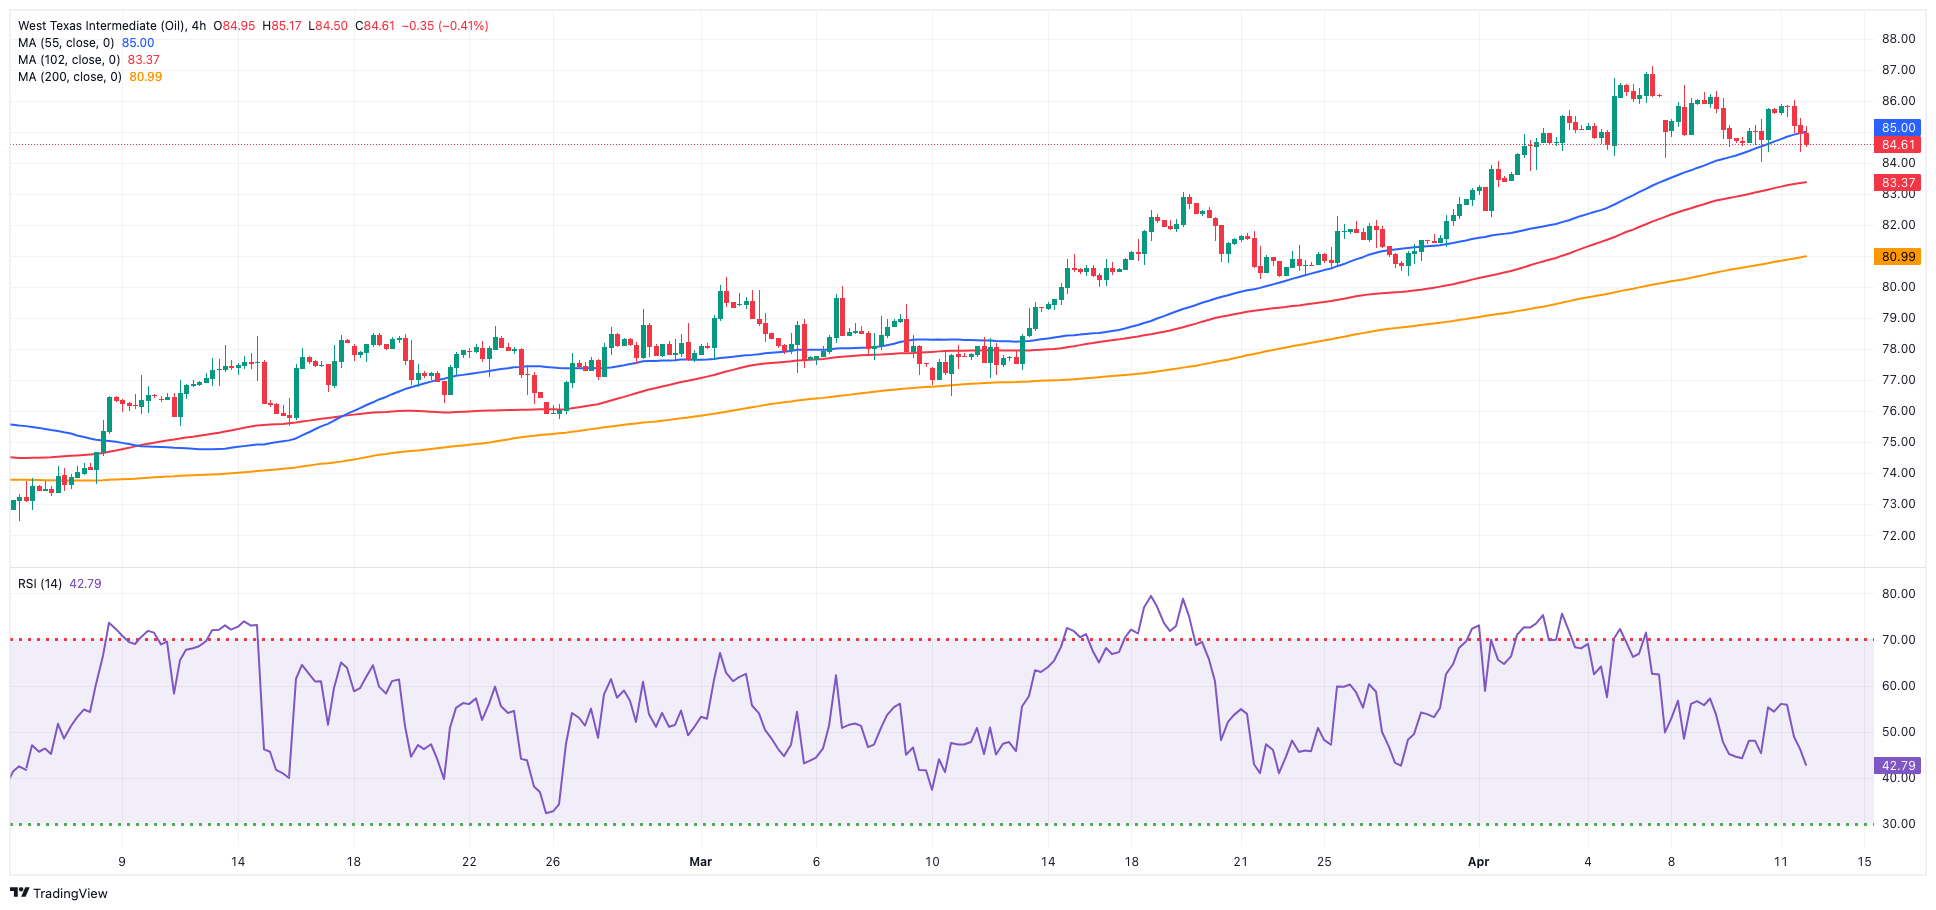
CRUDE WTI
WTI prices traded on the defensive, although they stuck to their consolidative theme in the upper range on Thursday.
Indeed, crude oil prices remained below the $86.00 mark per barrel against the backdrop of a significant US refinery outage in Texas and persistent US inflation, which tempered expectations for imminent interest rate cuts by the Fed.
However, concerns about potential attacks by Iran on Israeli interests and the lack of progress on ceasefire talks in the Middle East crisis kept the commodity hovering near six-month highs.
Moving forward, traders are expected to shift their attention to the IEA’s monthly report due on Friday.
The next upward challenge for WTI is the 2024 peak of $87.59 (April 5), which comes before the weekly high of $89.83 (October 18, 2023) and the 2023 top of $94.99 (September 28, 2023). Further north, the weekly peak of $97.65 (August 30) is barely shy of the psychological $100.00 yardstick. On the flip side, the weekly low of $80.33 (March 21) is the immediate downward barrier, followed by the 200-day SMA of $79.49 and the February low of $71.43 (February 5). The breakdown of this zone may bring the important $70.00 barrier back into focus before the 2024 low of $69.31 (January 3) and the December 2023 bottom of $67.74 (December 13).
Resistance levels: $87.59 $89.82 $94.99 (4H chart)
Support levels: $84.52 $82.58 $80.51 (4H chart)
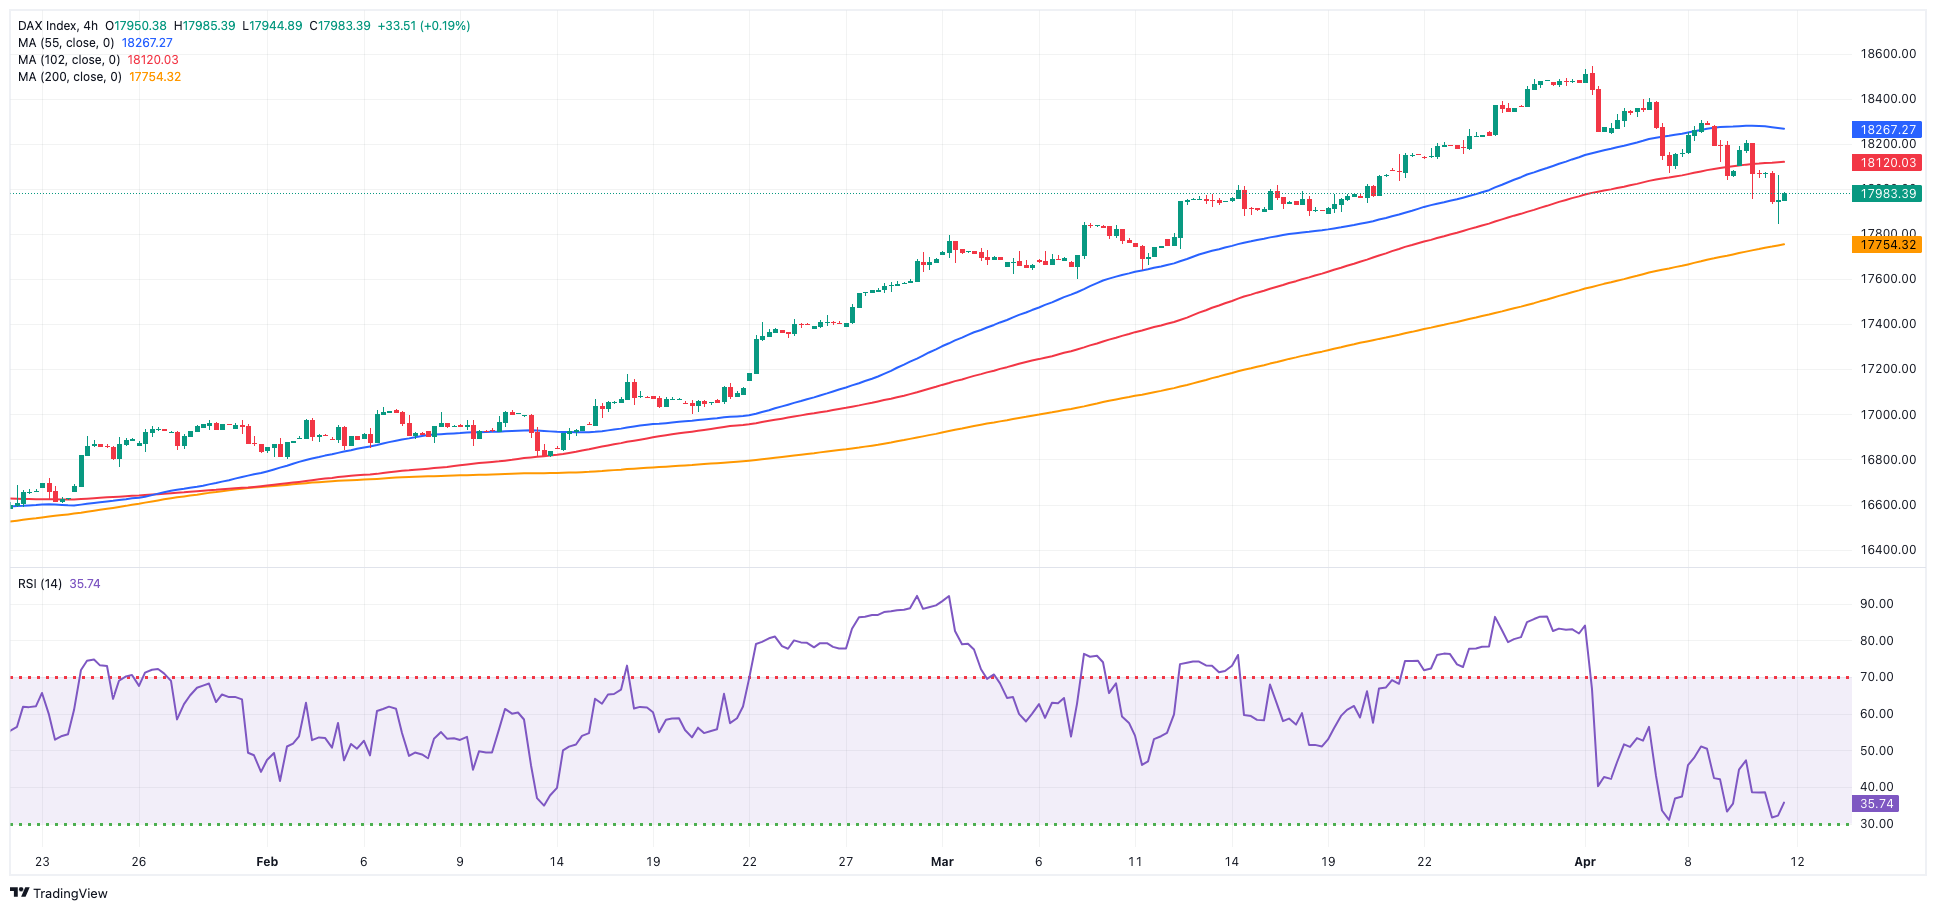
GER40
German stocks measured by the reference DAX40 breached the contention zone around 18,000, reaching fresh four-week lows on Thursday.
The continuation of the leg lower in the DAX40 came after the ECB maintained its monetary status quo unchanged at its event on Thursday, a move that has been largely telegraphed by the central bank.
However, the ECB hinted at the likelihood that the first interest rate cut could be at the bank’s June meeting.
Also weighing on the index emerged another uptick in German 10-year bund yields, which approached 2.50%, the highest level in the last six weeks.
The loss of the April low of 17,864 (April 11) could motivate the DAX40 to dispute the March low of 17,619 (March 7), which appears to be underpinned by the provisional 55-day SMA of 17,584. The breach of this region might bring the February low of 16,821 (February 1) back on the radar, ahead of the crucial 200-day SMA of 16,356 and the 2024 bottom of 16,345 (January 17). After falling below the latter, the weekly low of 15,915 (November 28) might be tested, followed by the October low of 14,630 (October 23) and the 2023 low of 14,458 (March 20). Having said that, the next level of resistance is the record high of 18,567 (April 2). The daily RSI dropped to the area of 47.
Best Performers: RWE AG ST, Rheinmetall AG, Zalando SE
Worst Performers: Deutsche Telekom AG, Commerzbank, BASF
Resistance levels: 18,197 18,427 18,567 (4H chart)
Support levels: 17,864 17,619 17,413 (4H chart)
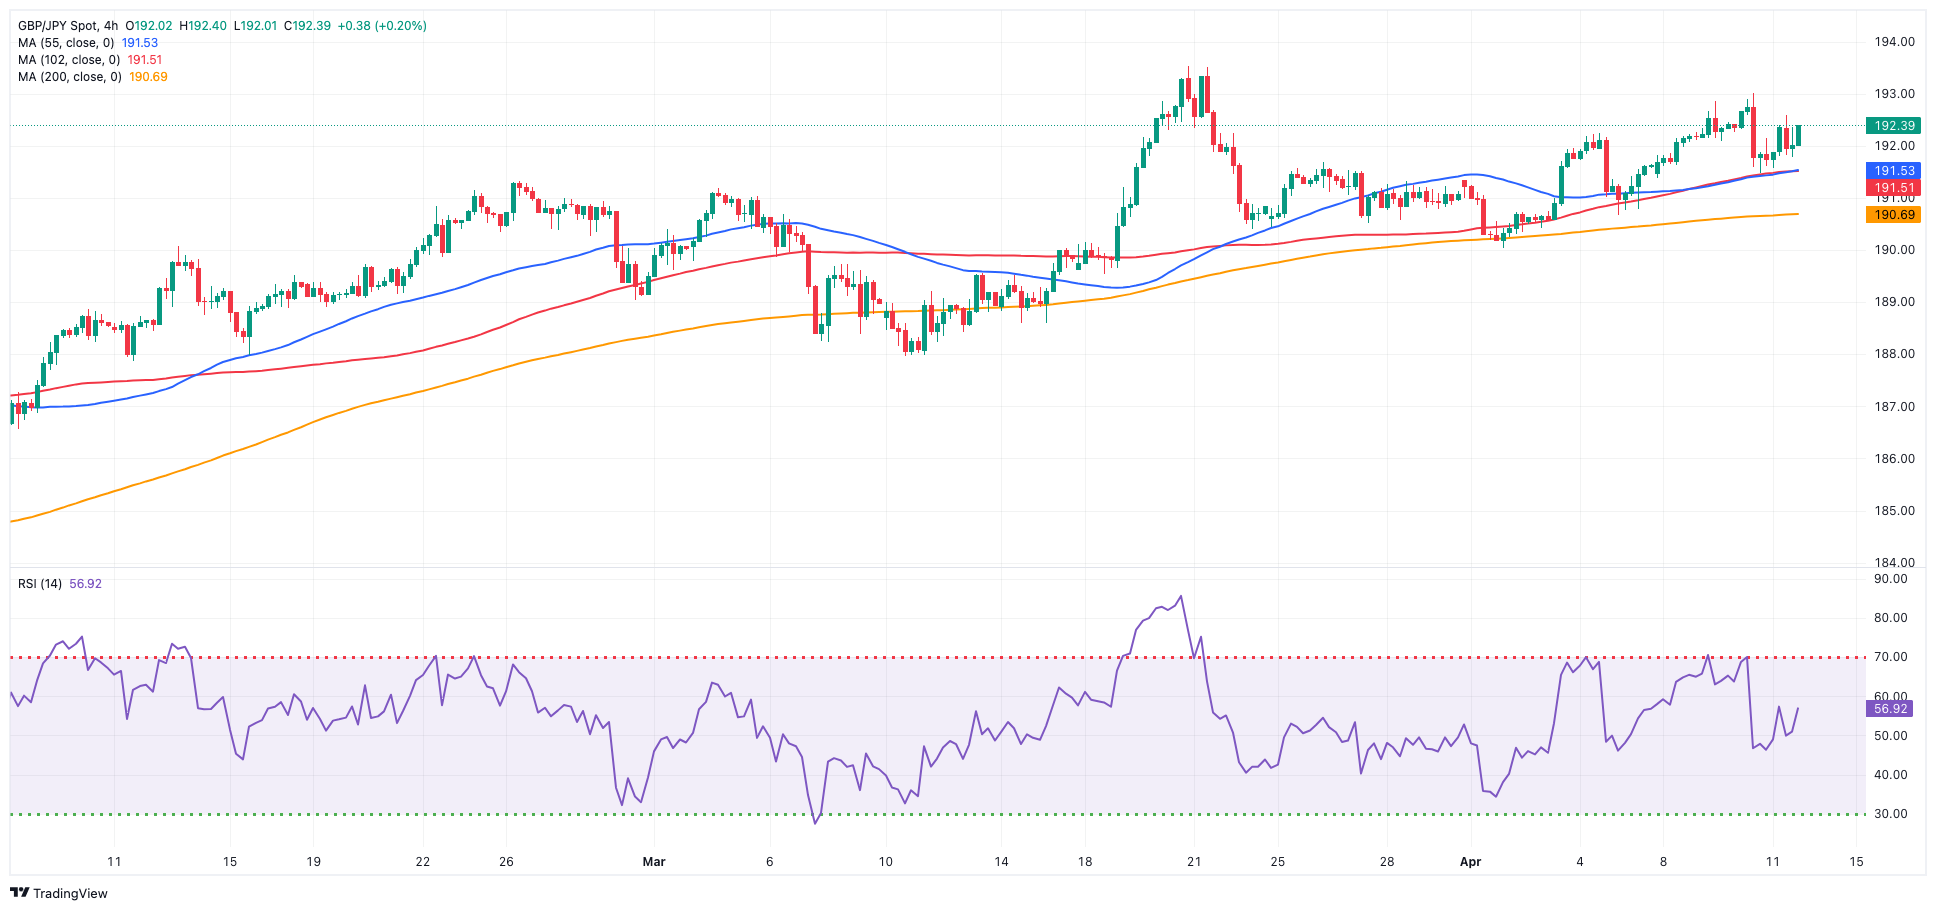
GBPJPY
The vacillating mood in the dollar lent some respite to the risk-associated universe on Thursday, prompting GBP/JPY to reverse recent losses and regain the area beyond 192.00.
In fact, while the Japanese yen lacked direction, the renewed buying pressure lifted the quid and propped up the daily gains, albeit maintaining some consolidation in the cross.
In the meantime, declines in the cross seem to be restricted near the 190.00 level, whereas yearly highs in the mid-193.00s are hindering any upward momentum for the time being.
If bulls push harder, GBP/JPY may face an immediate upward hurdle at the April peak of 192.97 (April 10), prior to the 2024 high of 193.53 (March 20). The breakout of this level might expose the August 2015 top of 195.28 (August 18), seconded by the record peak of 195.88 (June 24, 2015). In the other direction, the 55-day SMA at 189.86 reinforces the April low of 190.04. Extra weakness from here indicates a possible decline to the March low of 187.96 (March 11), which is previous to the intermediate 100-day SMA of 187.36, and the February low of 185.22 (February 1), which remains supported by the critical 200-day SMA of 185.28 and comes ahead of the December 2023 bottom of 178.33 (December 14). The day-to-day RSI rose to the proximity of 60.
Resistance levels: 192.97 193.53 195.28 (4H chart)
Support levels: 191.47 190.67 190.04 (4H chart)
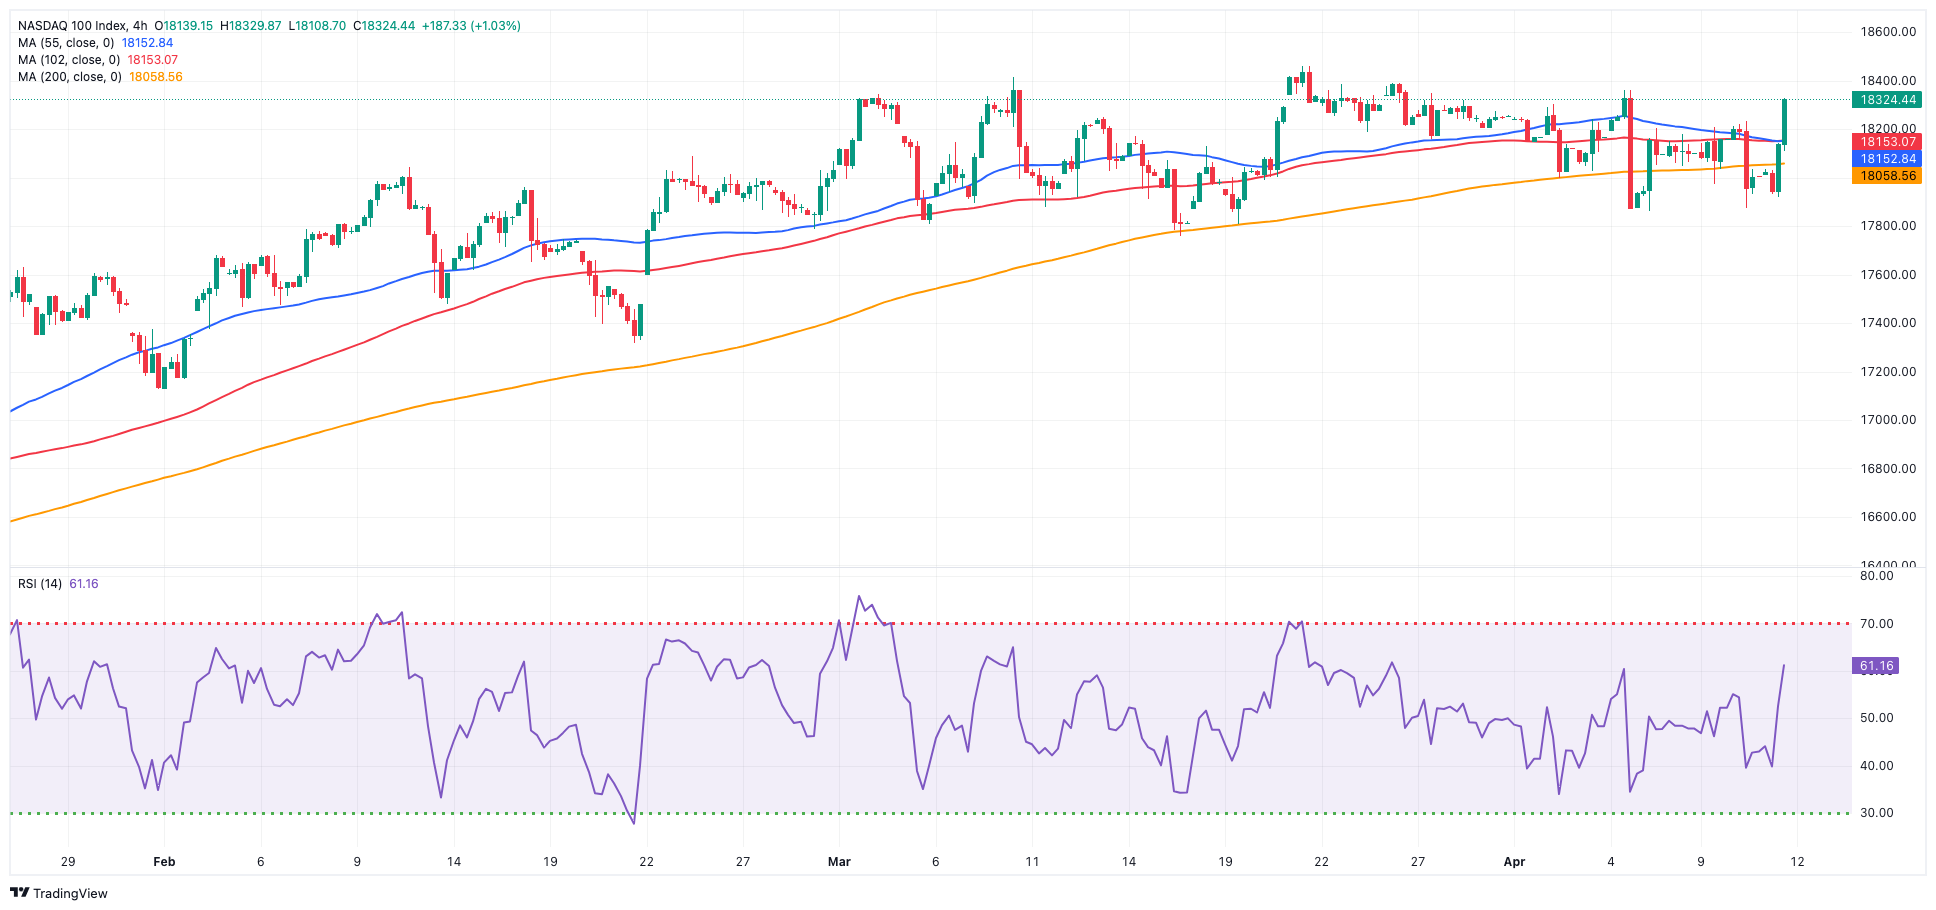
NASDAQ
Fresh bullish sentiment in the US tech sector reinvigorated the upside in the Nasdaq 100 index, lifting it to weekly highs around 18,300 on Thursday.
The marked rebound in the tech reference index came amidst some loss of momentum in the greenback, mixed US yields across the curve and some hopes that the Fed might start its easing cycle soon after US Producer Prices rose less than expected in March, contrasting with latest CPI prints.
Immediately to the upside for the Nasdaq 100 emerges the all-time high of 18,464 (March 21). In contrast, the index is likely to find immediate support at its April low of 17,875, followed by weekly lows of 17,319 (February 21) and 17,128 (January 31). If the latter is broken, a challenge to the 2024 bottom of 16,249 (January 5) could arise, ahead of the critical 200-day SMA of 16,191 and the December 2023 low of 15,695 (December 4). Additional losses from here may return to the October 2023 level of 14,058 (October 26), which preceded the April 2023 low of 12,724 (April 25) and the March 2023 low of 11,695 (March 13). The daily RSI climbed to the 56 zone.
Top Gainers: Broadcom, Atlassian Corp Plc, GE HealthCare
Top Losers: Fastenal, Marvell, Regeneron Pharma
Resistance levels: 18,464 (4H chart)
Support levels: 17,875 17,764 17,319 (4H chart)
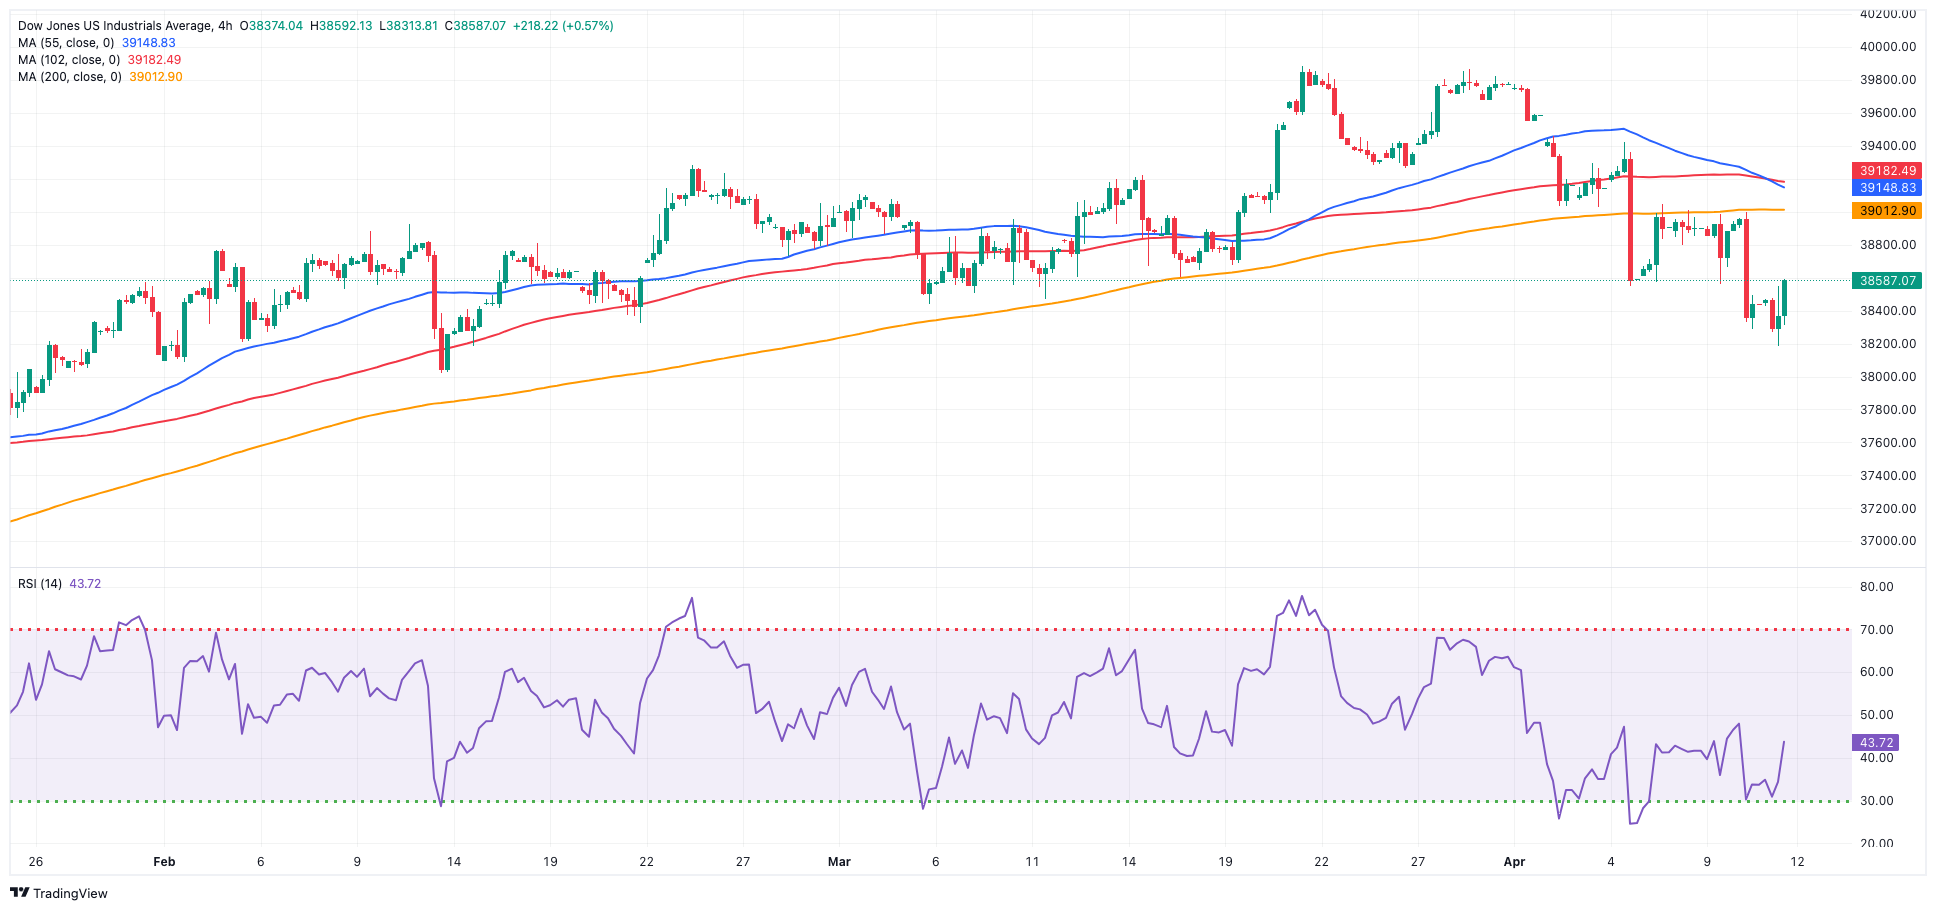
DOW JONES
US stocks gauged by the Dow Jones rebounded from two-month lows around 38,200 and managed to clock modest gains on Thursday.
The small bounce in the index came against the backdrop of investors’ repricing of a rate cut by the Fed in July or September, particularly in response to recent sticky inflation figures.
In addition, the Fed's Williams (New York) mentioned that although the Fed had achieved significant progress in reducing inflation, it wasn't necessary to transition to a more accommodative monetary policy stance yet, considering the recent irregular movements in price pressures.
His colleague Barkin (Richmond) remarked that the most recent inflation figures indicated that the Fed hasn't reached its desired level yet and expressed uncertainty regarding the continuity of inflation easing.
On Thursday, the Dow Jones rose 0.24% to 38,556, the S&P 500 advanced 0.86% to 5,205, and the tech-centric Nasdaq Composite gained 1.59% to 16,428.
If the selling pressure persists, the Dow Jones may return its February low of 38,039 (February 13), ahead of the intermediate 100-day SMA of 37,916. The loss of this zone may result in a test of the 2024 bottom of 37,122 (January 18), which is ahead of the critical 200-day SMA at 36,105. The weekly low of 33,859 (November 7, 2023) is next, followed by the October 2023 low of 32,327 (October 27), all before the 2023 bottom of 31,429 (March 15). The other way around, the next up-barrier is the record high of 39,889 (March 21). The daily RSI bounced beyond 42.
Top Performers: Nike, Apple, Amgen
Worst Performers: Travelers, UnitedHealth, Chevron
Resistance levels: 39,421 39,889 (4H chart)
Support levels: 38,197 38,039 37,829 (4H chart)
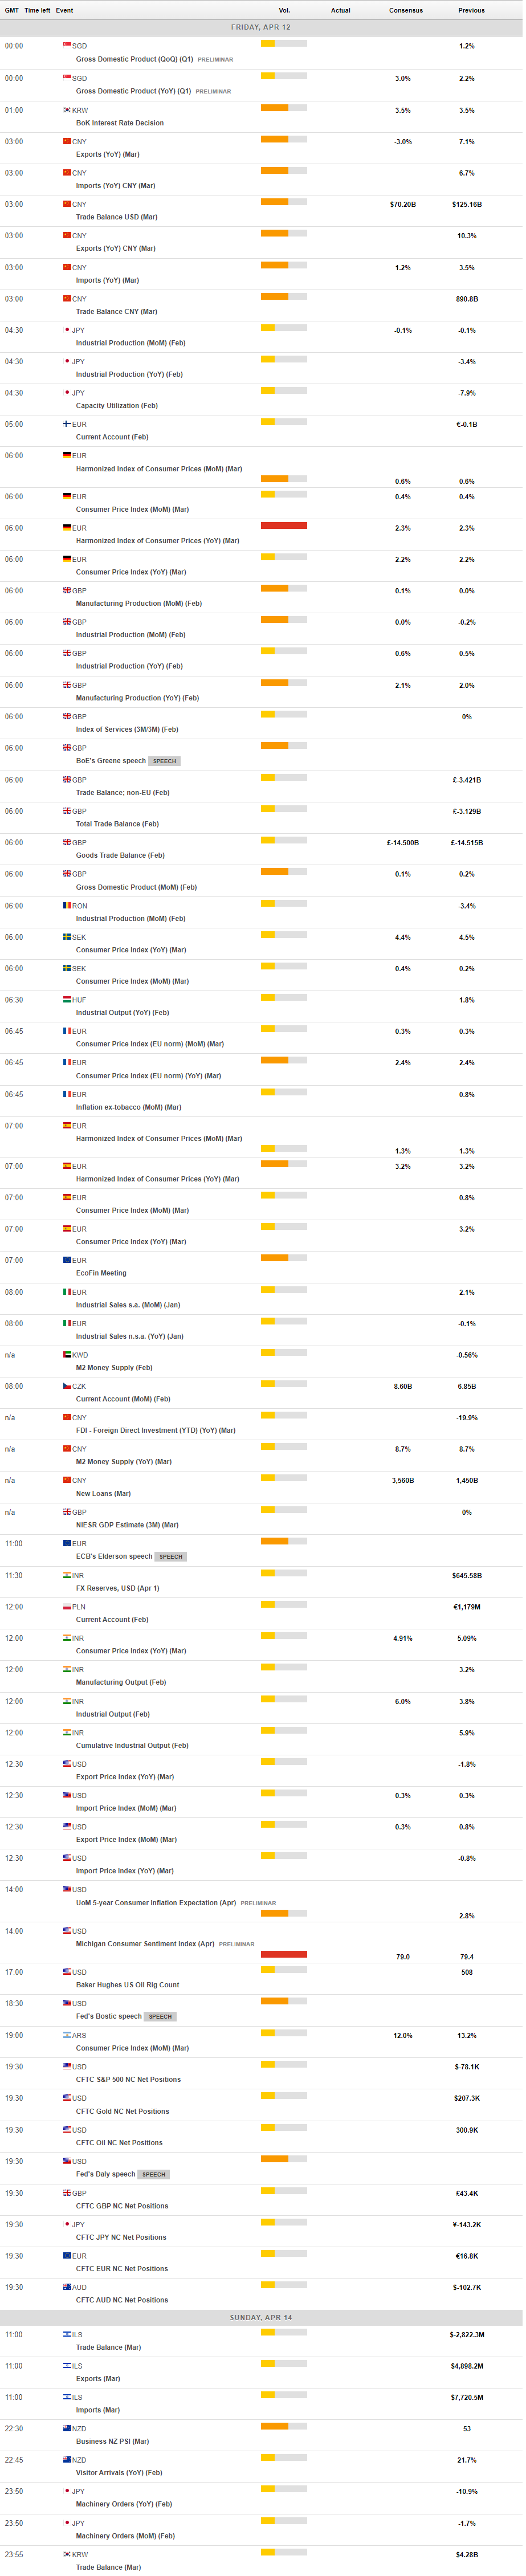
MACROECONOMIC EVENTS
All Information & Updates provided by:

All information relating to the financial markets available on this page has been prepared and issued by FXStreet (Forexstreet SL, Spain, Reg: B62498233) on the basis of publicly available information and all information believed to be reliable and does not conflict with Kuwaiti local laws, and all necessary care has been taken to before the company to ensure that the facts mentioned are correct from the source.
NCM Investment nor any of its directors or employees shall in any way be held responsible for the contents of this news, and the information contained on this page is intended only to provide clients with publicly available information and should not be construed as investment advice, report or analysis and/or constitute an offer or invitation to buy or sell financial instruments of any kind.
RISK WARNING: Forex and CFDs are highly risky leveraged products, as losses can exceed deposits. Please ensure you understand all the risks and take independent advice if necessary. NCM will segregate the clients based on the criteria of the regulator and its bylaws. NCM does not provide any advisory service; the material published does not constitute advice or a recommendation for a transaction in any financial instrument. NCM accepts no responsibility for any use of the content presented and any consequences of that use. Anyone acting on the information provided does so at their own risk.