
- Contact Us:
-

-

-

-


Daily Market Updates
15 Apr 2024
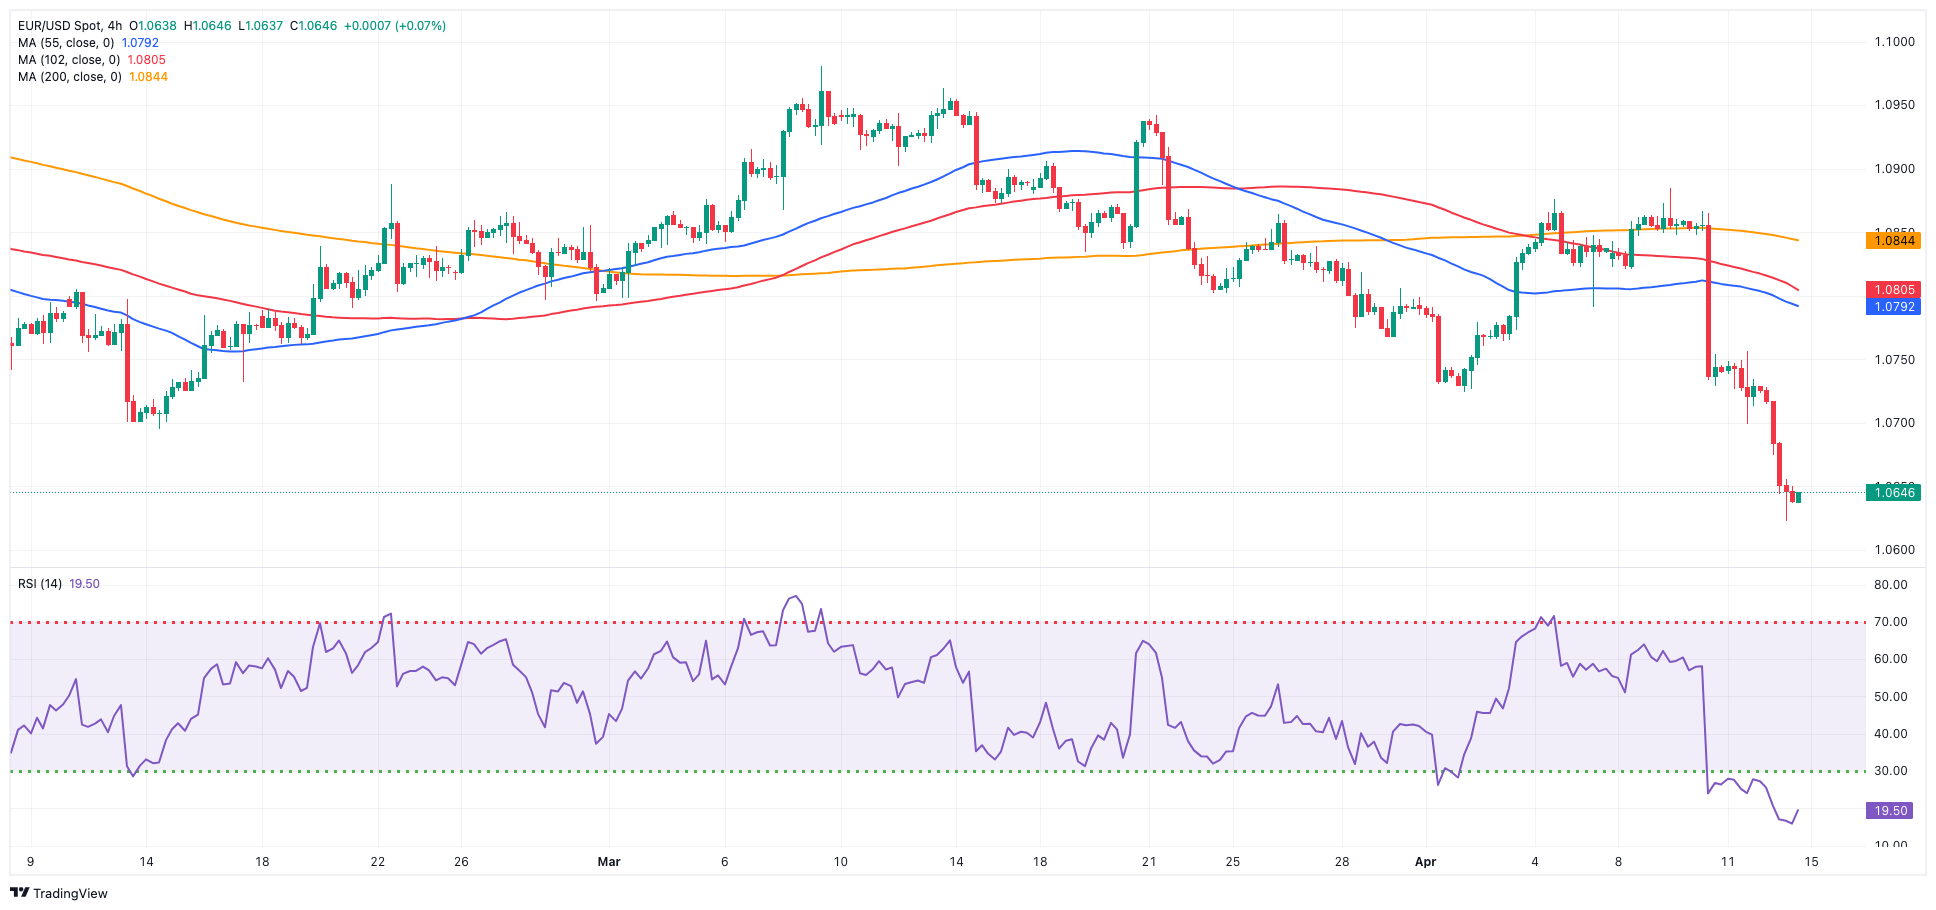
EURUSD
The selling pressure in risk-related assets gathered extra pace on Friday, sending EUR/USD to the 1.0620 region for the first time since early November.
Contrasting with the above, the Greenback rose to multi-month tops north of the 106.00 barrier when tracked by the USD Index (DXY) on the back of rising monetary policy divergence between central banks and despite a knee-jerk in US yields across the curve.
Indeed, while the ECB hinted at the likelihood of an interest rate cut at its June gathering, investors seem to have started to price in the start of the Fed’s easing cycle at some point in Q4 (December?). The latter was particularly exacerbated after a higher-than-expected US CPI in March and has also been reinforced by hawkish Fedspeak.
On the latter, J. Schmid (Kansas City) argued earlier in the session that inflation remains too elevated for the Fed to start thinking about cutting rates. Somewhat in line with this view, R. Bostic (Atlanta) advocated for just one rate cut and to occur by year end.
Back to the euro docket, the final Inflation Rate in Germany saw the CPI rise by 2.2% in the year to March and 0.4% vs. the previous month.
In the US, preliminary Michigan Consumer Sentiment eased to 77.9 in April.
Extra losses in the EUR/USD might test the 2024 low of 1.0622 (April 12). A deeper drop could reveal the weekly low of 1.0495 (October 13, 2023), prior to the 2023 low of 1.0448 (October 3) and the round milestone of 1.0400. In contrast, immediate resistance is located at the crucial 200-day SMA of 1.0829, which precedes the weekly peak of 1.0885 (April 9) and the March high of 1.0981 (March 8). Up from here comes the weekly top of 1.0998 (January 5, 2011), just before the psychological 1.1000 mark. The breakout of this zone may put pressure on the December 2023 peak of 1.1139 (December 27), which is still supported by the 200-week SMA of 1.1141 and aligns before the 2023 high of 1.1275 (July 18). The daily RSI sank to the 30 region, flirting with the oversold region.
Resistance levels: 1.0756 1.0843 1.0885 (4H chart)
Support levels: 1.0622 1.0516 1.0495 (4H chart)
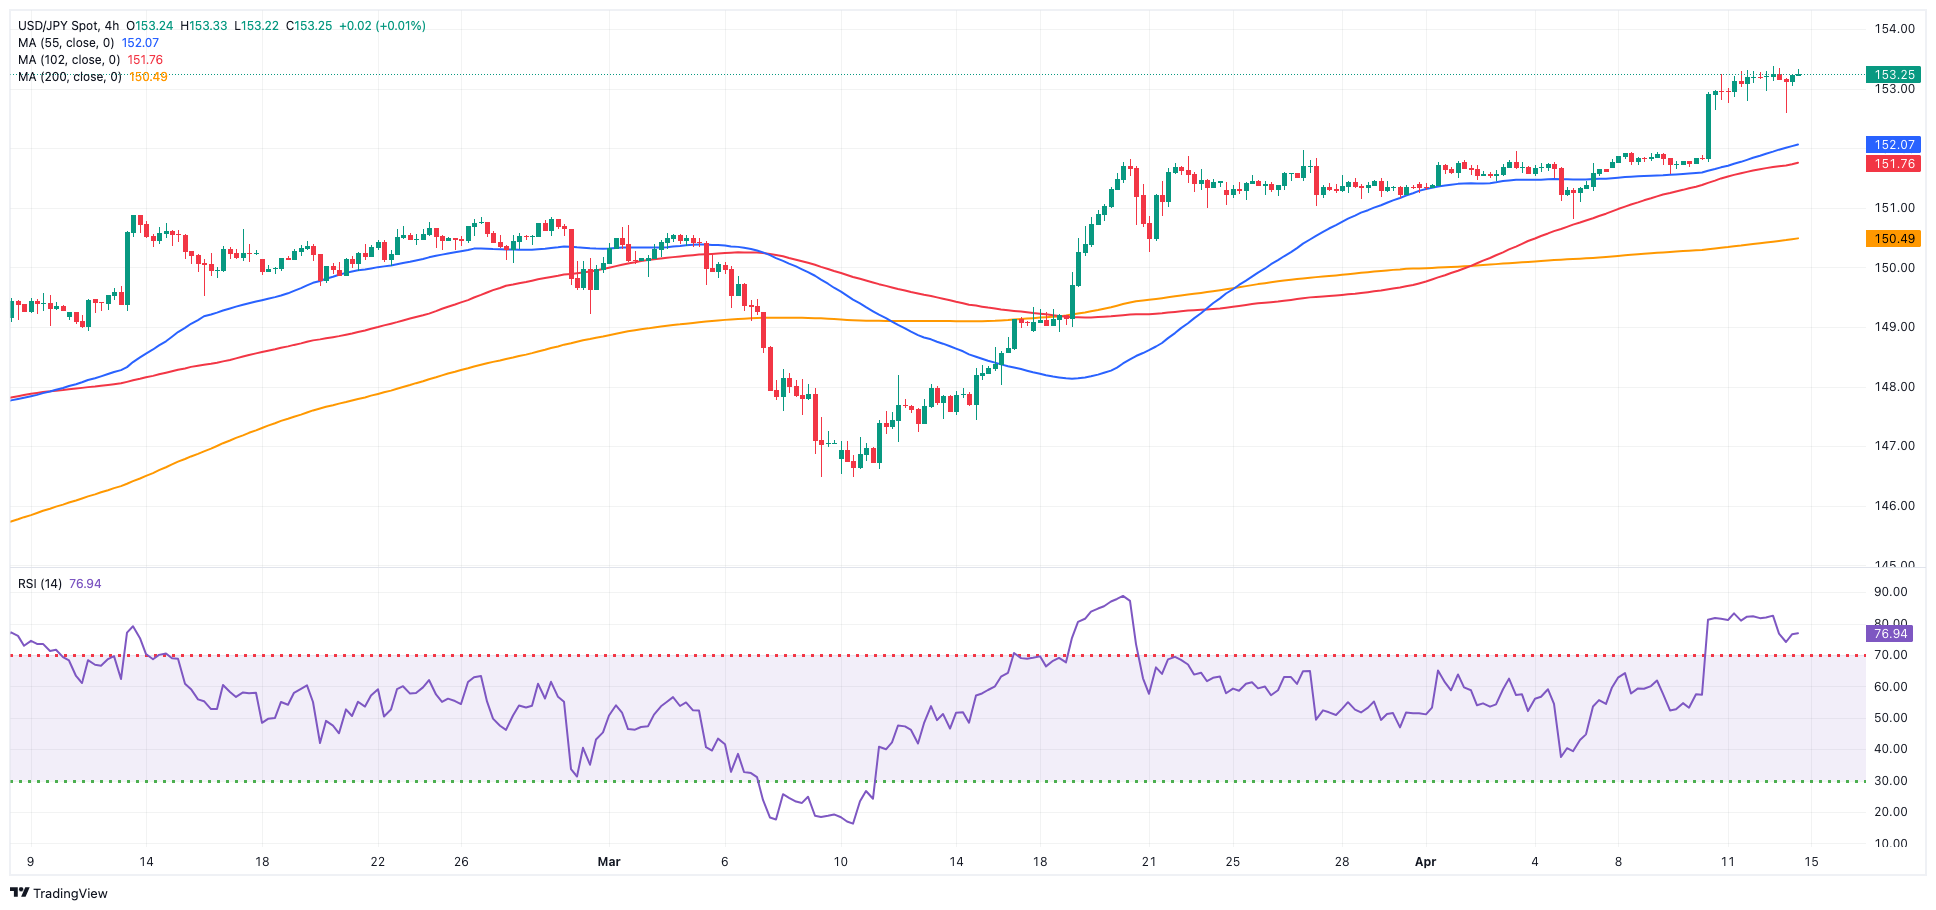
USDJPY
Another irresolute session saw USD/JPY rise to a new 34-year tops near 153.40, just to hover around that area until the end of Friday’s session.
The unabated rally in the greenback was behind the move in the pair along with the corrective decline in US yields across various timeframes, a move that was mirrored by JGB 10-year yields, which left behind two straight sessions of gains.
Concerning the possibility of intervention, it is worth recalling that Japan’s Kanda emphasized that authorities are consistently prepared for any scenario, whether it entails currency intervention or not. Furthermore, finmin Suzuki indicated that officials are vigilantly monitoring currency fluctuations "with a profound sense of urgency."
In the Japanese calendar, final readings saw Industrial Production contract by 3.9% in the year to February.
The next up-barrier for USD/JPY emerges at the 2024 high of 153.38 (April 12), prior to the June 1990 top of 155.80. Instead, the pair is expected to find initial support at the April low of 150.80 (April 5), while the 55-day and 100-day SMAs of 150.01 and 147.87, respectively, are expected to offer interim contention. Down from here emerges the crucial 200-day SMA of 147.26 ahead of the March low of 146.47 (March 8). A breakdown of this zone might lead to a return to the February low of 145.89 (February 1), which comes before the December 2023 low of 140.24 (December 28), the round number 140.00, and the July low of 137.23 (July 14). The daily RSI eased a tad to around 72, indicating that the pair is overbought.
Resistance levels: 153.38 155.80 155.88 (4H chart)
Support levels: 152.58 151.56 150.80 150.26 (4H chart)
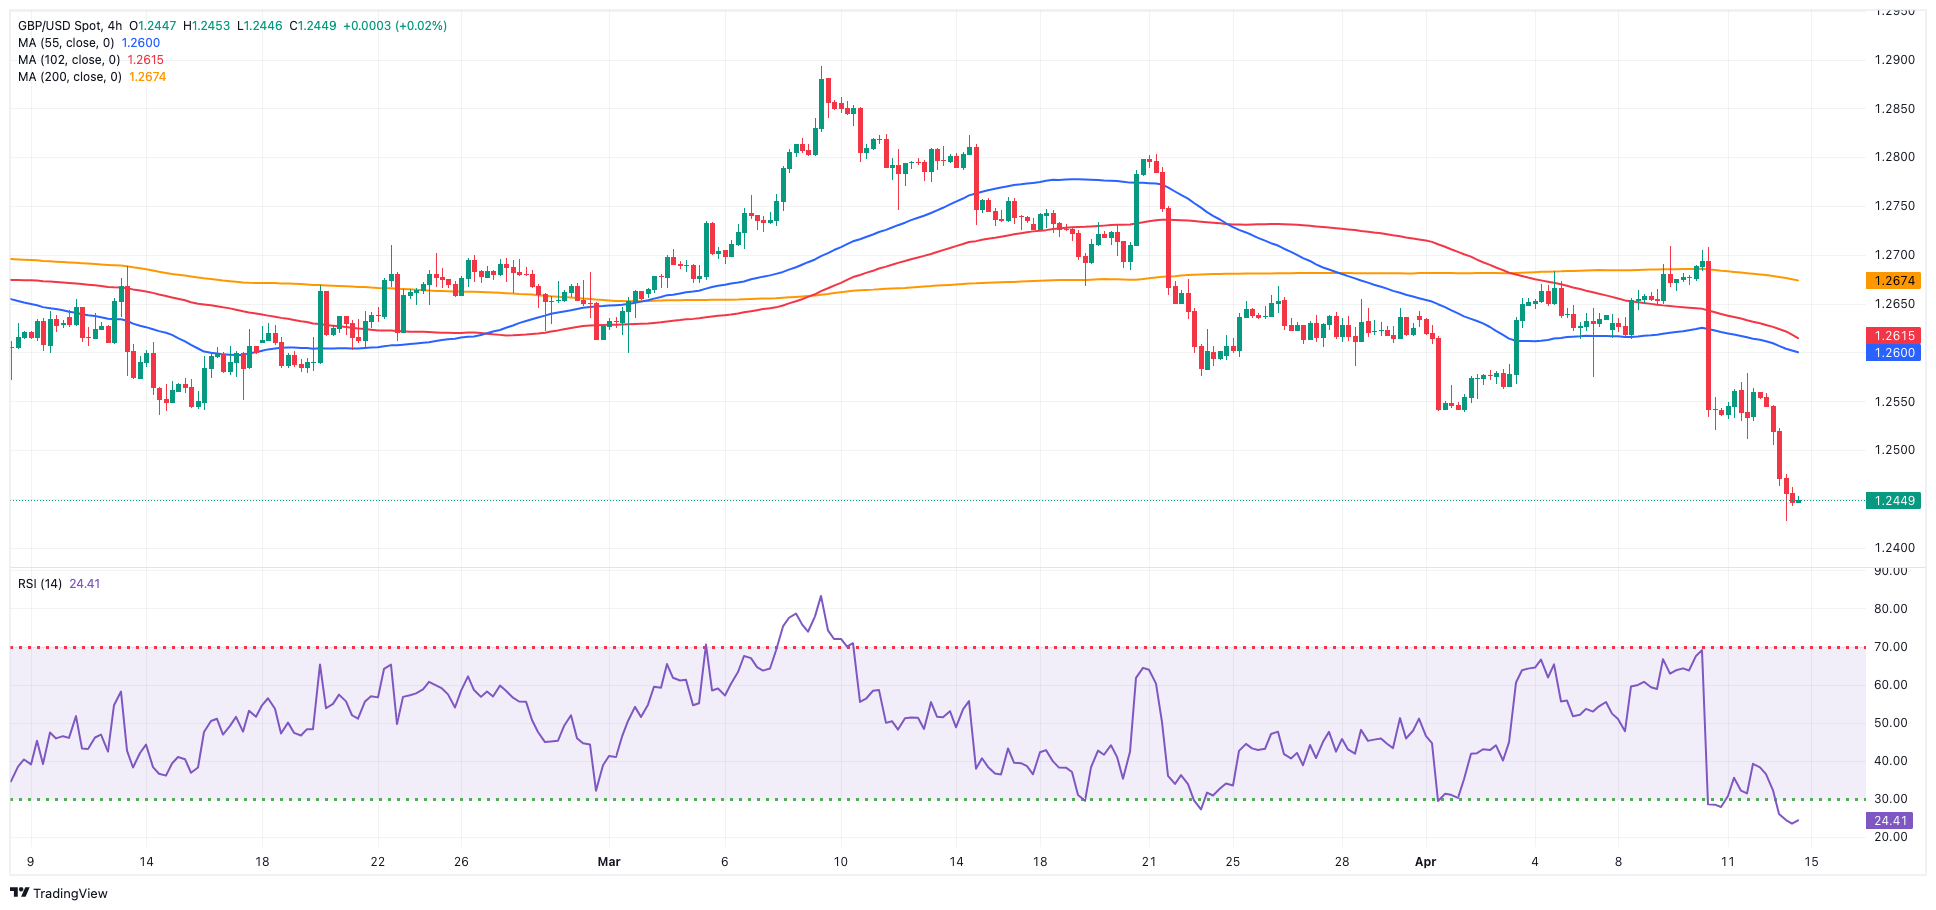
GBPUSD
Following the collapse of the risk-linked galaxy, the British pound resumed its downtrend and forced GBP/USD to retreat to five-month lows in the 1.2430–1.2425 band at the end of the week.
The intense move higher in the Greenback pushed the USD Index (DXY) to new highs on the back of rising speculation that the Fed might start reducing its interest rates later in the year (probably in December).
Around the UK bond market, the marked pullback in Cable came in tandem with the drop in 10-year gilt yields after two consecutive daily gains.
A busy day across the Channel data-wise saw the GDP 3-Month Average expand by 0.2% in February, while the annualized GDP contracted by 0.2% in the same month. In addition, the trade deficit widened to £14.21B in February, while Construction Output dropped by 2.0% from a year earlier, Industrial production increased by 1.4% YoY, and Manufacturing Production rose by 2.7% over the last twelve months. Finally, the NIESR Monthly GDP Tracker rose by 0.4% in March.
Immediately to the downside for GBP/USD now comes the 2024 low of 1.2426 (April 12). A deeper drop would not find significant support until the weekly low of 1.2187 (November 10, 2023), which comes before the October 2023 low of 1.2037 and the main 1.2000 contention zone. On the other hand, the initial upward barrier is the key 200-day SMA of 1.2583 ahead of the April high of 1.2709 (April 9), followed by the weekly top of 1.2803 (March 21) and the 2024 peak of 1.2893 (March 8). Further north, the weekly high of 1.2995 (July 27, 2023) is just above the key 1.3000 mark. On the daily chart, the RSI plummeted below 33.
Resistance levels: 1.2578 1.2674 1.2709 (4H chart)
Support levels: 1.2426 1.2373 1.2187 (4H chart)
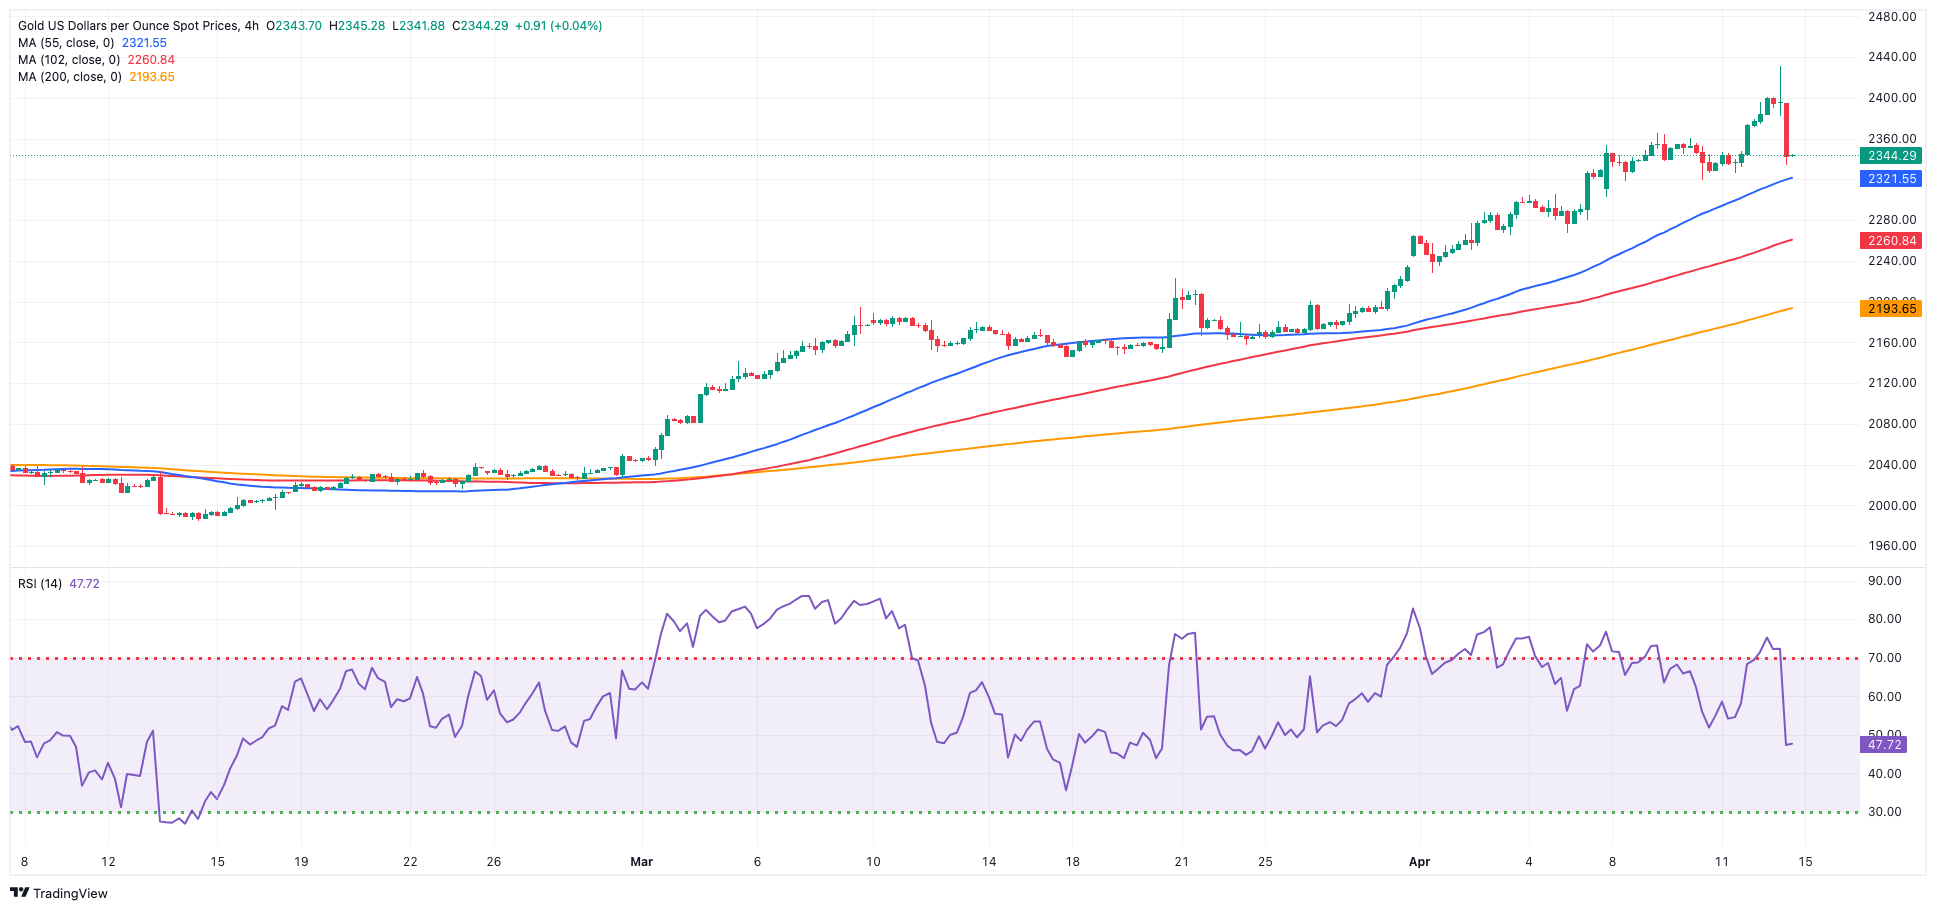
GOLD
Increasing geopolitical tensions favoured investors’ preference for the safe haven space, motivating Gold prices to climb to an all-time high past the $2,400 mark per troy ounce on Friday.
The move, however, fizzled out as Friday’s session drew to a close on the back of the intense buying interest in the US dollar, despite US yields giving away part of the recent strong gains.
Looking at the weekly chart, the precious metal closed its fourth consecutive week of gains.
Gold faces immediate resistance at its all-time high of $2,431 (April 12). On the contrary, the weekly low of $2,146 (March 18) is first, followed by the preliminary 55-day and 100-day SMAs of $2,129 and $2,085, respectively, all before the more significant 200-day SMA of $2,008. Moving south, the 2024 low of $1,984 (February 14) is followed by the lows of December 2023 at $1,973 (December 13) and November 2023 at $1,931(November 13). The failure in this location may cause the metal to test its October 2023 bottom of $1,810 (October 6), followed by the 2023 bottom of $1,804 (February 28) and the important $1,800 conflict zone.
Resistance levels: $2,431 (4H chart)
Support levels: $2,319 $2,267 $2,228 (4H chart)
CRUDE WTI
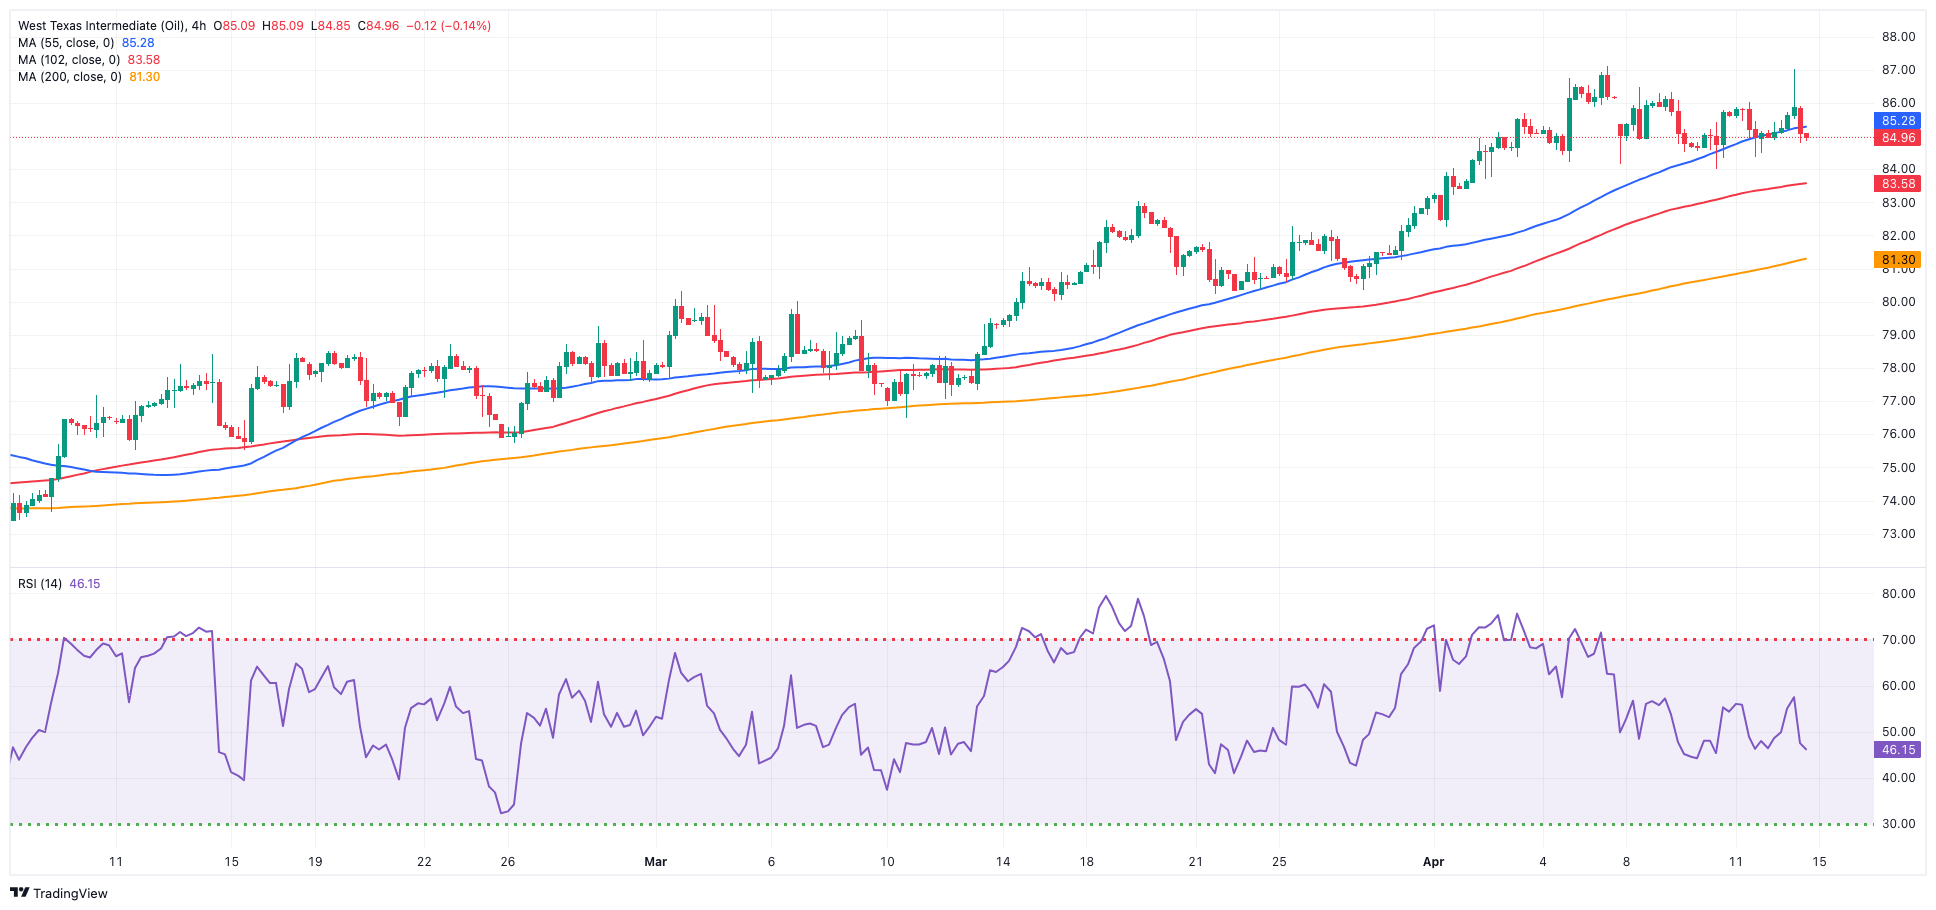
On Friday, oil prices faded the initial uptick to fresh 2024 highs beyond the $87.00 mark per barrel and ended the day marginally lower amidst increasing geopolitical tensions in the Middle East.
Weighing on the commodity, however, emerged a pessimistic global oil demand growth projection from the IEA in its monthly report and concerns regarding the pace of US interest rate reductions.
On the calendar, the US total active oil rigs went down by 2 to 506 in the week to April 12, according to driller Baker Hughes.
The next upward challenge for WTI is the 2024 peak of $87.60 (April 12), which precedes the weekly high of $89.83 (October 18, 2023) and the 2023 top of $94.99 (September 28, 2023). Further north, the weekly peak of $97.65 (August 30) falls just short of the psychological $100.00 threshold. On the flip side, the immediate downside hurdle is the weekly low of $80.33 (March 21), followed by the 200-day SMA of $79.56 and the February low of $71.43 (February 5). The breach of this zone might bring the critical $70.00 barrier back into view before the 2024 low of $69.31 (January 3) and the December 2023 low of $67.74 (December 13).
Resistance levels: $87.60 $89.82 $94.99 (4H chart)
Support levels: $84.52 $82.58 $80.51 (4H chart)
GER40
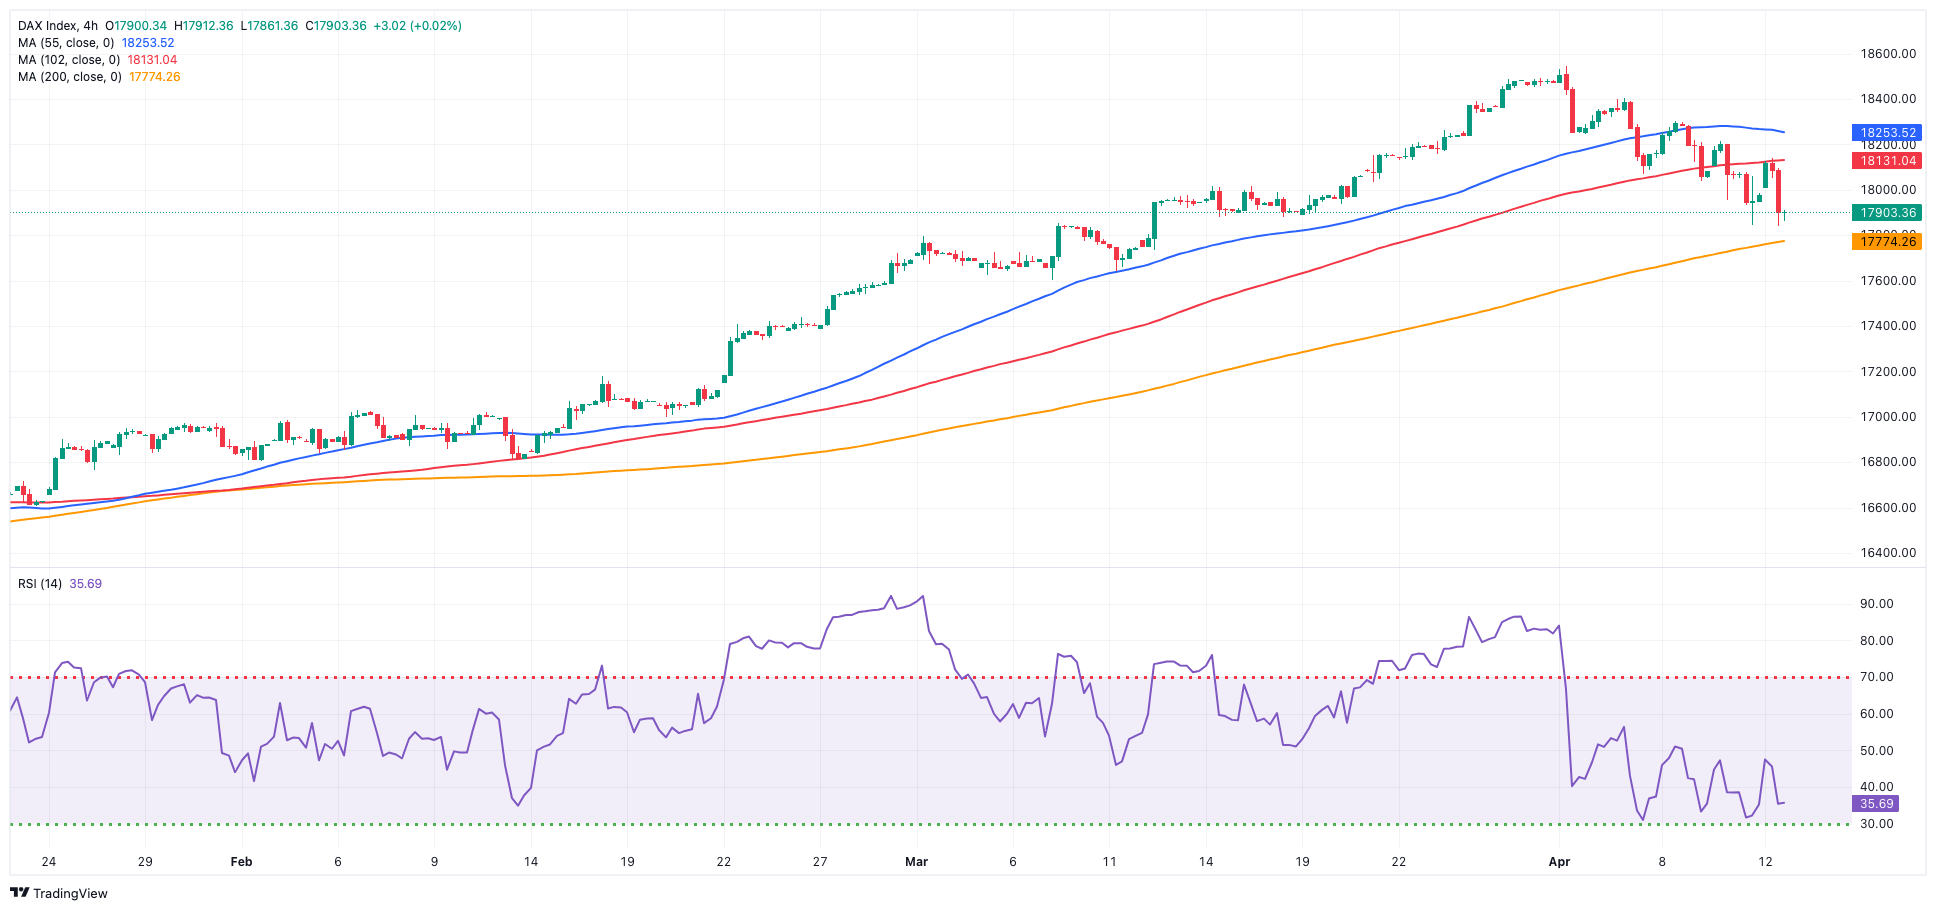
German stocks represented by the DAX40 renewed their four-week lows after breaking through the contention zone around 18,000 once again on Friday.
The continuation of the downward trend in the DAX40 occurred in the context of dominating risk-off sentiment in response to persistent geopolitical tensions involving Israel and Iran.
In addition, investors continued to digest the ECB’s potential interest rate cut in June, as suggested at the bank’s event on Thursday.
In the German money market, 10-year bund yields left behind two daily advances in a row and dropped to the vicinity of 2.30%.
The loss of the April low of 17,860 (April 12) may prompt the DAX40 to dispute the March bottom of 17,619 (March 7), which appears to be supported by the provisional 55-day SMA of 17,603. The breach of this region might bring the February low of 16,821 (February 1) back into focus, ahead of the critical 200-day SMA of 16,365 and the 2024 bottom of 16,345 (January 17). After dropping below the latter, the weekly low of 15,915 (November 28) might be tested, seconded by the October low of 14,630 (October 23) and the 2023 bottom of 14,458 (March 20). Conversely, the next point of resistance is the record high of 18,567 (April 2). The daily RSI decreased below the 47 level.
Best Performers: RWE AG ST, Rheinmetall AG, MTU Aero
Worst Performers: Sartorius AG VZO, Dr Ing hc F Porsche Prf, Infineon
Resistance levels: 18,196 18,427 18,567 (4H chart)
Support levels: 17,860 17,619 17,432 (4H chart)
GBPJPY
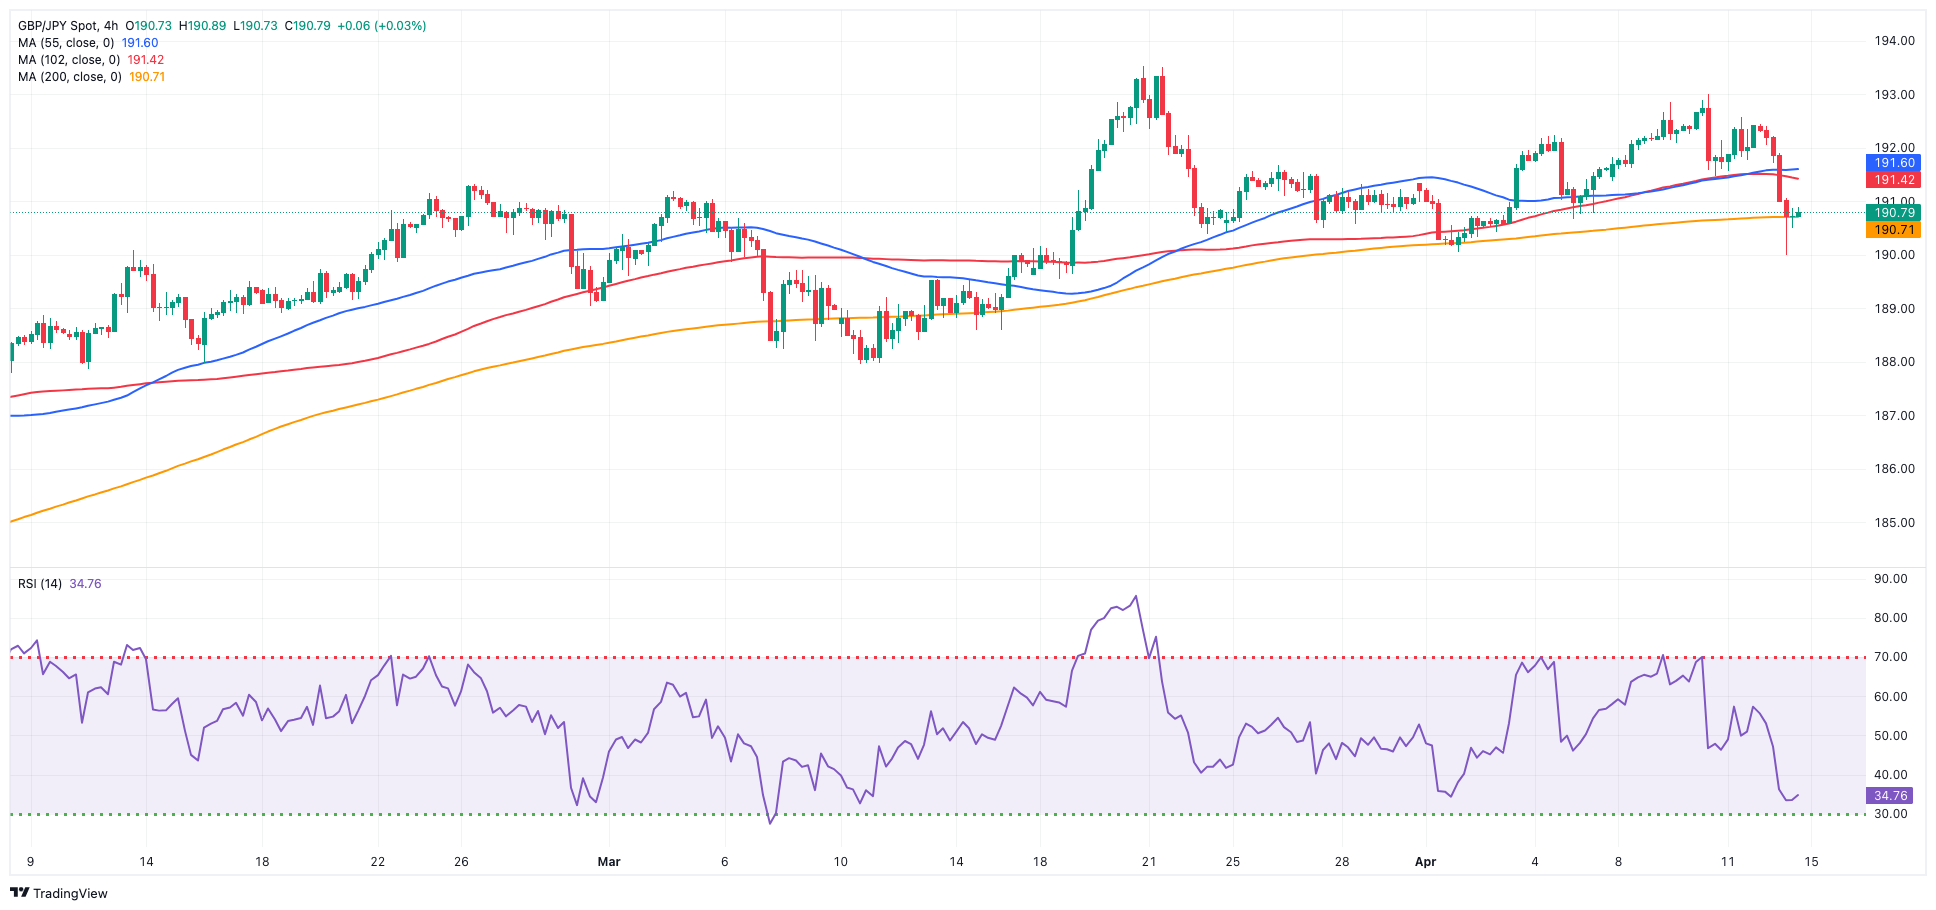
The significant pullback in the British pound caused GBP/JPY to decline to levels as low as the 190.00 neighbourhood on Friday, aligning with the provisional 55-day SMA. This region has shown initial signs of contention thus far.
Once again, the sharp advance in the dollar kept the risky assets well on the defensive, while the vacillating trade in the Japanese yen also accompanied the marked losses in the cross at the end of the week.
Meanwhile, downward movements in the cross appear to be limited around the 190.00 zone, while yearly highs in the mid-193.00s are impeding any immediate upward momentum.
If GBP/JPY breaks below the April low of 189.99 (April 12), it could then challenge the March low of 187.96 (March 11), before the intermediate 100-day SMA of 187.41, and the February low of 185.22 (February 1), which is still supported by the proximity of the critical 200-day SMA of 185.32 and comes ahead of the December 2023 bottom of 178.33 (December 14). In the opposite direction, initial resistance comes at the April peak of 192.97 (April 10), before reaching the 2024 high of 193.53 (March 20). The breakout of this level could reveal the August 2015 top of 195.28 (August 18), followed by the record peak of 195.88 (June 24, 2015). The everyday RSI collapsed to around 48.
Resistance levels: 192.97 193.53 195.28 (4H chart)
Support levels: 189.99 189.54 187.96 (4H chart)
NASDAQ
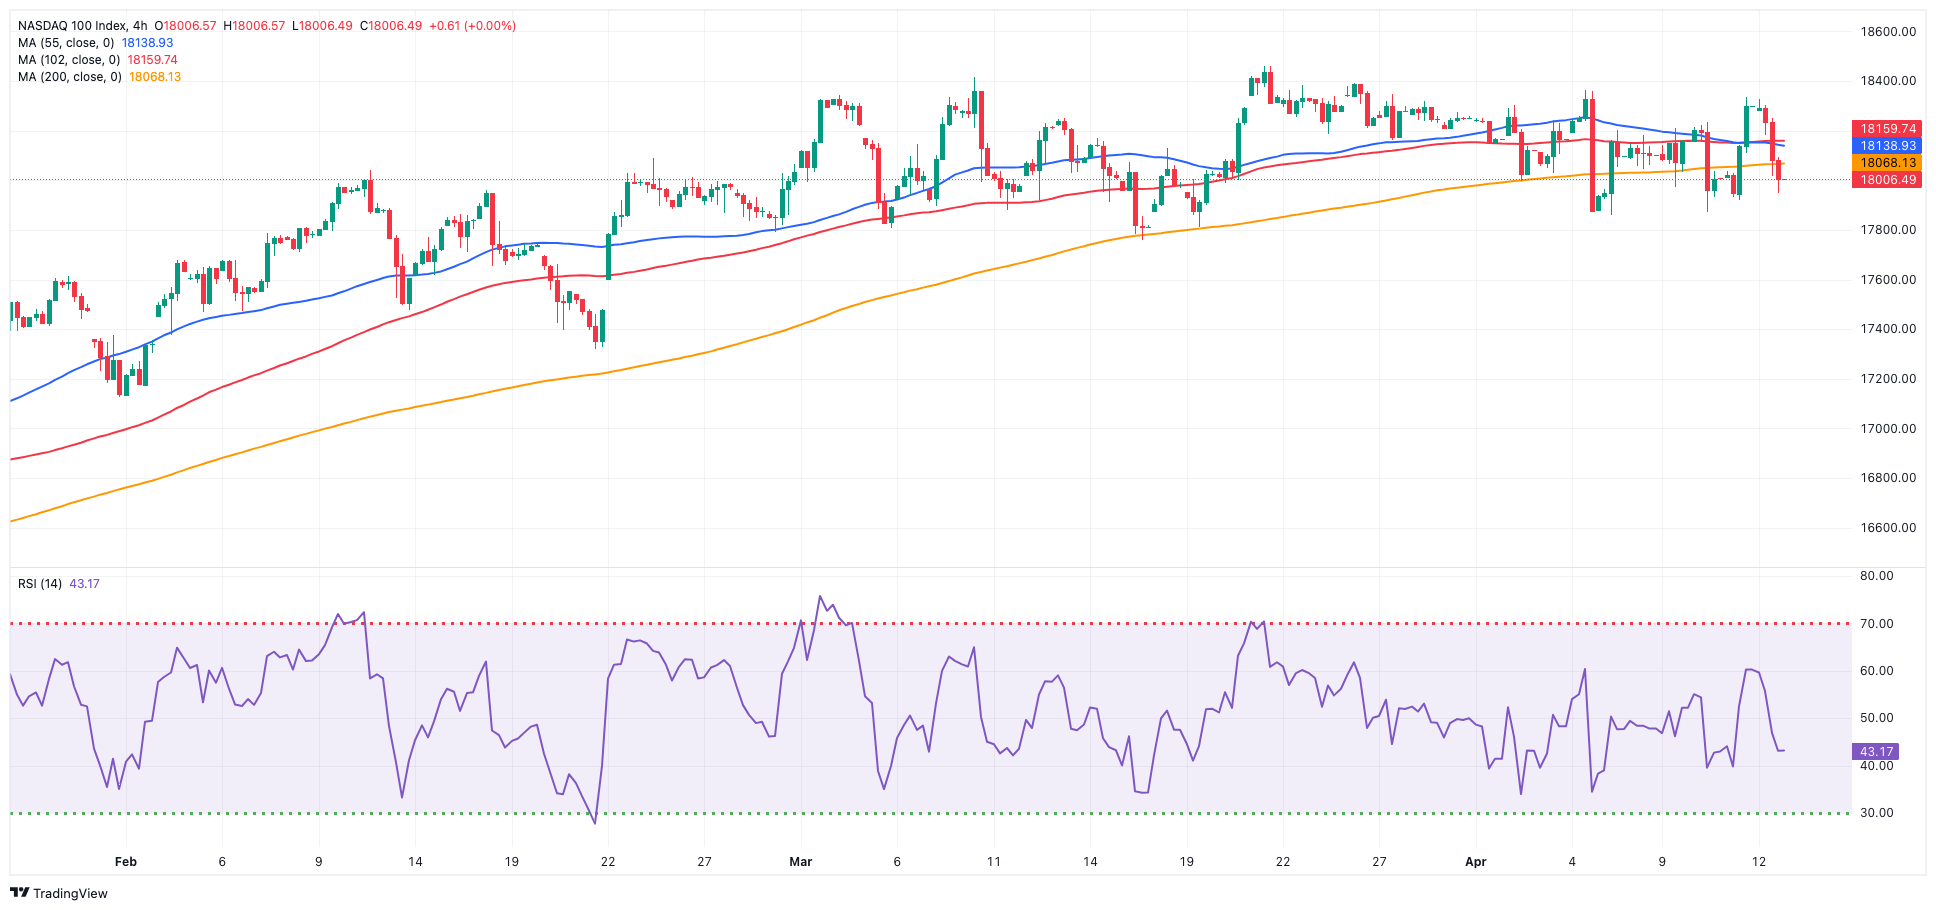
Prevailing risk aversion among market participants, in combination with the unabated rally in the greenback, sponsored a marked retracement in the tech reference Nasdaq 100 at the end of the week.
Friday’s increased flight-to-safety sentiment was underpinned by rising geopolitical concerns stemming from the Middle East, while prospects for a tighter-for-longer Fed’s stance also contributed to the sour mood.
In case bulls regain the upper hand, the Nasdaq 100 could revisit its all-time high of 18,464 (March 21). The other way around, the index is anticipated to find immediate support near its April low of 17,875, seconded by weekly lows of 17,319 (February 21) and 17,128 (January 31). If the latter is broken, a challenge to the 2024 bottom of 16,249 (January 5) may emerge, ahead of the crucial 200-day SMA of 16,207 and the December 2023 low of 15,695 (December 4). Additional losses from here might return to the October 2023 level of 14,058 (October 26), before the April 2023 low of 12,724 (April 25) and the March 2023 low of 11,695 (March 13). The daily RSI dropped to around 48.
Top Gainers: Apple, Fastenal, Old Dominion Freight Line
Top Losers: ON Semiconductor, Intel, PDD Holdings DRC
Resistance levels: 18,337 18,464 (4H chart)
Support levels: 17,875 17,764 17,319 (4H chart)
DOW JONES
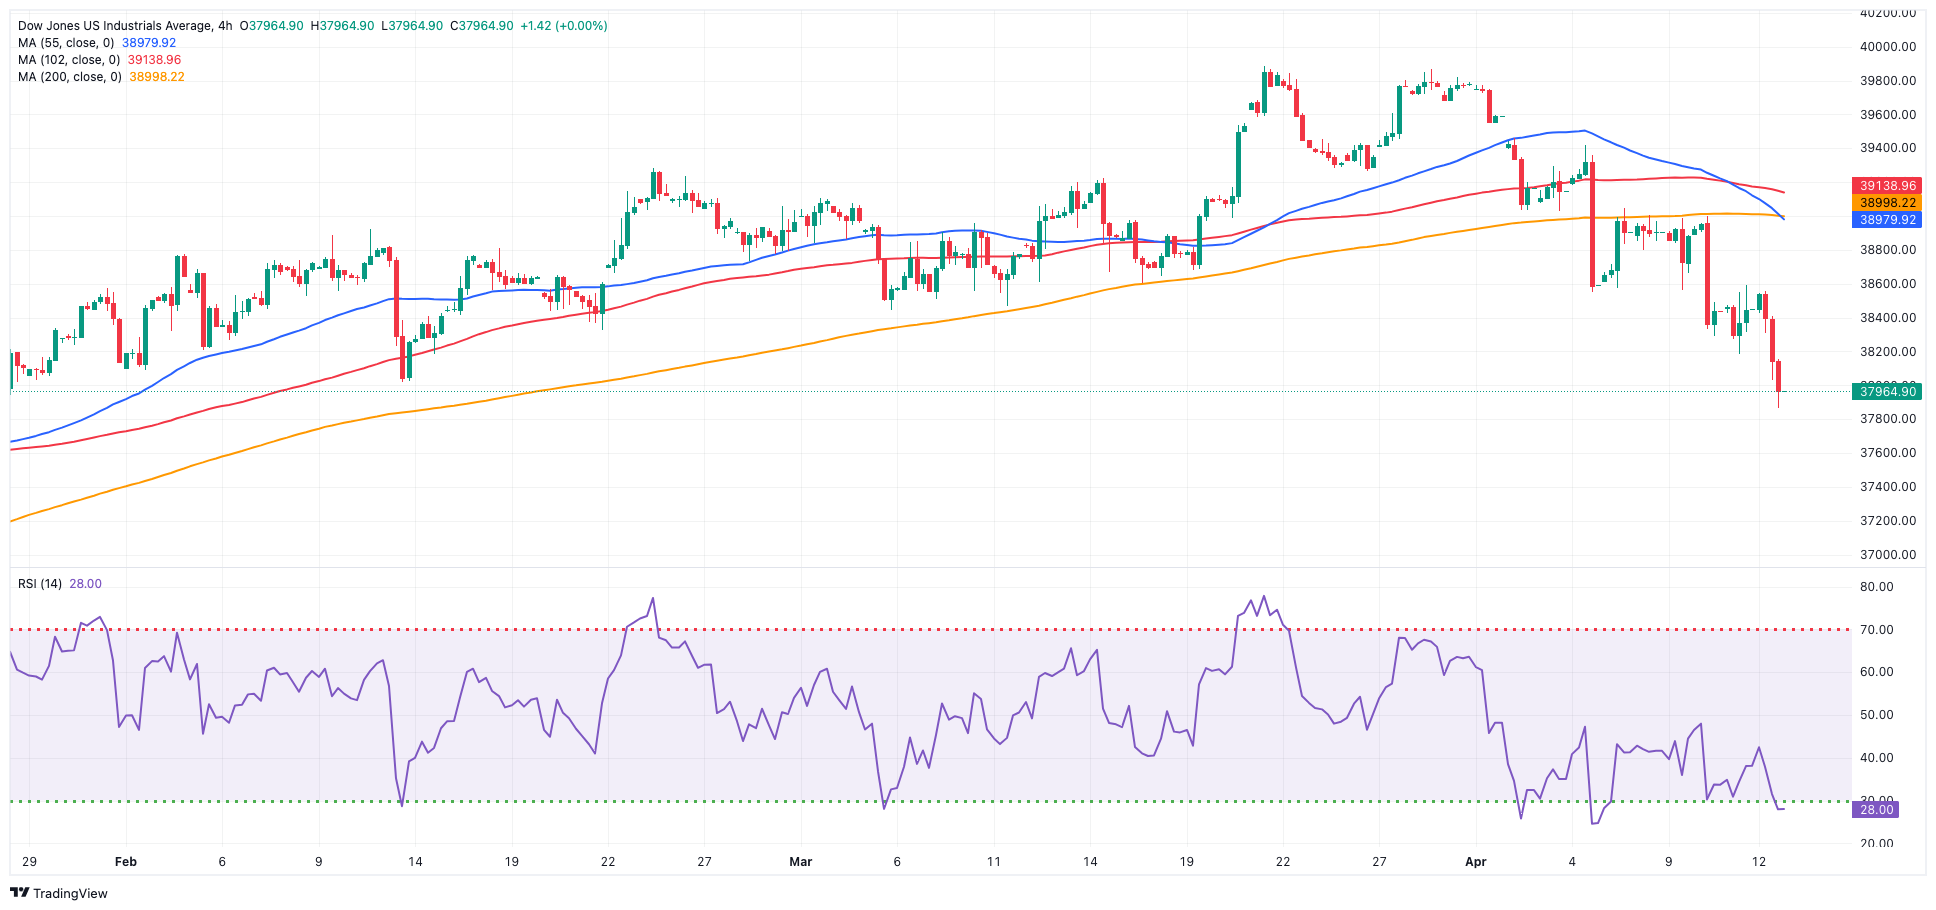
The US benchmark Dow Jones saw a significant decline on Friday, marking its second consecutive week of losses and simultaneously breaking below the 38,000 support level.
The fifth consecutive daily pullback in the index came on the back of mixed results from major US banks, concluding a week characterized by influential inflation data (CPI and PPI), shifting expectations regarding the Fed’s monetary policy outlook, and looming geopolitical tensions.
Back to the Fed, J. Schmid from Kansas City contended earlier in the session that inflation levels are still too high for the Fed to consider initiating rate cuts. In a similar vein, R. Bostic from Atlanta advocated for only one rate cut, suggesting it should take place by the end of the year.
At the end of the week, the Dow Jones deflated 1.45% to 37,901, the S&P 500 dropped 1.68% to 5,110, and the tech-centric Nasdaq Composite retreated 1.80% to 16,146.
If the selling pressure persists, the Dow Jones might challenge the 2024 low of 37,122 (January 18), prior to the crucial 200-day SMA at 36,124. The weekly low of 33,859 (November 7, 2023) comes next, followed by the October 2023 low of 32,327 (October 27), all before the 2023 bottom of 31,429 (March 15). Having said that, the next upward hurdle is the interim 55-day SMA of 38,829 ahead of the record high of 39,889 (March 21). The daily RSI receded to the sub-34 area.
Top Performers: Apple, Travelers, Visa A
Worst Performers: JPMorgan, Intel, Walt Disney
Resistance levels: 38,888 39,421 39,889 (4H chart)
Support levels: 37,877 37,122 36,010 (4H chart)
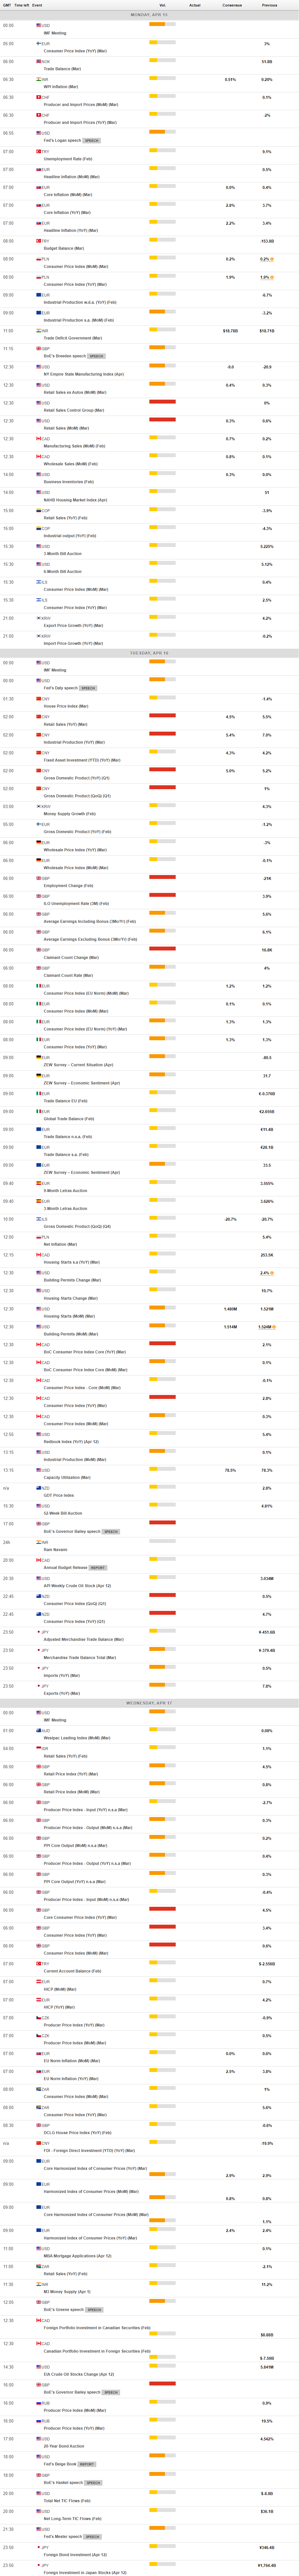
MACROECONOMIC EVENTS
All Information & Updates provided by:

All information relating to the financial markets available on this page has been prepared and issued by FXStreet (Forexstreet SL, Spain, Reg: B62498233) on the basis of publicly available information and all information believed to be reliable and does not conflict with Kuwaiti local laws, and all necessary care has been taken to before the company to ensure that the facts mentioned are correct from the source.
NCM Investment nor any of its directors or employees shall in any way be held responsible for the contents of this news, and the information contained on this page is intended only to provide clients with publicly available information and should not be construed as investment advice, report or analysis and/or constitute an offer or invitation to buy or sell financial instruments of any kind.
RISK WARNING: Forex and CFDs are highly risky leveraged products, as losses can exceed deposits. Please ensure you understand all the risks and take independent advice if necessary. NCM will segregate the clients based on the criteria of the regulator and its bylaws. NCM does not provide any advisory service; the material published does not constitute advice or a recommendation for a transaction in any financial instrument. NCM accepts no responsibility for any use of the content presented and any consequences of that use. Anyone acting on the information provided does so at their own risk.