
- Contact Us:
-

-

-

-


Daily Market Updates
16 Apr 2024
EURUSD
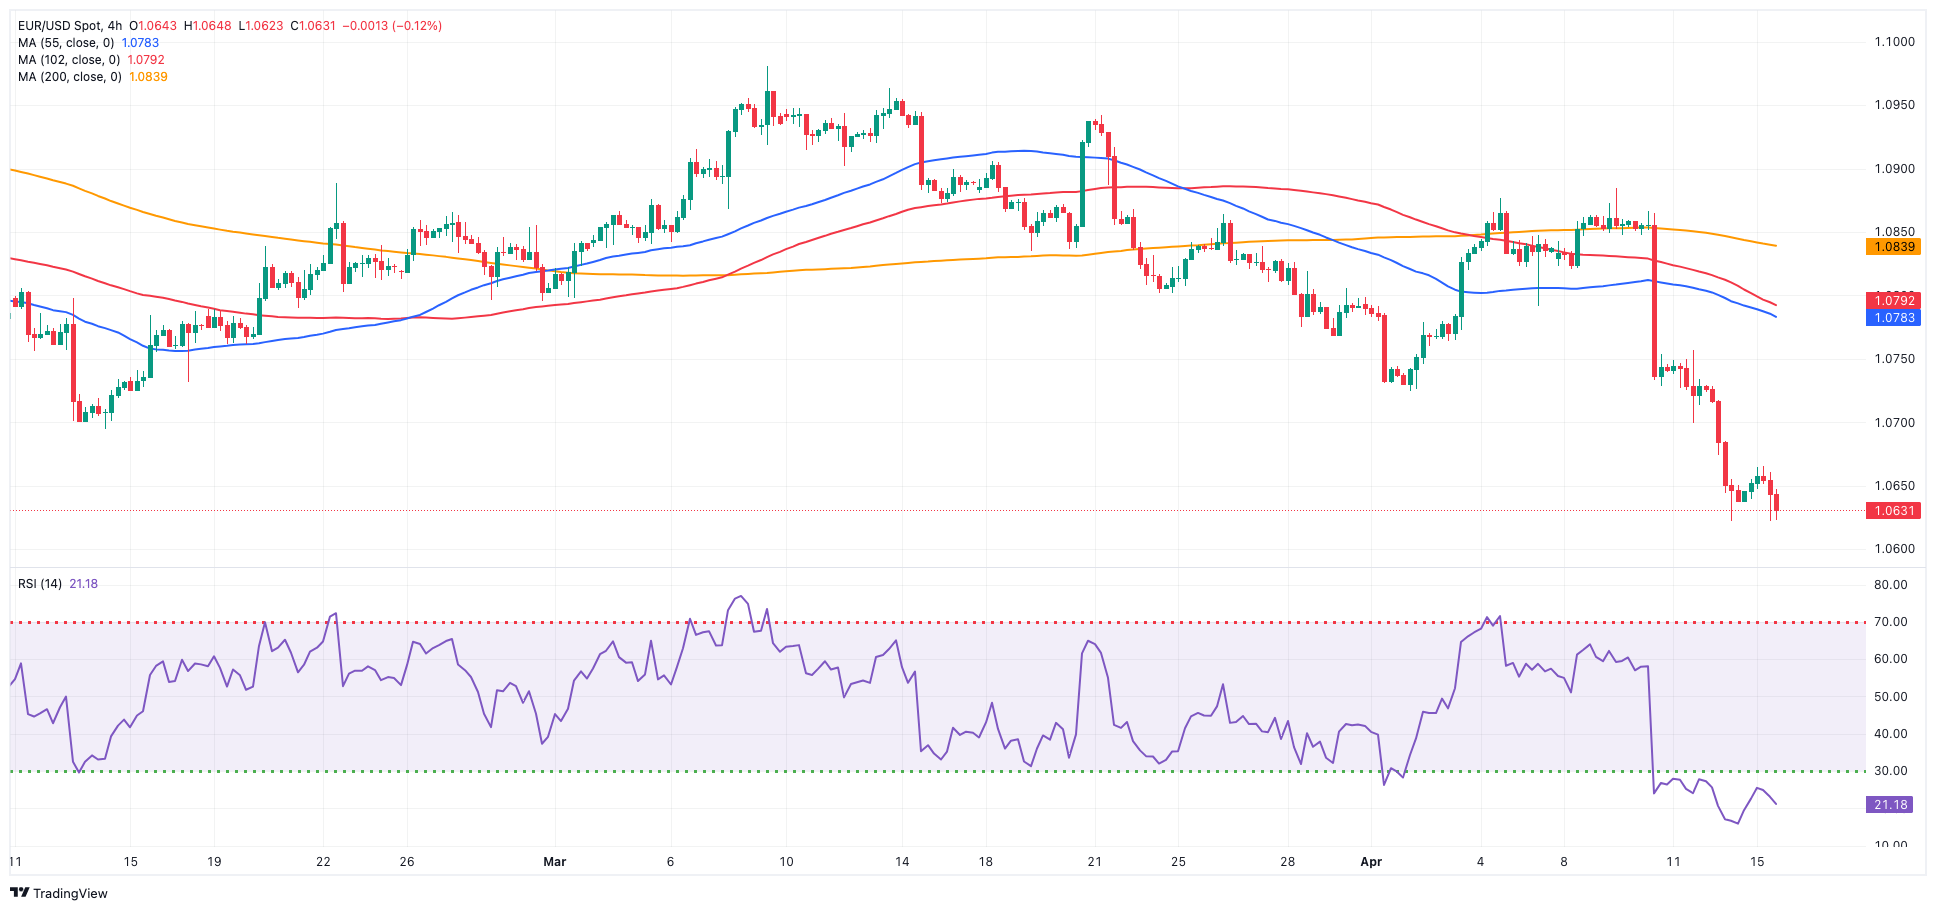
On Monday, the flattish tone dominated the broad sentiment in the FX galaxy, prompting EUR/USD to hover around the 1.0630 zone with a slight bearish bias.
By the same token, the greenback traded with decent gains and rose to its highest levels in several months, reaching the 106.20-106.25 band as indicated by the USD Index (DXY). This uptrend was driven by increasing divergence in monetary policies among central banks and was accompanied by the resumption of the uptrend in US yields across the yield curve.
While the European Central Bank (ECB) hinted at the possibility of implementing an interest rate cut at its June meeting, investors appear to be pricing in the onset of the Fed’s easing cycle sometime in the fourth quarter, possibly December. This expectation was further amplified following the release of higher-than-anticipated US Consumer Price Index (CPI) data in March and has been supported by hawkish statements from Fed rate-setters.
On the latter, J. Williams (New York) argued that he does not see the latest inflation readings as a turning point.
Around the ECB, Board member Simkus suggested a probable rate cut in July following the first one in June.
On the euro calendar, Industrial Production in the euro area contracted by 6.4% in the year to February. In the US, Retail Sales expanded by 0.7% MoM in March, Business Inventories rose by 0.4% in February from a month earlier and the NAHB Housing Market Index held steady at 51 in April.
Extra losses in the EUR/USD might test the 2024 bottom of 1.0621 (April 15). A deeper slide might disclose a weekly low of 1.0495 (October 13, 2023), which precedes the 2023 low of 1.0448 (October 3) and the round milestone of 1.0400. In contrast, immediate resistance is found at the critical 200-day SMA of 1.0827, which precedes the weekly peak of 1.0885 (April 9) and the March high of 1.0981 (March 8). Up from here comes the weekly top of 1.0998 (January 5, 2011), just before the crucial 1.1000 threshold. The breakout of this zone might put pressure on the December 2023 peak of 1.1139 (December 27), which is still supported by the 200-week SMA of 1.1138 and aligns before the 2023 high of 1.1275 (July 18). The daily RSI broke below the 30 yardstick, entering the oversold region.
Resistance levels: 1.0756 1.0838 1.0885 (4H chart)
Support levels: 1.0621 1.0516 1.0495 (4H chart)
USDJPY
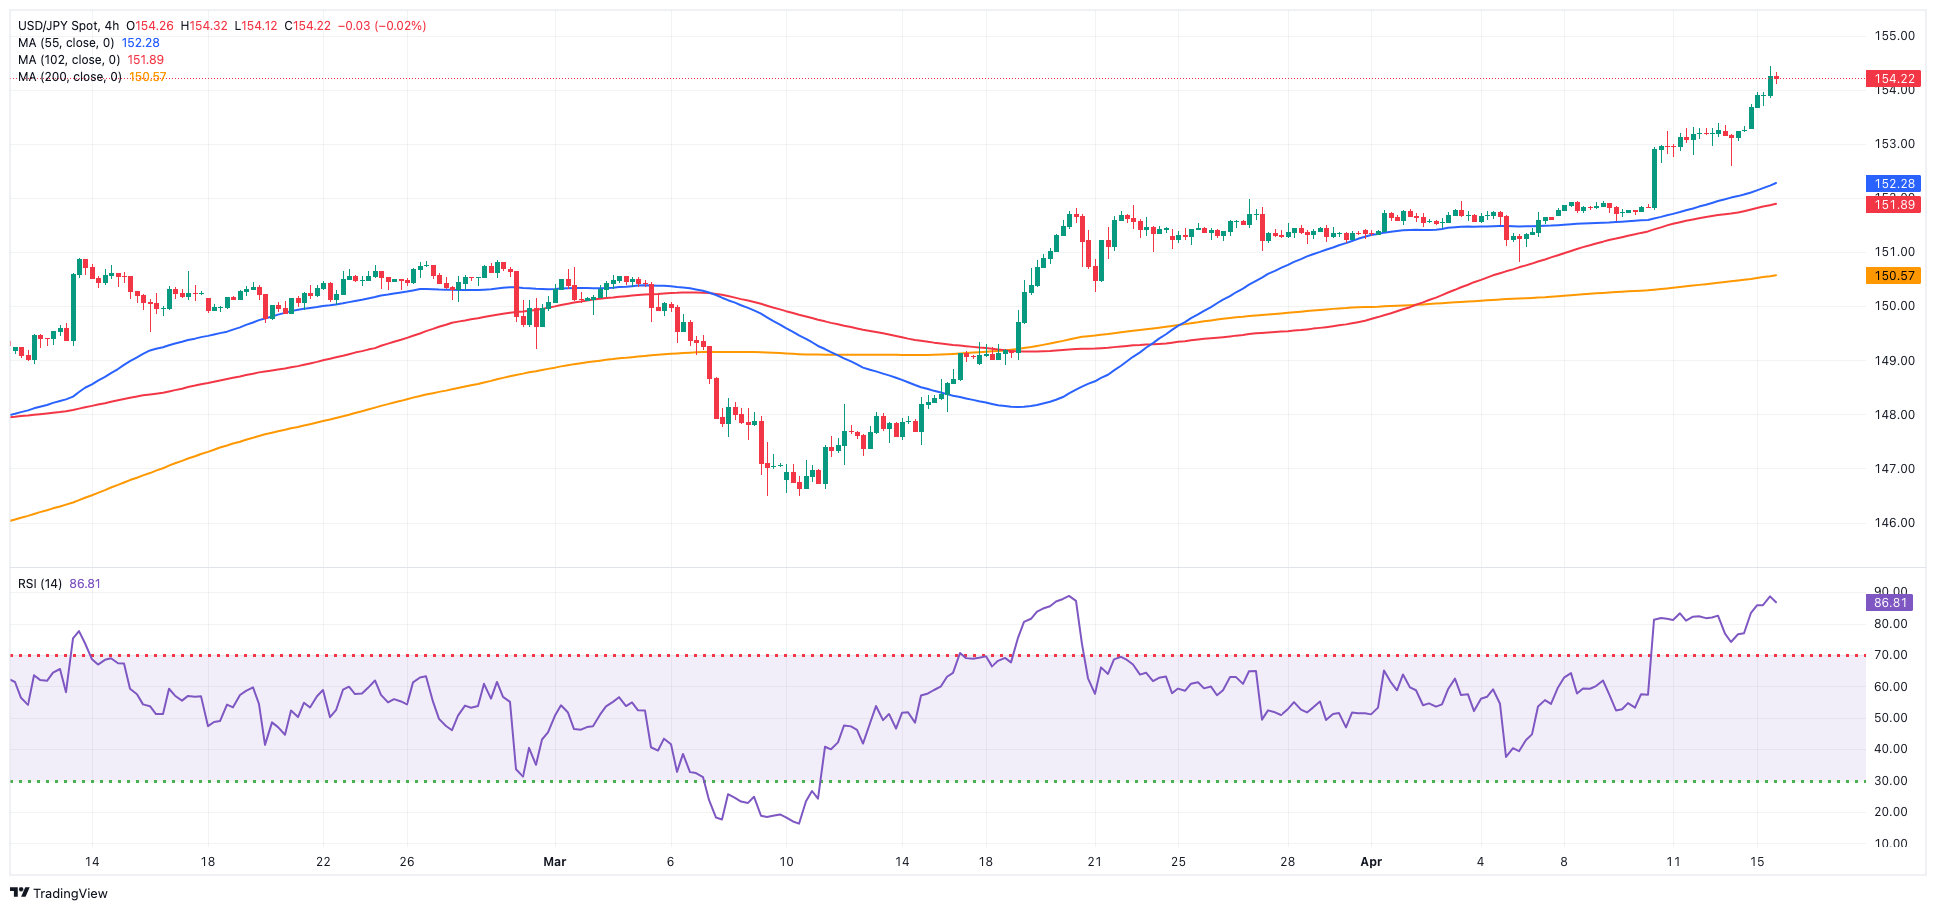
Further depreciation of the Japanese yen saw USD/JPY rise to levels last traded in early June 1990, well north of the 154.00 hurdle at the beginning of the week.
The rise in the pair was driven by further strength in the greenback as well as the bounce in US yields across various periods, a move matched by JGB 10-year yields, which approached the 0.90% level.
Regarding the prospect of intervention, it is worth noting that recent comments from Japan's Kanda have stated that authorities are always prepared for any scenario, whether it involves currency intervention or not. Furthermore, Finmin Suzuki stated that officials are closely monitoring currency changes "with a profound sense of urgency."
In Japan, Machinery Orders contracted at an annualized 1.8% in February.
The next upward barrier for USD/JPY appears at the 2024 high of 154.44 (April 15), which precedes the June 1990 high of 155.80. Instead, the pair is projected to find initial support at the April low of 150.80 (April 5), with the 55-day and 100-day SMAs of 150.13 and 147.92, respectively, providing temporary contention. The critical 200-day SMA of 147.32 appears below that region and comes ahead of the March low of 146.47 (March 8). A breakdown of this zone might result in a return to the February low of 145.89 (February 1), which is prior to the December 2023 low of 140.24 (December 28), the round number 140.00, and the July low of 137.23 (July 14). The daily RSI rose above 77, indicating that the pair is severely overbought.
Resistance levels: 154.44 155.80 155.88 (4H chart)
Support levels: 152.58 151.87 150.80 (4H chart)
GBPUSD
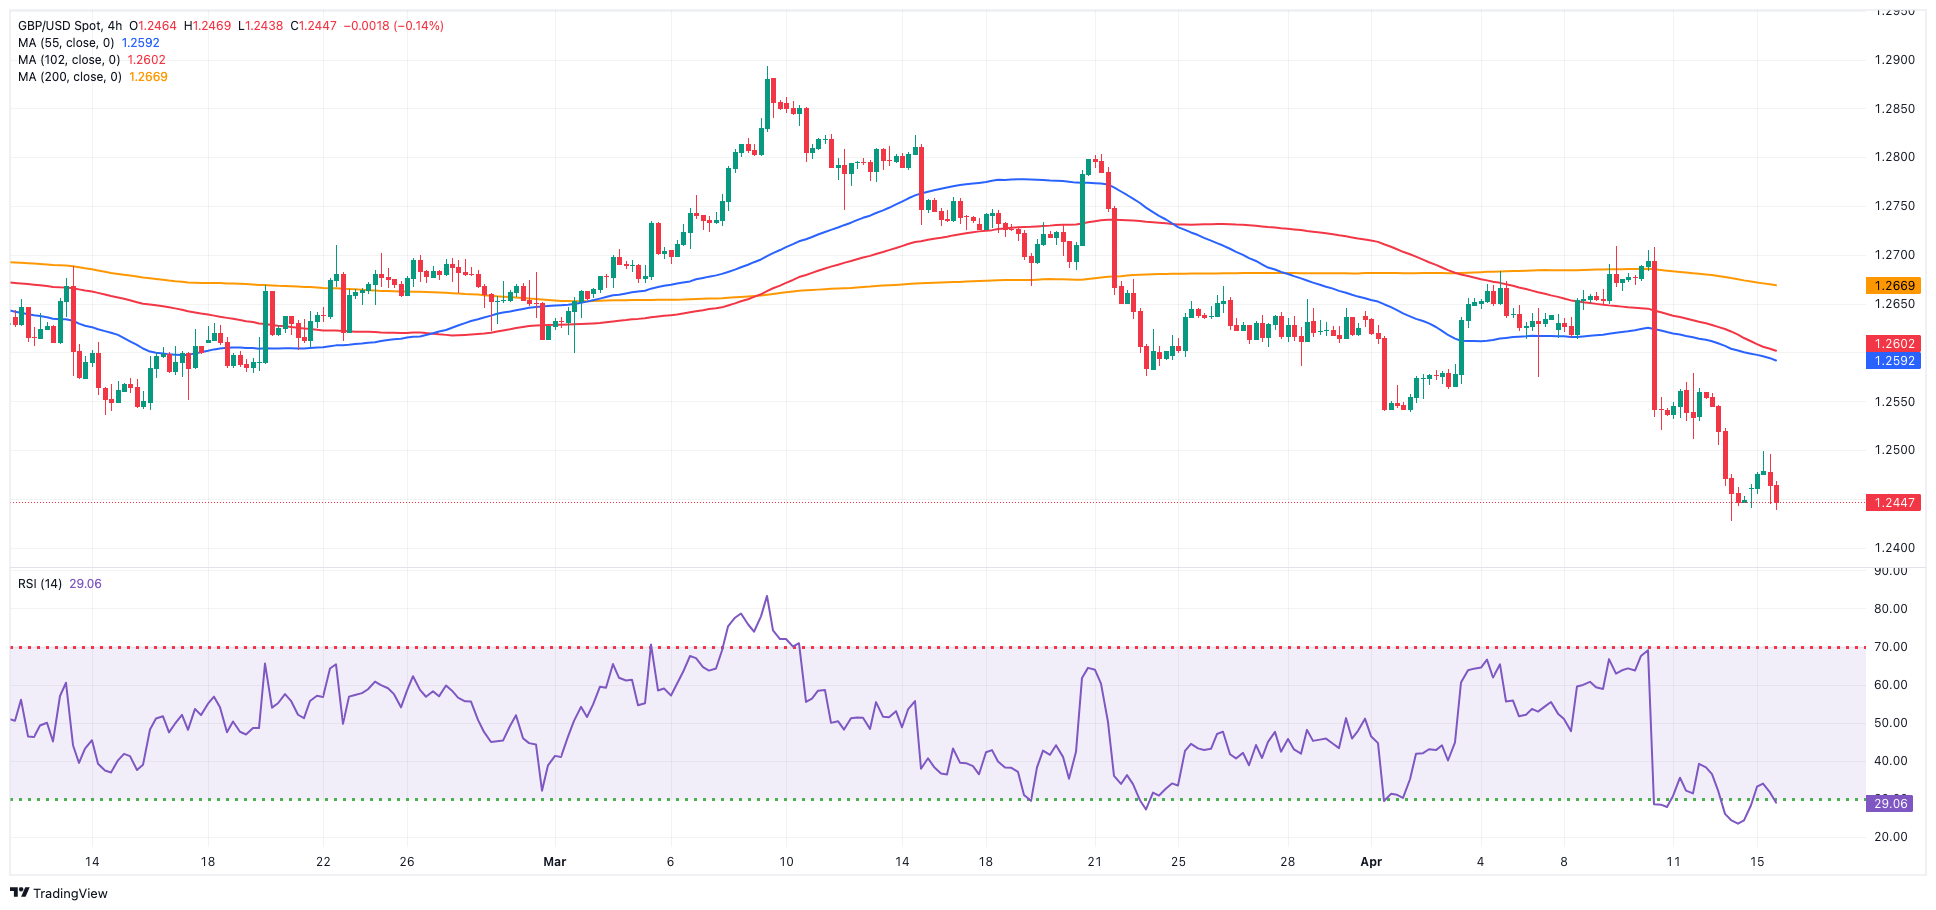
GBP/USD alternated gains with losses in the vicinity of 1.2450 on Monday following a failed attempt to retest or surpass the 1.2500 hurdle earlier in the day.
The continuation of the upward bias in the Dollar propelled the USD Index (DXY) to fresh highs north of the 106.00 barrier, driven by increasing speculation that the Fed could begin lowering interest rates later this year, potentially in December, all amidst the increasing narrative regarding central banks’ divergence in monetary policy.
Meanwhile, in the UK bond market, 10-year gilt yields rose to the area of yearly peaks beyond 4.25%.
There were no data releases across the Channel at the beginning of the week.
Immediately on the downside for GBP/USD is the 2024 bottom of 1.2426 (April 12). A deeper decline would not find major support until the weekly low of 1.2187 (November 10, 2023), which precedes the October 2023 low of 1.2037 and the main 1.2000 contention zone. On the other hand, the crucial 200-day SMA of 1.2581 serves as the initial upward hurdle, followed by the April high of 1.2709 (April 9), the weekly top of 1.2803 (March 21), and the 2024 peak of 1.2893 (March 8). Further north, the weekly high of 1.2995 (July 27, 2023) is just over the crucial 1.3000 level. On the daily chart, the RSI looked stable below 33.
Resistance levels: 1.2578 1.2669 1.2709 (4H chart)
Support levels: 1.2426 1.2373 1.2187 (4H chart)
GOLD
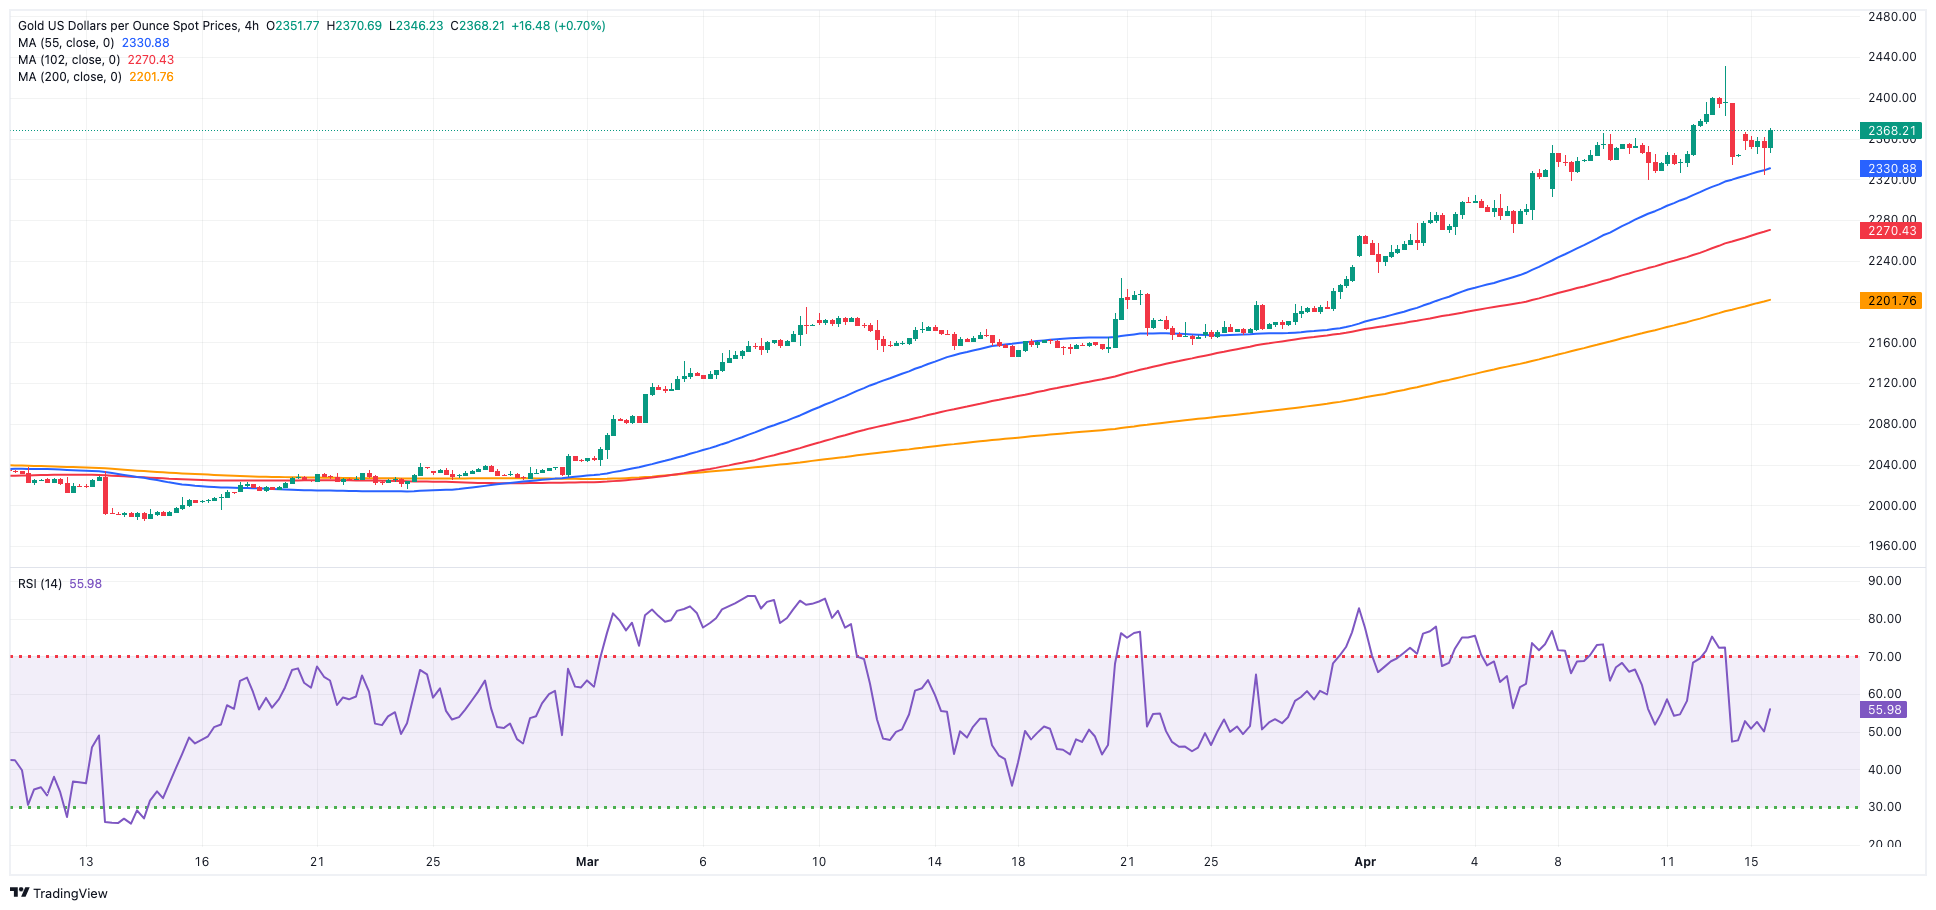
Escalating geopolitical tensions prompted investors to favour safe-haven assets, leading Gold prices to resume their upward trajectory and quickly recover from Friday's corrective dip, even after reaching a record high above the $2,400 threshold per troy ounce.
Meanwhile, this movement contradicted the ongoing bullish trend in the dollar and the resurgence of upward momentum in US yields across various timeframes.
Gold is facing immediate resistance at its all-time high of $2,431 (April 12). On the contrary, the weekly low of $2,146 (March 18) comes first, followed by the preliminary 55-day and 100-day SMAs of $2,135 and $2,089, respectively, all before the more important 200-day SMA of $2,008. Moving south, the 2024 low of $1,984 (February 14) is followed by the 2023 lows of $1,973 (December 13) and $1,931 (November 13). The failure in this position may drive the metal to test its October 2023 bottom of $1,810 (October 6), then the 2023 bottom of $1,804 (February 28), and the critical $1,800 conflict zone.
Resistance levels: $2,431 (4H chart)
Support levels: $2,319 $2,267 $2,228 (4H chart)
CRUDE WTI
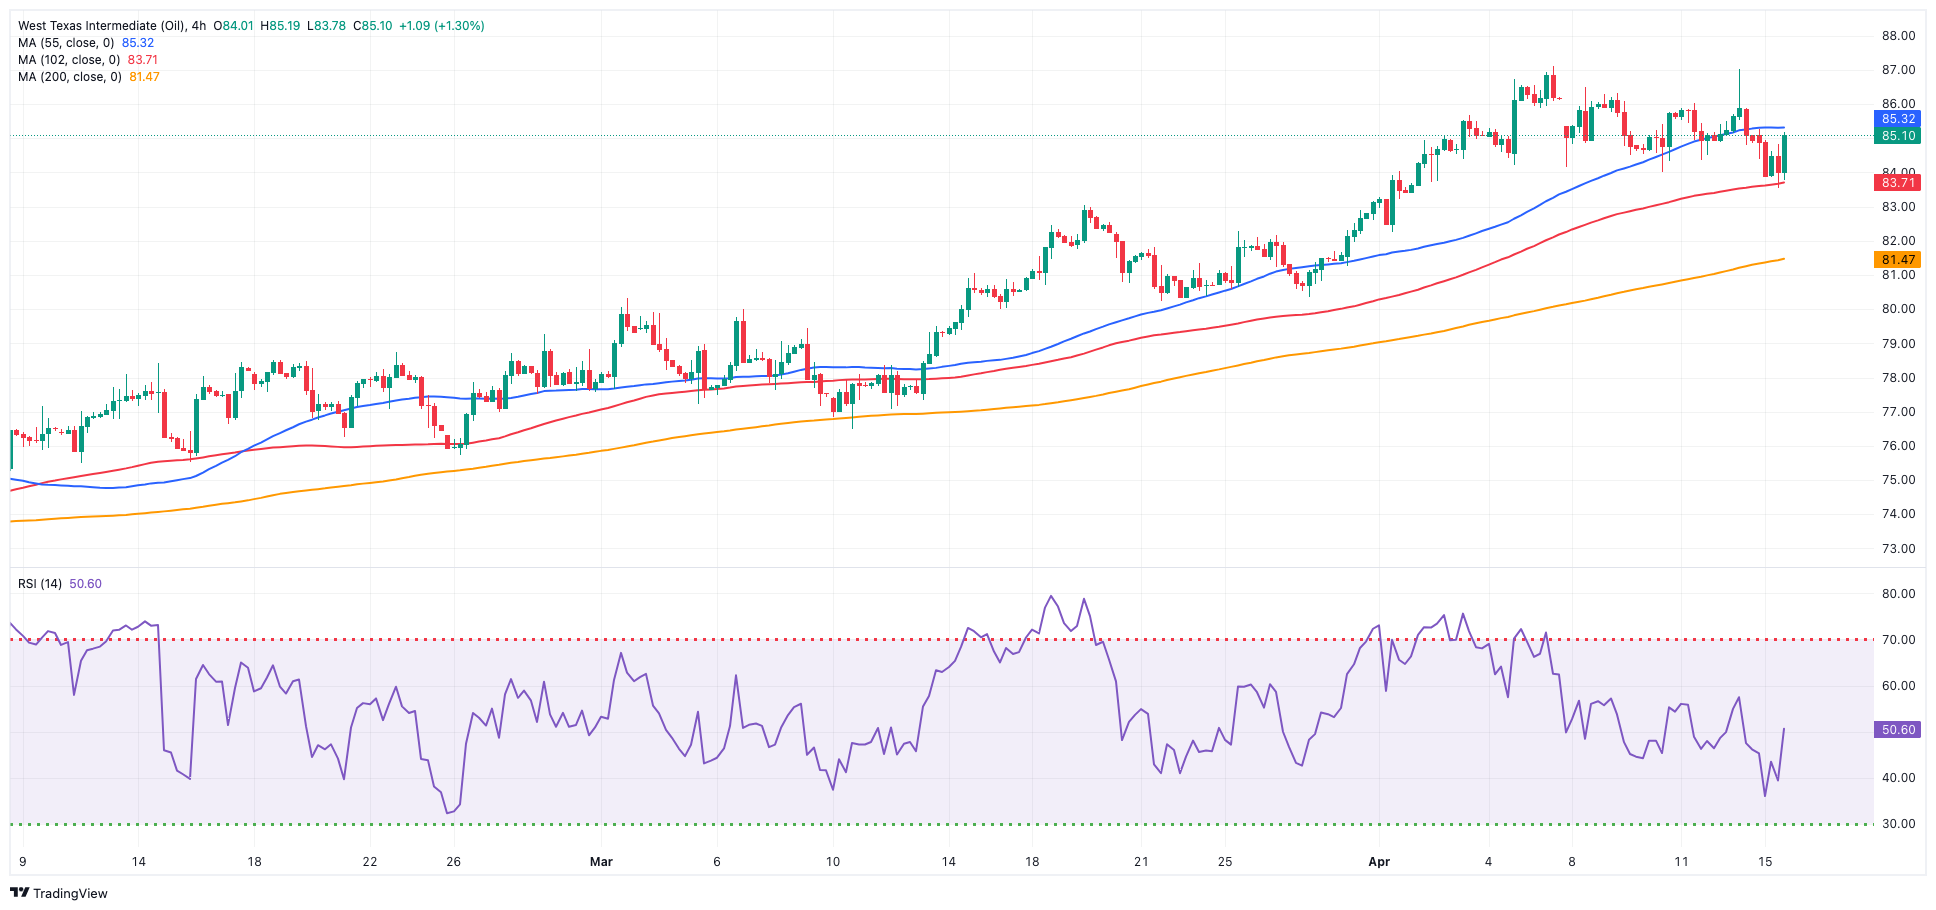
Further weakness motivated the WTI price to retreat for the third consecutive session Monday, this time challenging multi-day lows within the boundaries of the $84.00 mark per barrel.
In fact, crude oil prices receded further as traders continued to evaluate Iran’s attack on Israel over the weekend, which yielded only modest damages. Furthermore, Iran's statement indicating that it views its retaliation as concluded has reduced geopolitical tensions, adding to the downward bias in the commodity.
Additionally, a pessimistic outlook for global oil demand growth presented in the IEA's monthly report released on Friday, along with concerns about the pace of US interest rate cuts, further contributed to the decline in prices.
The next upward challenge for WTI is the 2024 peak of $87.60 (April 12), which comes before the weekly high of $89.83 (October 18, 2023) and the 2023 top of $94.99 (September 28, 2023). Further north, the weekly peak of $97.65 (August 30) is barely shy of the psychological $100.00 mark. The immediate downward hurdle is the weekly low of $84.08 (April 15) seconded by another weekly low of $80.33 (March 21). Further south comes the 200-day SMA of $79.63 and the February low of $71.43 (February 5). A breach of this region may bring the important $70.00 barrier back into view before the 2024 low of $69.31 (January 3) and the December 2023 low of $67.74 (December 13).
Resistance levels: $87.60 $89.82 $94.99 (4H chart)
Support levels: $84.02 $82.58 $80.51 (4H chart)
GER40
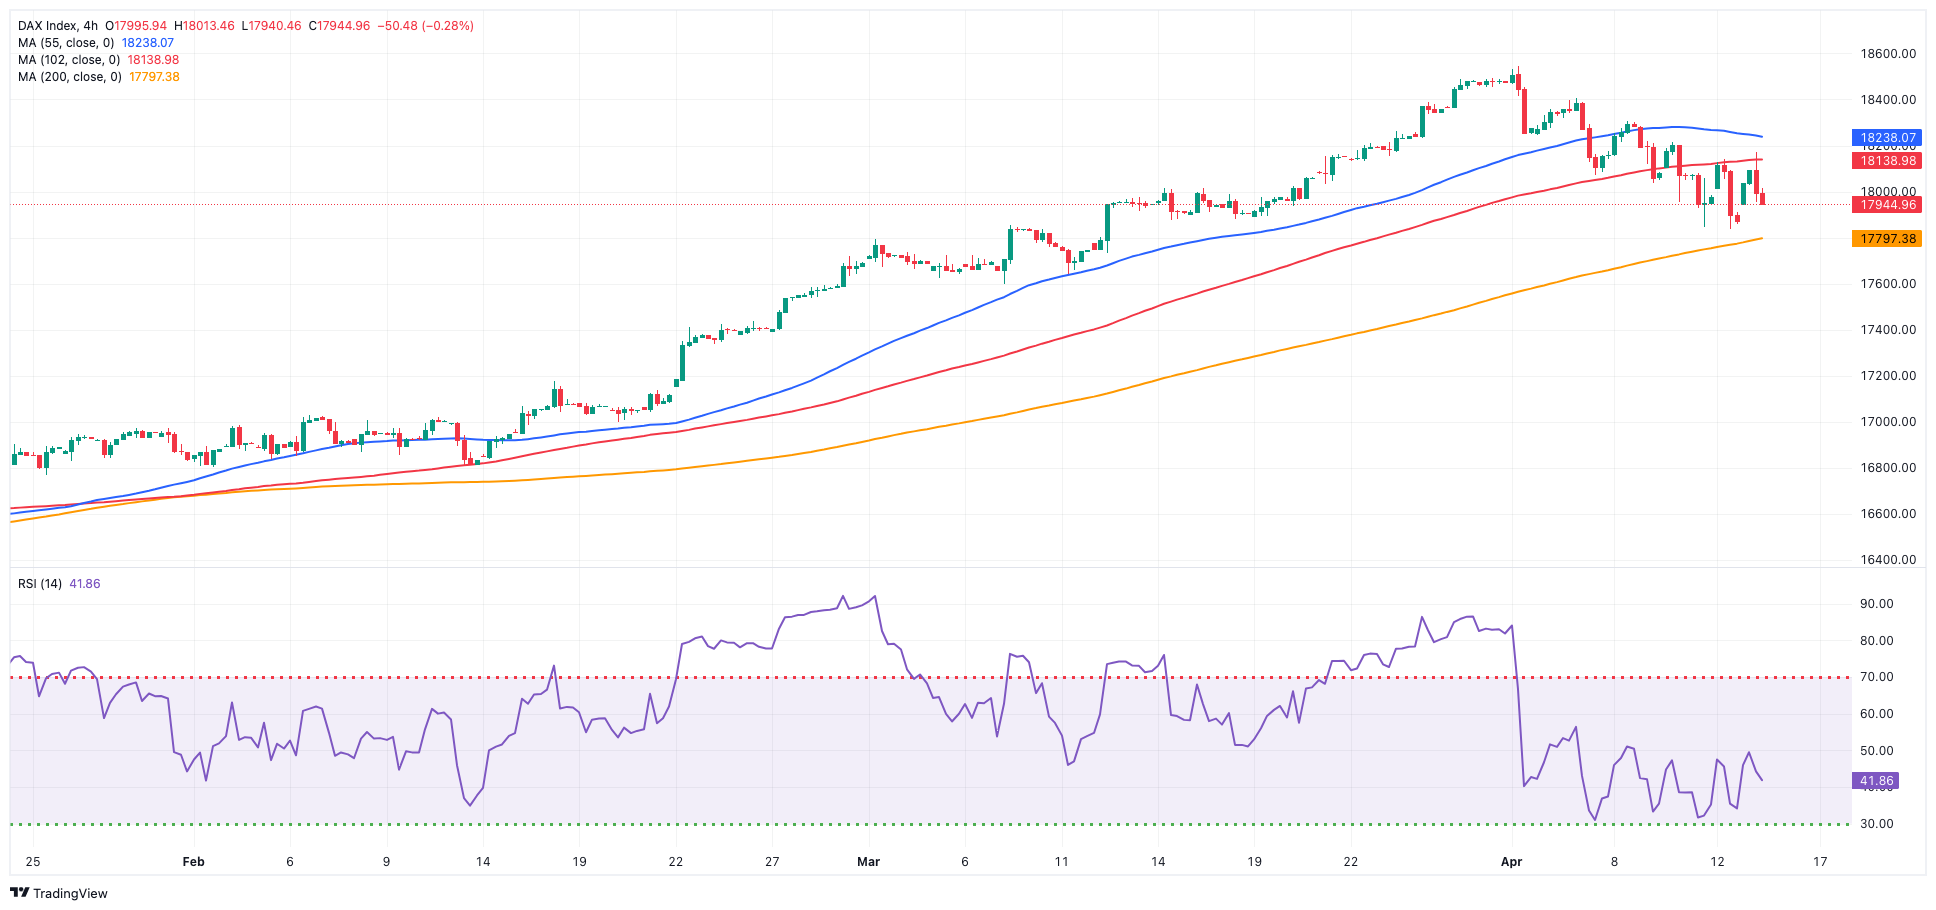
German stocks, as represented by the DAX40, managed to regain composure and reverse two daily pullbacks in a row in a positive start to a new trading week, reclaiming at the same time the area beyond 18,000.
The DAX40's rebound coincided with rising prudence as market participants assessed geopolitical effervescence, particularly after the Iran attack on Israel over the weekend.
On a broader picture, investors remained focused on interpreting the ECB’s hints at a potential interest rate cut over the summer (June?), as suggested during the bank’s event last Thursday.
In the German money market, 10-year bund yields rose in line with their global peers and retested the 2.45% zone.
The loss of the April low of 17,860 (April 12) may push the DAX40 to challenge the March low of 17,619 (March 7), which appears to be supported by the provisional 55-day SMA of 17,623. A breach of this region might bring the February low of 16,821 (February 1) back into view, ahead of the important 200-day SMA of 16,375 and the 2024 bottom of 16,345 (January 17). After falling below the latter, the weekly low of 15,915 (November 28) may be tested, followed by the October low of 14,630 (October 23) and the 2023 low of 14,458 (March 20). The next level of resistance is the record high of 18,567 (April 2). The daily RSI bounced above 50.
Best Performers: Adidas, Sartorius AG VZO, Covestro
Worst Performers: Bayer, Qiagen, RWE AG ST
Resistance levels: 18,191 18,427 18,567 (4H chart)
Support levels: 17,860 17,619 17,432 (4H chart)
GBPJPY
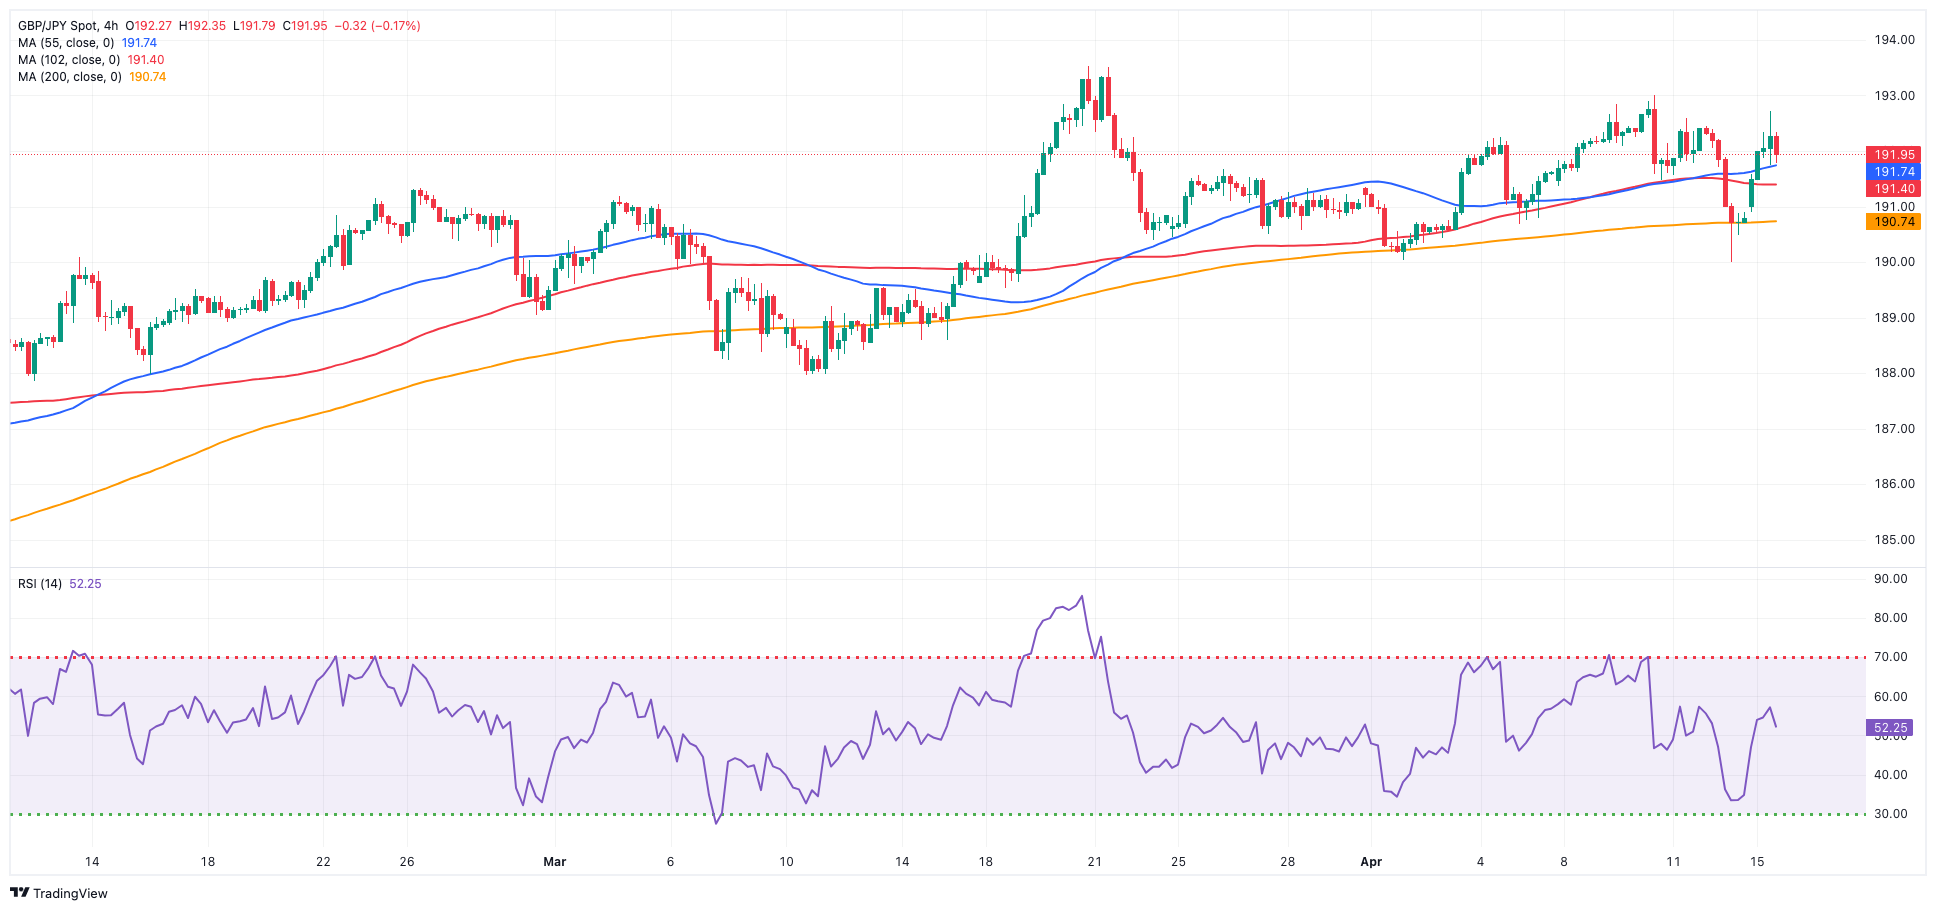
Extra weakness in the Japanese yen was behind the strong recovery in GBP/JPY, which managed to reclaim the region above the 192.00 hurdle in quite an auspicious start to the week.
The daily uptick in the cross also came amidst a decent bounce in the British pound despite the greenback remaining bid and maintaining its upside momentum well in place for yet another session.
At present, downward shifts in the cross seem to be constrained near the 190.00 mark, with yearly peaks in the mid-193.00s posing obstacles to any immediate upward progression.
If GBP/JPY falls below the April low of 189.99 (April 12), it may challenge the March low of 187.96 (March 11), before the intermediate 100-day SMA of 187.45, and the February low of 185.22 (February 1), which is still supported by the proximity of the critical 200-day SMA of 185.36 and comes before the December 2023 bottom of 178.33 (December 14). In the other direction, early resistance occurs at the April top of 192.97 (April 10) before hitting the 2024 peak of 193.53 (March 20). The breakout of this level may show the August 2015 high of 195.28 (August 18), followed by the record top of 195.88 (June 24, 2015). The daily RSI rebounded beyond 56.
Resistance levels: 192.97 193.53 195.28 (4H chart)
Support levels: 190.73 189.99 189.54 (4H chart)
NASDAQ
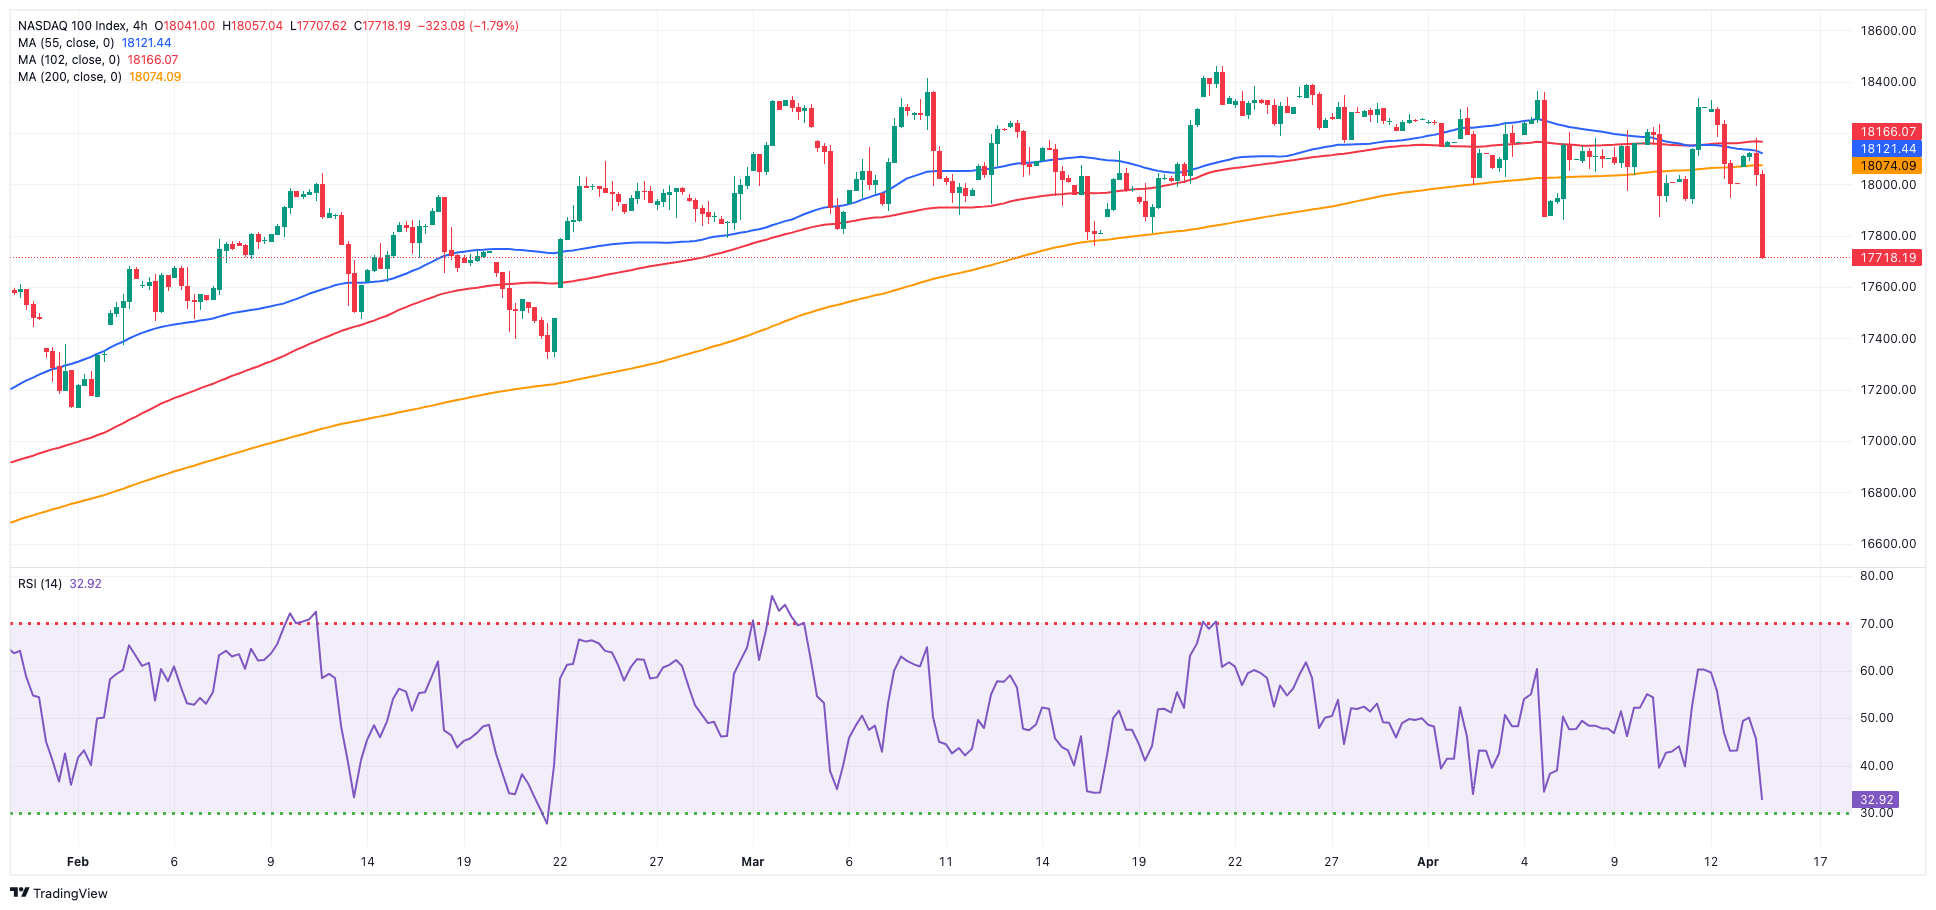
Following a negative start to the week, the US tech benchmark Nasdaq 100 slipped back to the 17,700 zone for the first time since mid-March.
In fact, the index added to Friday’s decline on the back of the persistent move higher in the greenback and the resumption of the bullish trend in US yields across various maturities, while expectations of a later-than-anticipated rate cut by the Fed also had their say in the daily retracement and collaborated with the sour sentiment..
Extra losses could now revisit the weekly low of 17,319 (February 21) ahead of the provisional 100-day SMA at 17,303 and another weekly low of 17,128 (January 31). If the latter is broken, a challenge to the 2024 bottom of 16,249 (January 5) could arise, ahead of the critical 200-day SMA of 16,221 and the December 2023 low of 15,695 (December 4). Additional losses from here may return to the October 2023 level of 14,058 (October 26), which precedes the April 2023 low of 12,724 (April 25) and the March 2023 low of 11,695 (March 13). In case bulls regain the initiative, the next up barrier emerges at the all-time high of 18,464 (March 21). The daily RSI declined to about 42.
Top Gainers: Kraft Keinz, Intel, Keurig Dr Pepper
Top Losers: The Trade Desk, Atlassian Corp Plc, GlobalFoundries
Resistance levels: 18,337 18,464 (4H chart)
Support levels: 17,640 17,500 17,319 (4H chart)
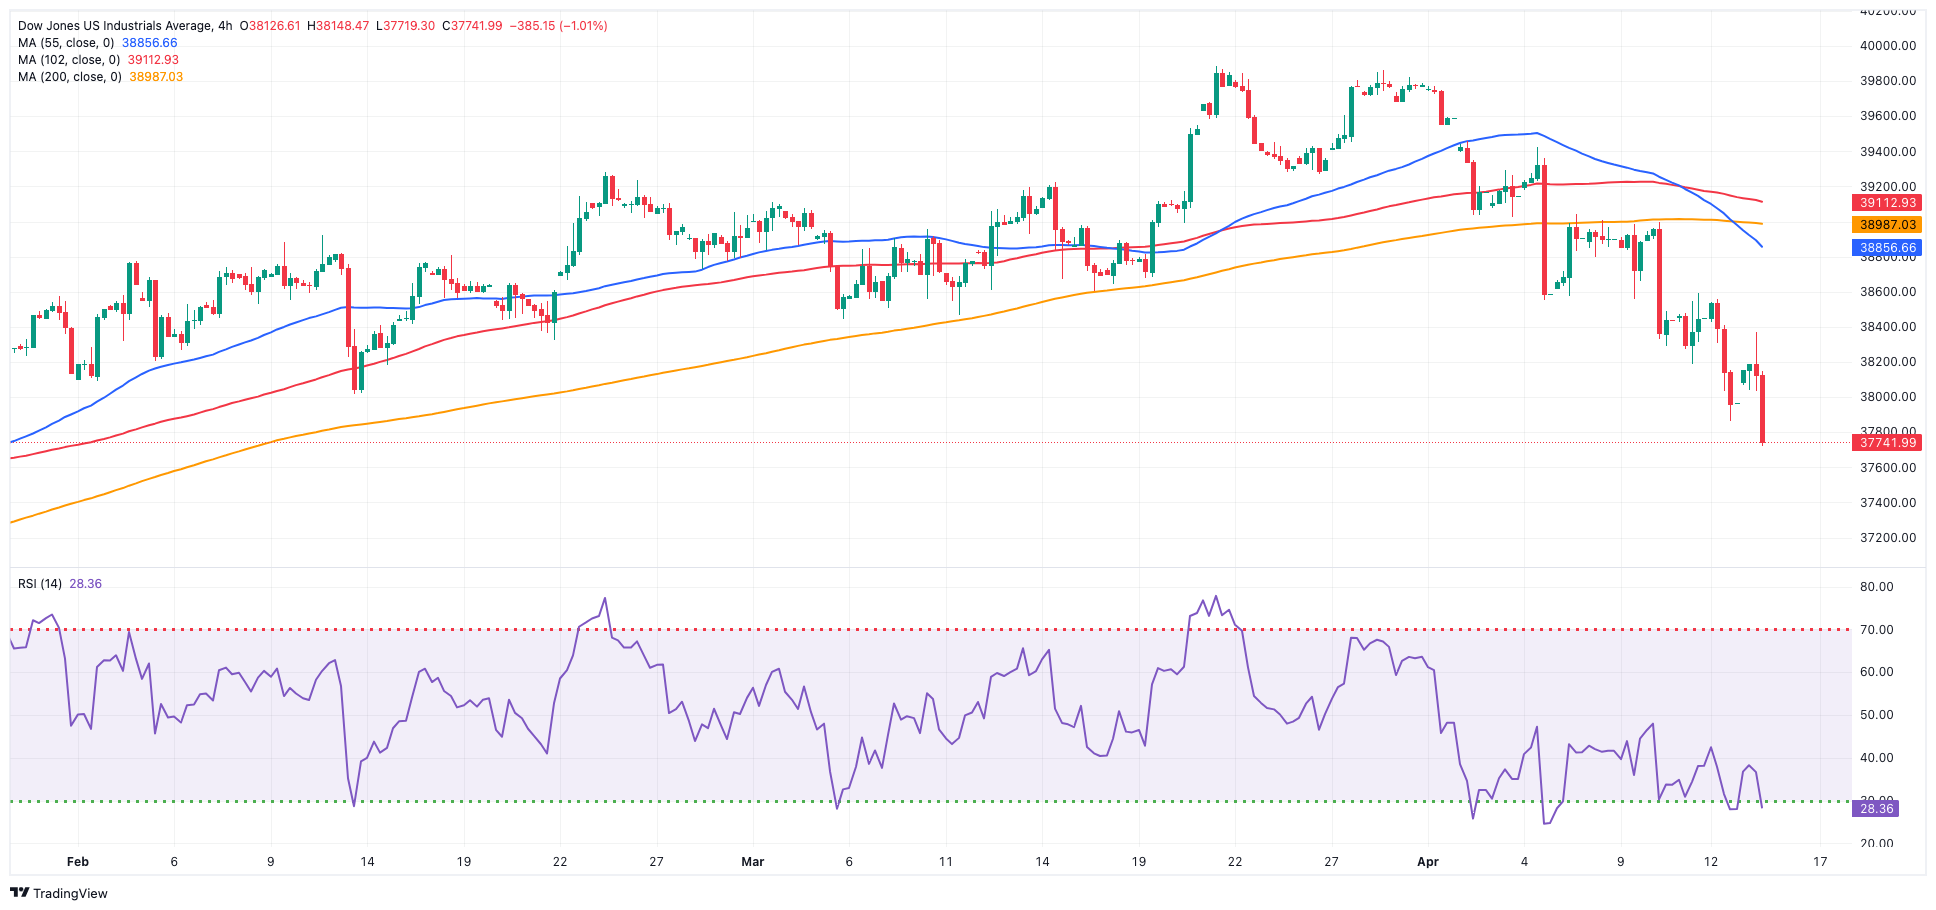
DOW JONES
Investors’ pessimism remained well in place for yet another session on Monday, dragging the US reference Dow Jones to a new three-month low near 37,700.
This sixth consecutive daily decline in the index came in contrast to a solid performance from major US lender Goldman Sachs, while mounting geopolitical tensions, higher yields and expectations surrounding the Fed’s monetary policy stance weighed on the index.
On the latter, the recent high CPI indicates strong economic performance with inflation, which conflicts with the revised expectations of rate cuts.
At the beginning of the week, the Dow Jones retreated 0.60% to 37,755, the S&P 500 deflated 1.09% to 5,067, and the tech-heavy Nasdaq Composite dropped 1.42% to 15,943.
If the selling pressure persists, the Dow Jones might challenge the 2024 low of 37,122 (January 18), prior to the crucial 200-day SMA at 36,144. The weekly low of 33,859 (November 7, 2023) comes next, followed by the October 2023 low of 32,327 (October 27), all before the 2023 bottom of 31,429 (March 15). Having said that, the next upward hurdle is the interim 55-day SMA of 38,824 ahead of the record high of 39,889 (March 21). The daily RSI receded to the 31 area.
Top Performers: Goldman Sachs, UnitedHealth, Intel
Worst Performers: Salesforce Inc, Visa A, Microsoft
Resistance levels: 38,875 39,421 39,889 (4H chart)
Support levels: 37,749 37,122 36,010 (4H chart)
MACROECONOMIC EVENTS

All Information & Updates provided by:

All information relating to the financial markets available on this page has been prepared and issued by FXStreet (Forexstreet SL, Spain, Reg: B62498233) on the basis of publicly available information and all information believed to be reliable and does not conflict with Kuwaiti local laws, and all necessary care has been taken to before the company to ensure that the facts mentioned are correct from the source.
NCM Investment nor any of its directors or employees shall in any way be held responsible for the contents of this news, and the information contained on this page is intended only to provide clients with publicly available information and should not be construed as investment advice, report or analysis and/or constitute an offer or invitation to buy or sell financial instruments of any kind.
RISK WARNING: Forex and CFDs are highly risky leveraged products, as losses can exceed deposits. Please ensure you understand all the risks and take independent advice if necessary. NCM will segregate the clients based on the criteria of the regulator and its bylaws. NCM does not provide any advisory service; the material published does not constitute advice or a recommendation for a transaction in any financial instrument. NCM accepts no responsibility for any use of the content presented and any consequences of that use. Anyone acting on the information provided does so at their own risk.