
- Contact Us:
-

-

-

-


Daily Market Updates
17 Apr 2024
EURUSD
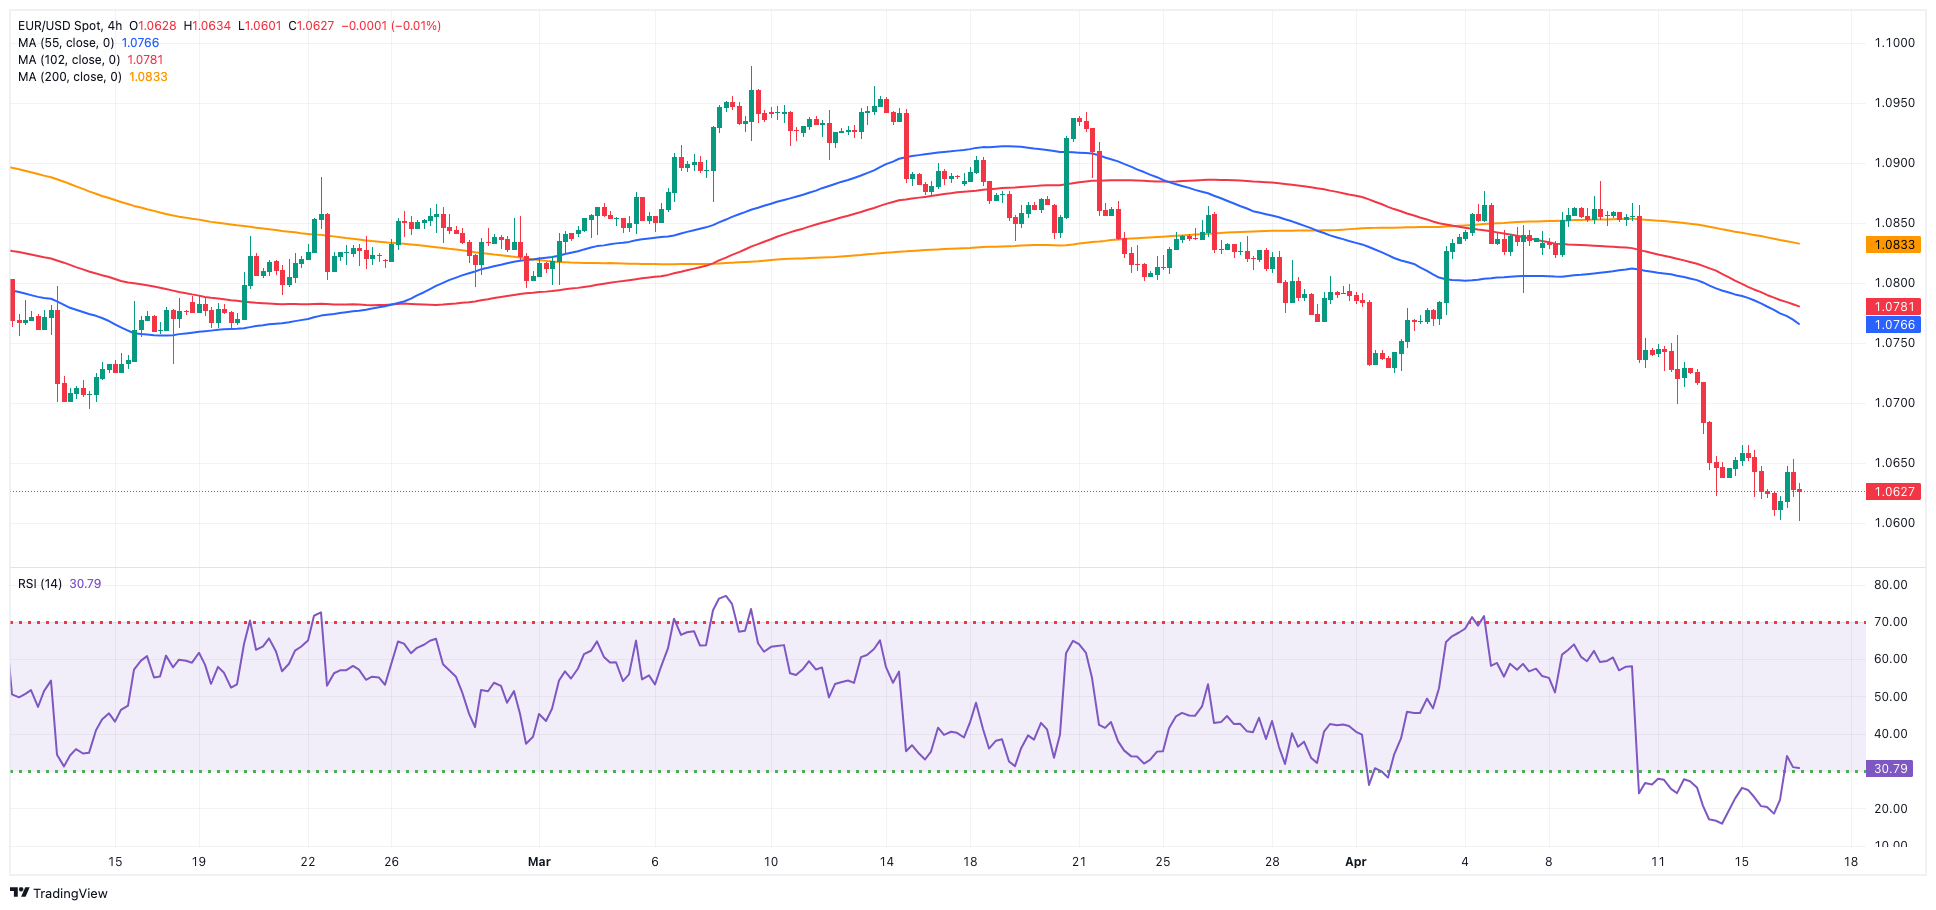
The rally in the greenback extended further on Tuesday, keeping the risk-linked galaxy well under downside pressure and dragging EUR/USD to fresh lows in the 1.0600 neighbourhood.
On the USD side of the equation, the USD Index (DXY) hit new tops past 106.50, an area last visited in early November. The dollar’s price action also came in tandem with extra gains in US yields across the curve, always amidst rising speculation of just one (or none) rate cut by the Fed this year.
Back to the Fed, FOMC's Jefferson acknowledged significant strides in reducing inflation but emphasized that the task is not complete. It is anticipated that easing will be suitable later in the year. Furthermore, Chair Powell argued that the recent data have not provided the bank with increased confidence; rather, they suggest that it will likely take more time than anticipated to attain that confidence.
Around the ECB, the ECB's Rehn suggested the possibility of a June reduction if inflation trends towards 2%. Meanwhile, his colleague Makhlouf indicated that a 25-bps cut in June could occur if the CPI trend persists. In addition, Board member Villeroy anticipated a June rate reduction to be followed by further adjustments characterized by "pragmatic and agile gradualism," while President Lagarde argued that the ECB is likely to implement rate cuts soon unless there are significant unforeseen developments, emphasizing the bank's keen focus on oil prices. She highlighted the ECB's close monitoring of oil prices, noting a disinflationary trend aligning with their forecasts. Lagarde also underscored the necessity for further confidence in the disinflationary process.
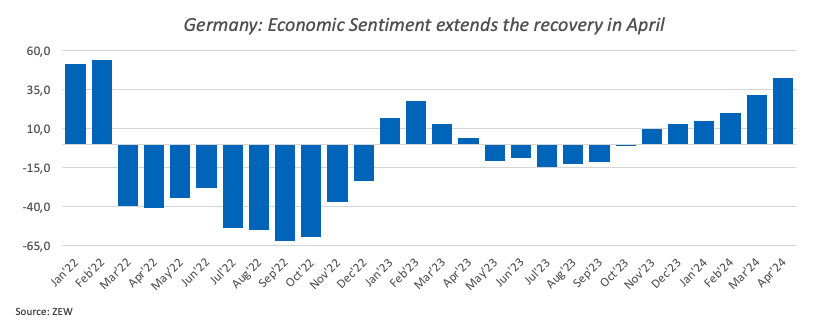
On the domestic calendar, the Economic Sentiment in both Germany and the broader Euroland improved to 42.9 and 43.9, respectively, in April, according to the ZEW institute.
Across the Atlantic, Building Permits dropped by 4.3% MoM, or 1.458M units, in March, and Housing Starts contracted by 14.7% MoM, or 1.321 million units, in the same period. In addition, industrial production expanded by 0.5% in March compared to the previous month.
Extra losses in the EUR/USD could test the 2024 low of 1.0602 (April 16). A deeper decline might reveal a weekly bottom of 1.0495 (October 13, 2023), which comes before the 2023 low of 1.0448 (October 3) and the round milestone of 1.0400. In contrast, immediate resistance is found at the important 200-day SMA of 1.0825, which comes before the weekly peak of 1.0885 (April 9) and the March high of 1.0981 (March 8). Up from here comes the weekly top of 1.0998 (January 5, 2011), just before the critical 1.1000 yardstick. The breakout of this zone might put pressure on the December 2023 peak of 1.1139 (December 27), which is still supported by the 200-week SMA of 1.1138 and corresponds with the 2023 high of 1.1275 (July 18). The daily RSI bounced off the 30 region.
Resistance levels: 1.0665 1.0756 1.0838 (4H chart)
Support levels: 1.0601 1.0516 1.0495 (4H chart)
USDJPY
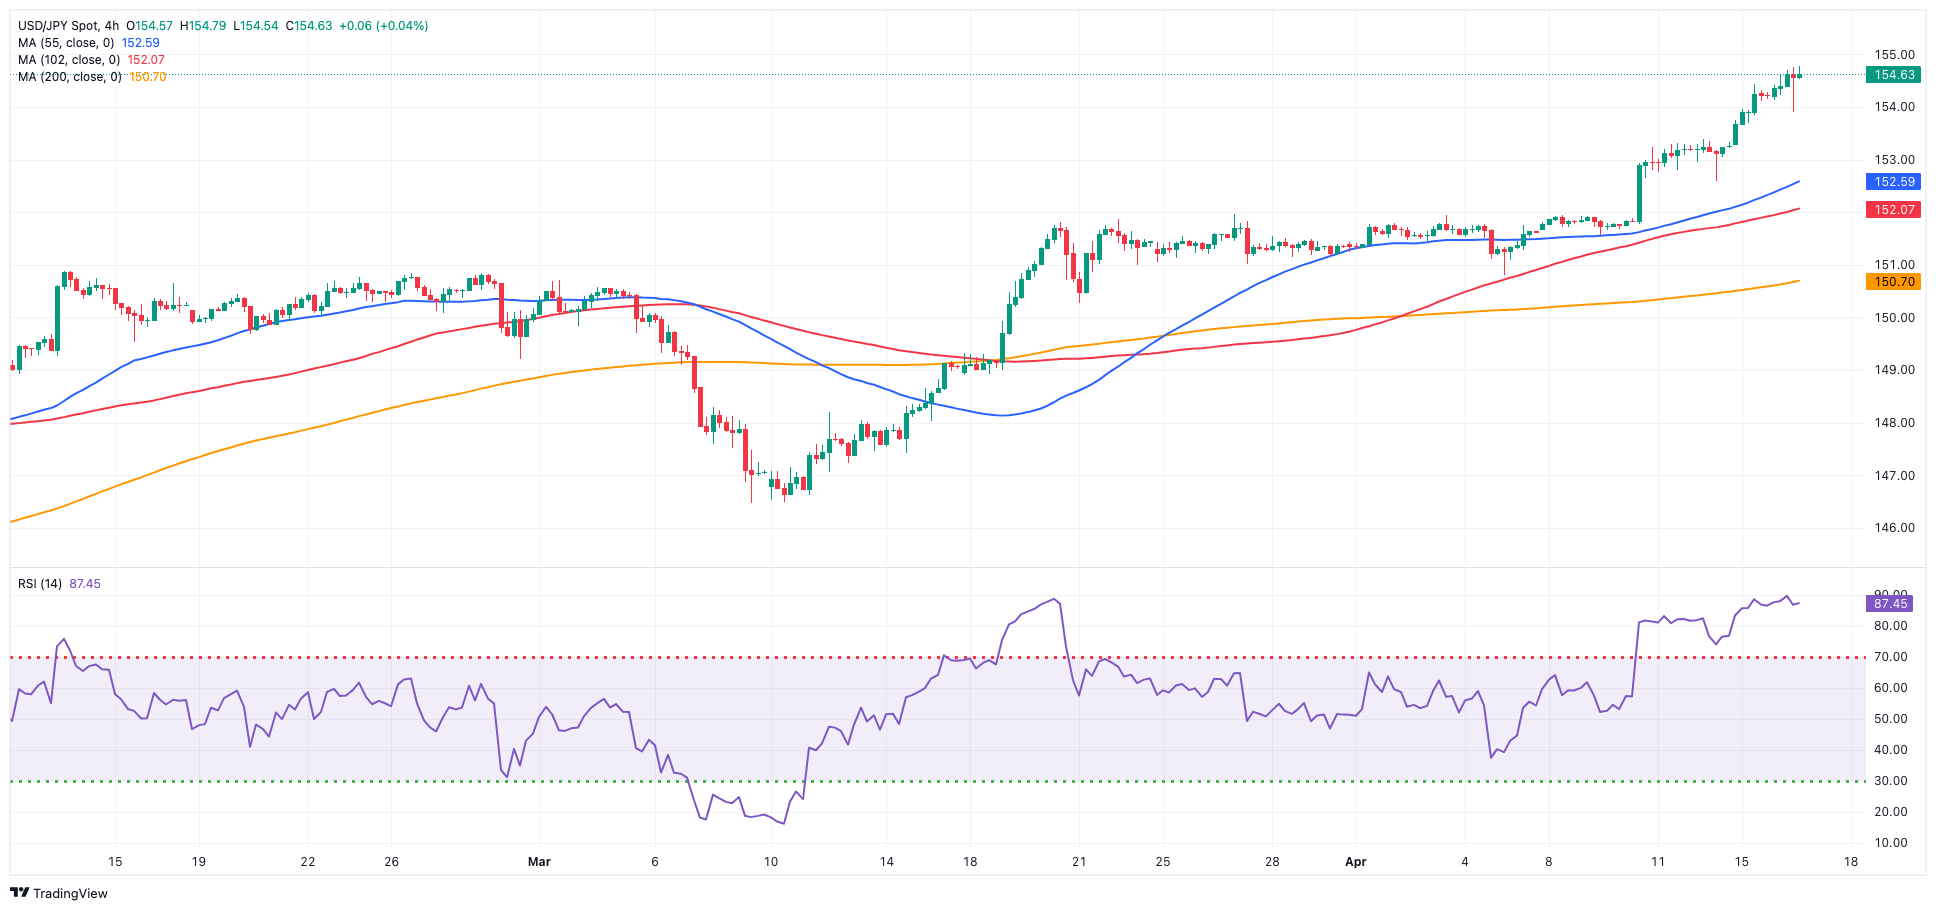
Another day, another high in USD/JPY, this time advancing to the vicinity of 154.80 on Tuesday, adding to Monday’s uptick and maintaining the trade in the area of 34-year highs.
Mild gains in the greenback and further strength in US yields across various timeframes accompanied the move higher in the pair, while JGB 10-year yields returned to the negative zone after clinching fresh tops near the 0.90% level.
Regarding the omnipresent fears of intervention, Japan's Chief Cabinet Secretary, Hayashi, regarded excessive FX volatility as undesirable, while he is closely monitoring currency fluctuations and stands ready to implement all necessary measures regarding foreign exchange.
The next upward hurdle for USD/JPY is the 2024 high of 154.76 (April 16), which precedes the June 1990 high of 155.80. Instead, the pair is expected to find initial support near the April low of 150.80 (April 5), with the 55- and 100-day SMAs of 150.26 and 147.97, respectively, offering temporary aupport. The key 200-day SMA of 147.39 appears below that zone and comes prior to the March low of 146.47 (March 8). A breakdown of this zone might lead to a return to the February low of 145.89 (February 1), which comes before the December 2023 low of 140.24 (December 28), the round number 140.00, and the July low of 137.23 (July 14). The daily RSI rose beyond 78, signalling an extremely overbought condition.
Resistance levels: 154.76 155.80 155.88 (4H chart)
Support levels: 152.58 152.05 150.80 (4H chart)
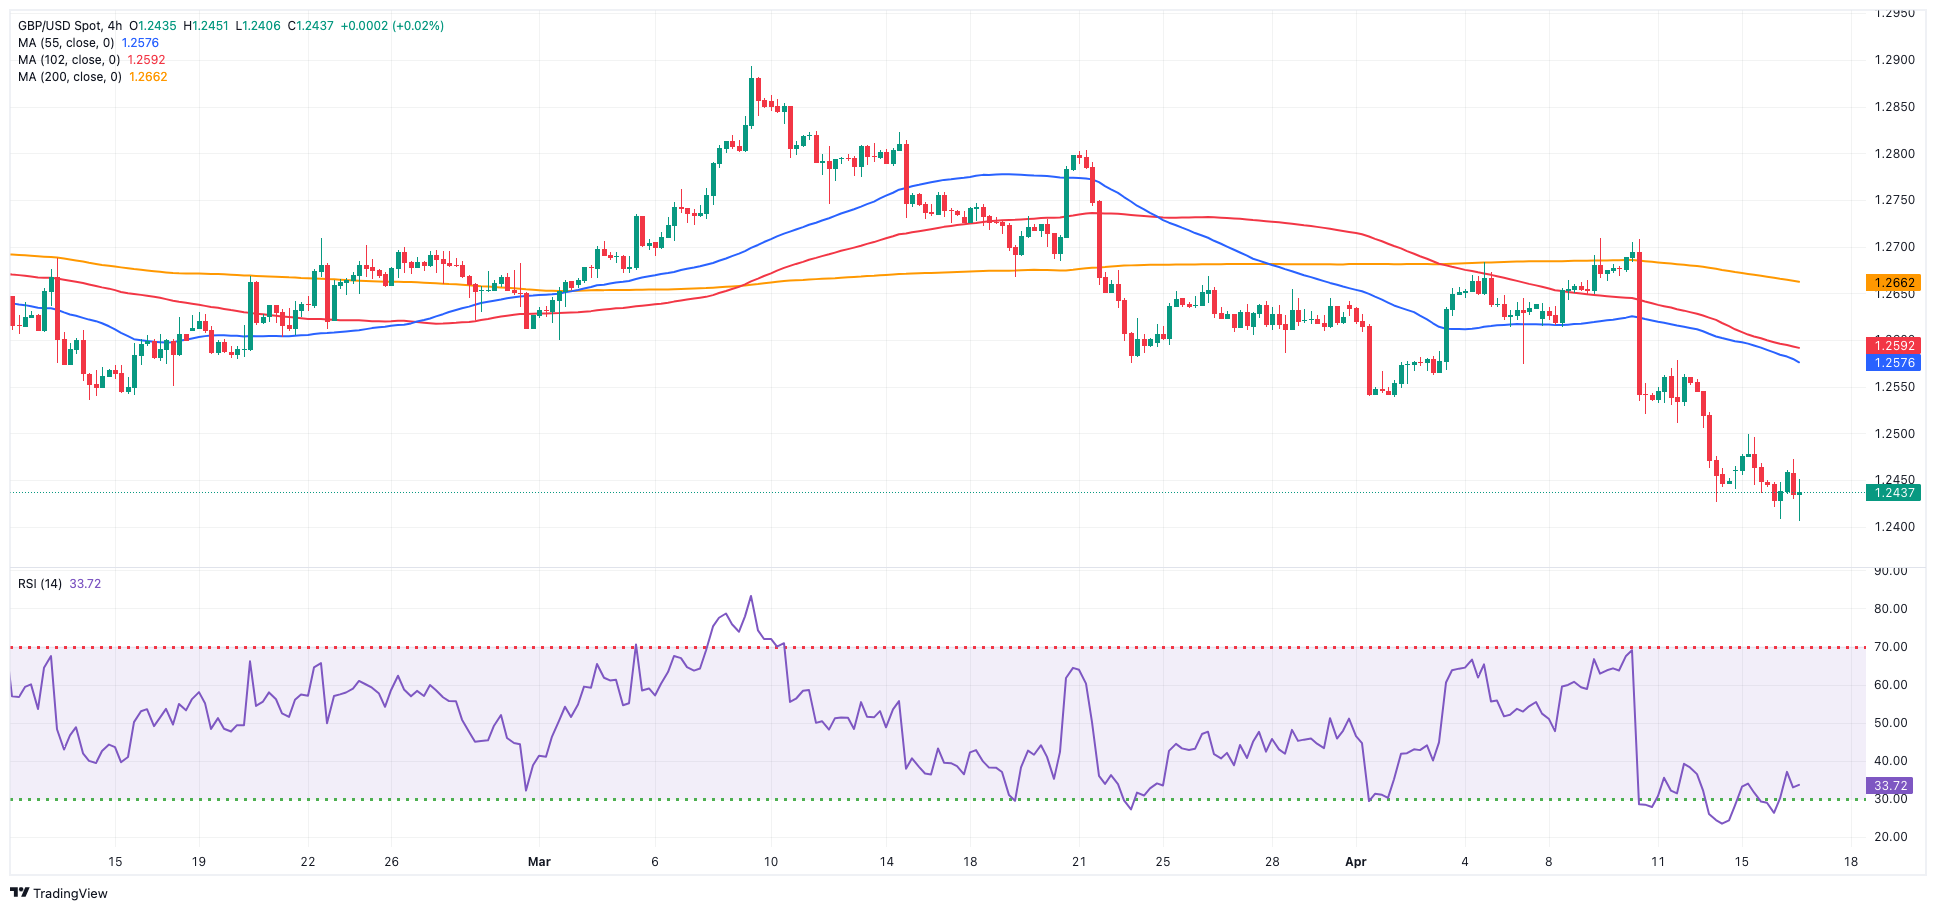
GBPUSD
GBP/USD faced quite a volatile session and barely changed around the 1.2440–1.2450 band on turnaround Tuesday.
In the meantime, the persistent upward trend in the dollar pushed the USD Index (DXY) to achieve new highs near 106.50, fueled by growing speculation that the Fed might initiate interest rate cuts later in the year, possibly in December. This occurred amidst the escalating discourse surrounding the divergence in monetary policies among major central banks.
From the monetary policy front, according to the BoE's Lombardelli, the decrease in inflation is expected to be uneven, and inflation might demonstrate more resilience than anticipated. He added that although wage growth is decelerating, it remains elevated. Lombardelli noted that the decline in headline inflation is attributed to fluctuations in goods and energy prices, and it is anticipated that interest rates in Europe will decrease prior to those in the US.
Meanwhile, in the UK debt market, 10-year gilt yields climbed to levels last seen in mid-November, around 4.33%.
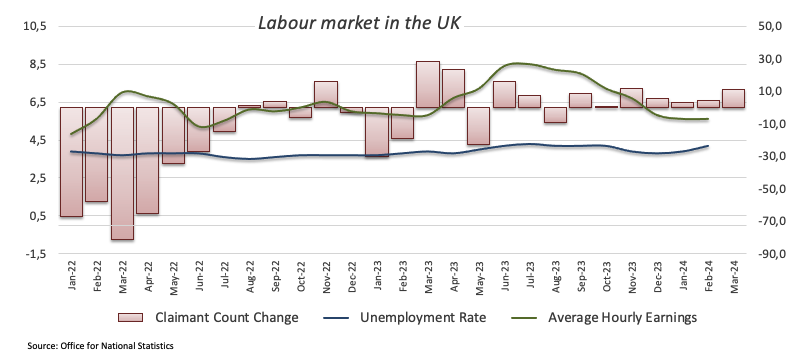
Weighing on the British pound, mixed results from the UK labour market in February saw the Unemployment Rate tick higher to 4.2%, the Employment Change shrink by 156K individuals, Claimant Count Change rise by 10.9K persons, and Average earnings, including bonuses, hold steady at 5.6%.
The immediate downward target for GBP/USD is the 2024 low of 1.2408 (April 16). A deeper slide would not find significant support until the weekly low of 1.2187 (November 10, 2023), which comes before the October 2023 bottom of 1.2037 and the main 1.2000 contention zone. On the other hand, the important 200-day SMA of 1.2579 acts as the first upward obstacle, followed by the April high of 1.2709 (April 9), the weekly top of 1.2803 (March 21), and the 2024 peak of 1.2893 (March 8). Further north, the weekly high of 1.2995 (July 27, 2023) is just over the key 1.3000 mark. On the daily chart, the RSI settled around 33.
Resistance levels: 1.2498 1.2578 1.2669 (4H chart)
Support levels: 1.2408 1.2373 1.2187 (4H chart)
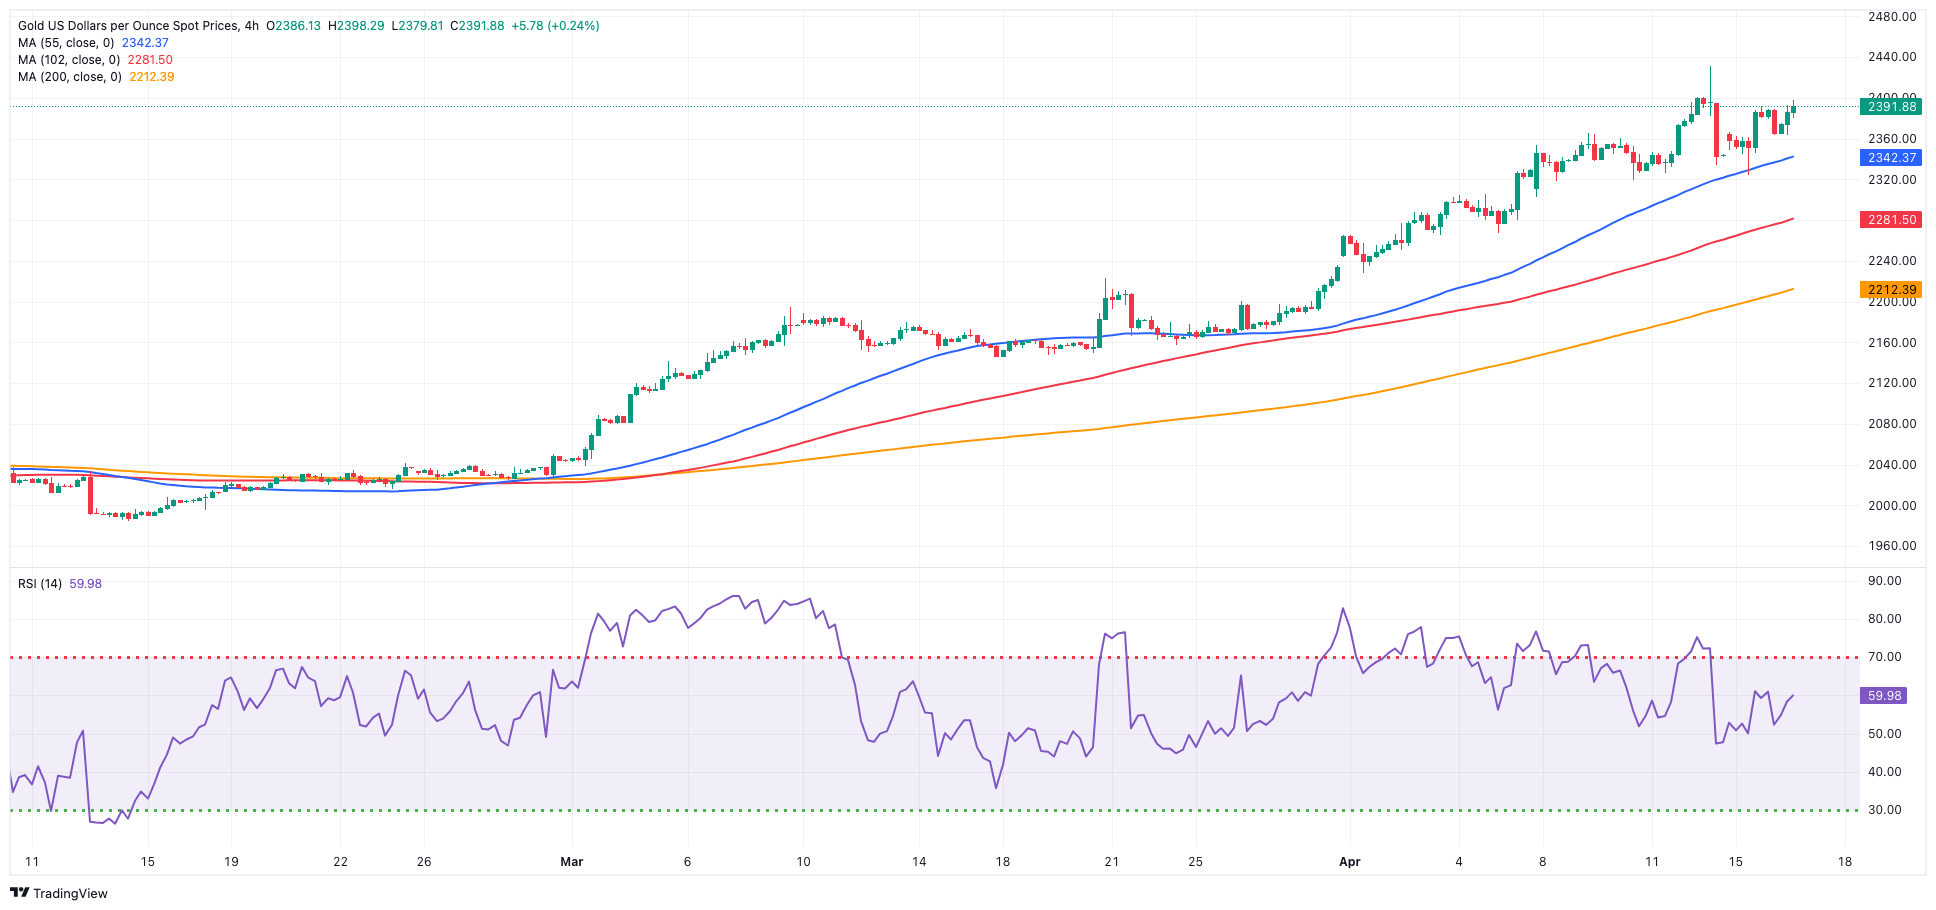
GOLD
Prices of gold added to Monday’s uptick as the demand for safe-haven assets took precedence over the anticipation of fewer US rate cuts in the current year, all pari passu with traders’ assessment of persistent tensions in the Middle East.
Indeed, the yellow metal remained well bid, awaiting further developments in the Israeli-Iranian confrontation, while another rally should not be ruled out in case the situation escalates.
Contributing to the upward trend in precious metal was ongoing acquisition activity by central banks.
Gold faces immediate resistance at its all-time high of $2,431 (April 12). Just the opposite, the weekly low of $2,146 (March 18) is first, followed by the preliminary 55-day and 100-day SMAs of $2,142 and $2,093, respectively, all before the more critical 200-day SMA of $2,012. Moving southward, the 2024 low of $1,984 (February 14) is followed by the December 2023 bottom of $1,973 (December 13) and the November 2023 low of $1,931 (November 13). Failure in this position may cause the metal to test its October 2023 low of $1,810 (October 6), followed by the 2023 bottom of $1,804 (February 28) and the important $1,800 conflict zone.
Resistance levels: $2,398 $2,431 (4H chart)
Support levels: $2,324 $2,267 $2,228 (4H chart)
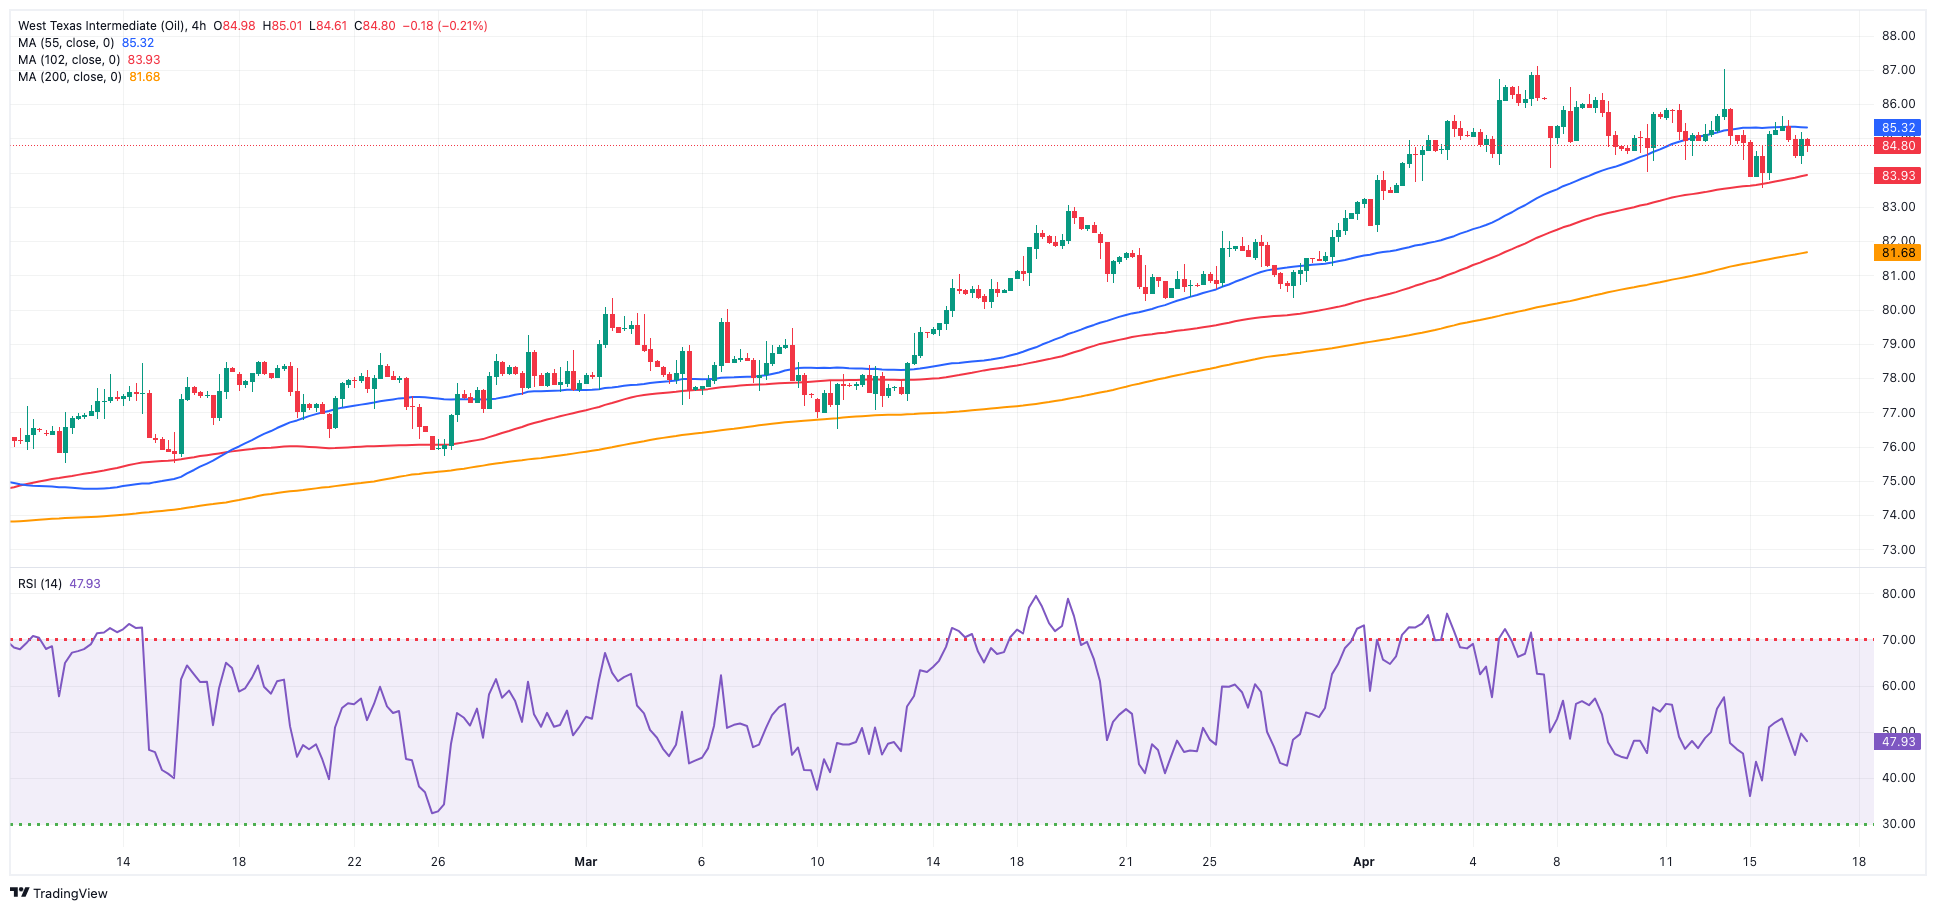
CRUDE WTI
Prices of WTI experienced a minor decline on Tuesday as economic challenges counteracted the boost from the US announcement of intentions to impose new sanctions on Iran following the latter's weekend attack on Israel.
In addition, a pessimistic outlook for global oil demand growth presented in the IEA's monthly report recently published, along with concerns about the pace of US interest rate cuts, seem to have also collaborated with the downward bias in the commodity.
Meanwhile, traders are expected to shift their attention to the release of the EIA’s weekly report on US crude oil inventories on Wednesday.
The next upward challenge for WTI is the 2024 peak of $87.60 (April 12), which precedes the weekly high of $89.83 (October 18, 2023) and the 2023 top of $94.99 (September 28, 2023). Further north, the weekly top of $97.65 (August 30) falls just short of the psychological $100.00 level. The nearest downward hurdle is the weekly low of $84.08 (April 15), followed by another weekly low of $80.33 (March 21). Further south are the 200-day SMA at $79.70 and the February low of $71.43 (February 5). A breakdown of this region might bring the critical $70.00 barrier back into view before the 2024 low of $69.31 (January 3) and the December 2023 low of $67.74 (December 13).
Resistance levels: $87.60 $89.82 $94.99 (4H chart)
Support levels: $84.02 $82.58 $80.51 (4H chart)
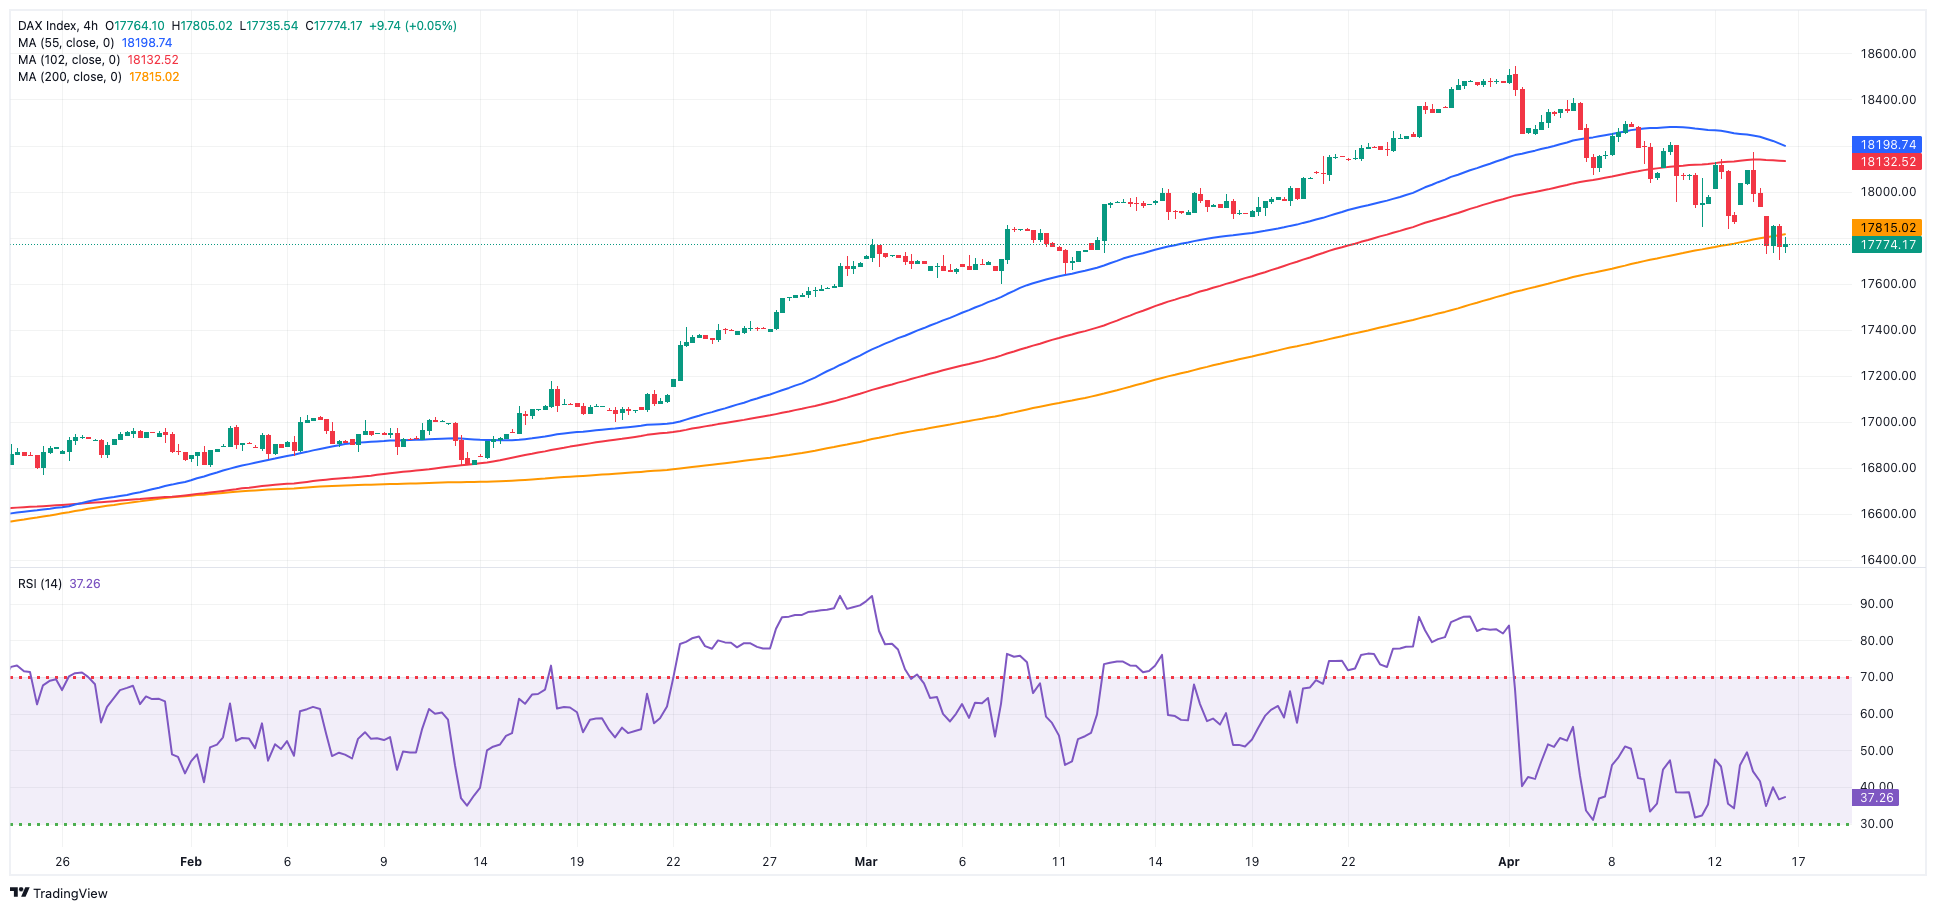
GER40
On Tuesday, European main stock indices navigated a “sea of red”. The generalized losses were primarily driven by poor performance of the mining and banking sectors, while investors’ aversion to risky assets also heightened due to increased tensions in the Middle East.
That said, Germany reference DAX40 receded to a new five-week low near the 17,700 zone, where some initial contention appears to have emerged.
In the meantime, market participants remained focused on interpreting the ECB’s hints at a potential interest rate cut over the summer, as suggested during the bank’s gathering last week along with recent comments from rate setters.
The daily pullback in the DAX40 also came in contrast to a decent uptick in 10-year bund yields past the 2.50% level.
The loss of the April low of 17,713 (April 16) may cause the DAX40 to challenge the March low of 17,619 (March 7), which appears to be supported by the provisional 55-day SMA of 17,638. A drop below the latter might bring the February low of 16,821 (February 1) back into view, ahead of the critical 200-day SMA of 16,383 and the 2024 bottom of 16,345 (January 17). After dropping below the latter, the weekly low of 15,915 (November 28) might be tested, followed by the October low of 14,630 (October 23) and the 2023 low of 14,458 (March 20). On the flip side, the next level of resistance is the record high of 18,567 (April 2). The daily RSI plummeted to around 41.
Best Performers: Fresenius SE, Beiersdorf AG, Covestro
Worst Performers: Dr Ing hc F Porsche Prf, BMW ST, Heidelbergcement
Resistance levels: 18,190 18,427 18,567 (4H chart)
Support levels: 17,713 17,619 17,468 (4H chart)
GBPJPY
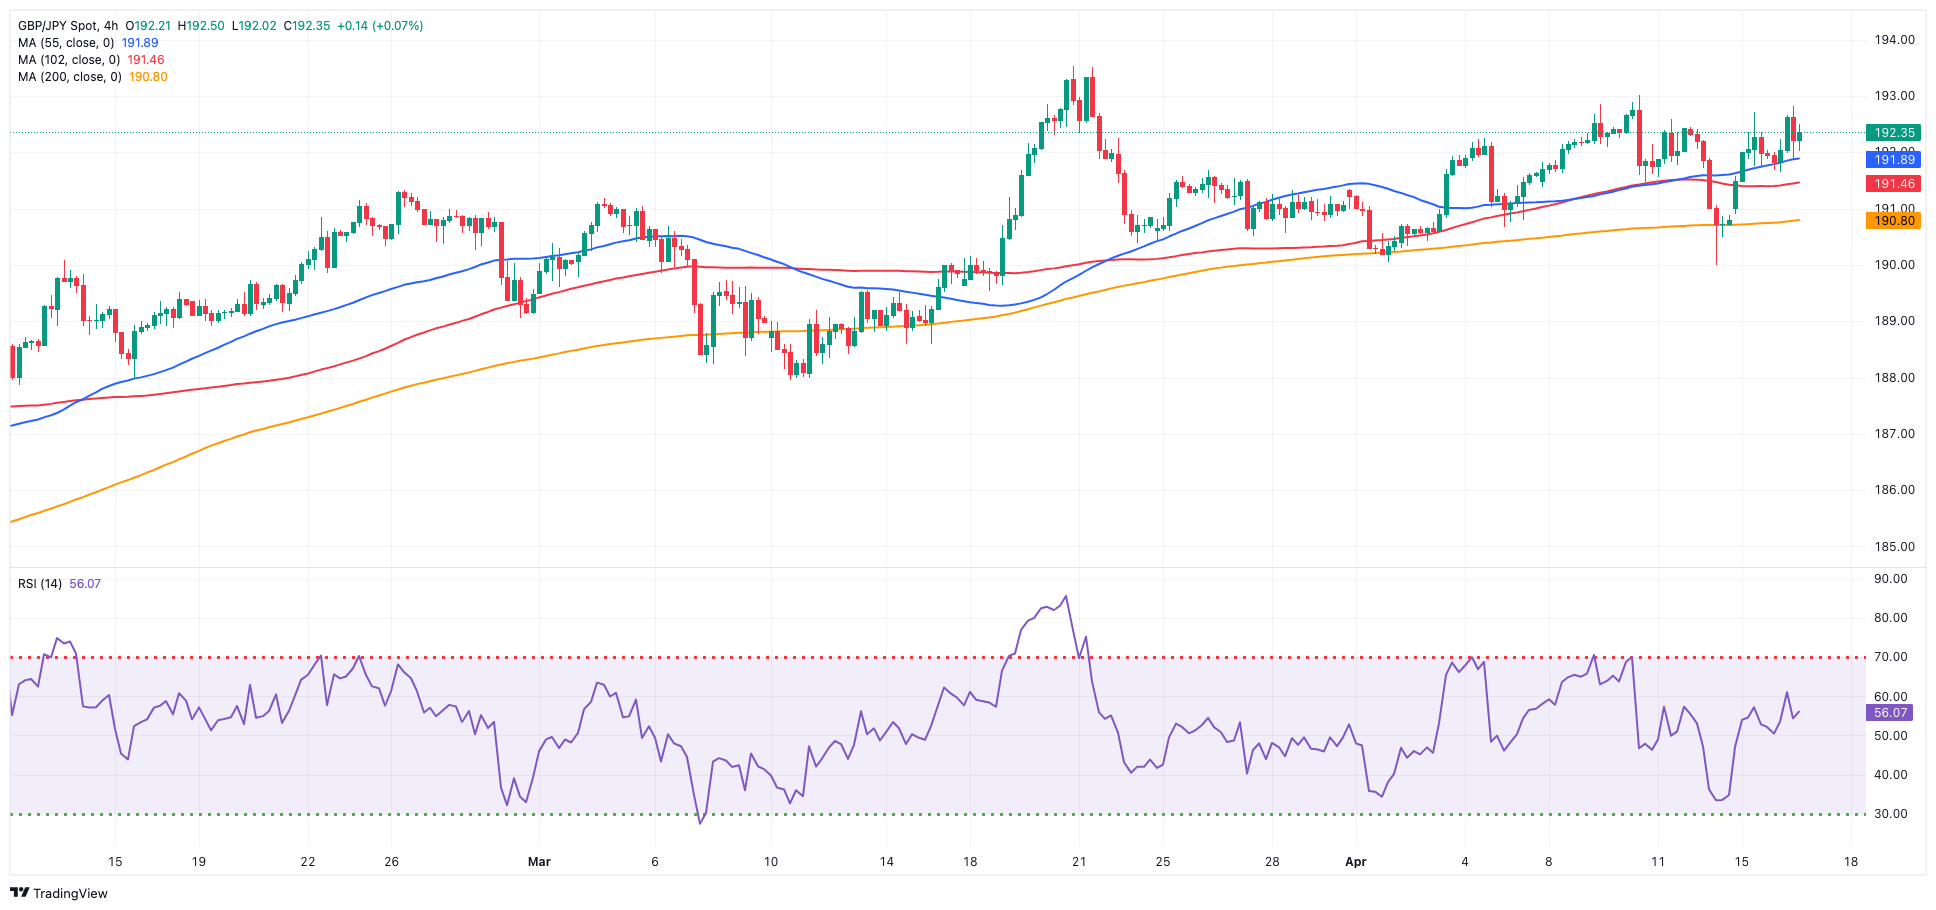
Additional weakness in the Japanese yen fueled extra gains in GBP/JPY, enabling it to once again trespass the 192.00 yardstick and extend its promising start to the week.
The daily uptrend in the cross came in tandem with a muted price action in sterling and vacillating developments in the greenback.
Currently, downward movements in GBP/JPY appear to be limited around the 190.00 level, while yearly highs in the mid-193.00s present obstacles to immediate further upward movement.
If GBP/JPY falls below the April low of 189.99 (April 12), it may test the March low of 187.96 (March 11), before the intermediate 100-day SMA of 187.49. Down from here comes the 200-day SMA of 185.41 prior to the February low of 185.22 (February 1). A deeper retracement is expected to challenge the December 2023 bottom of 178.33 (December 14). In the opposite direction, early resistance is seen at the April high of 192.97 (April 10) before the 2024 top of 193.53 (March 20). The breakout of this level might see the August 2015 peak of 195.28 (August 18), followed by the record high of 195.88 (June 24, 2015). The daily RSI improved to around 57.
Resistance levels: 192.81 192.97 193.53 (4H chart)
Support levels: 190.78 189.99 189.54 (4H chart)
NASDAQ
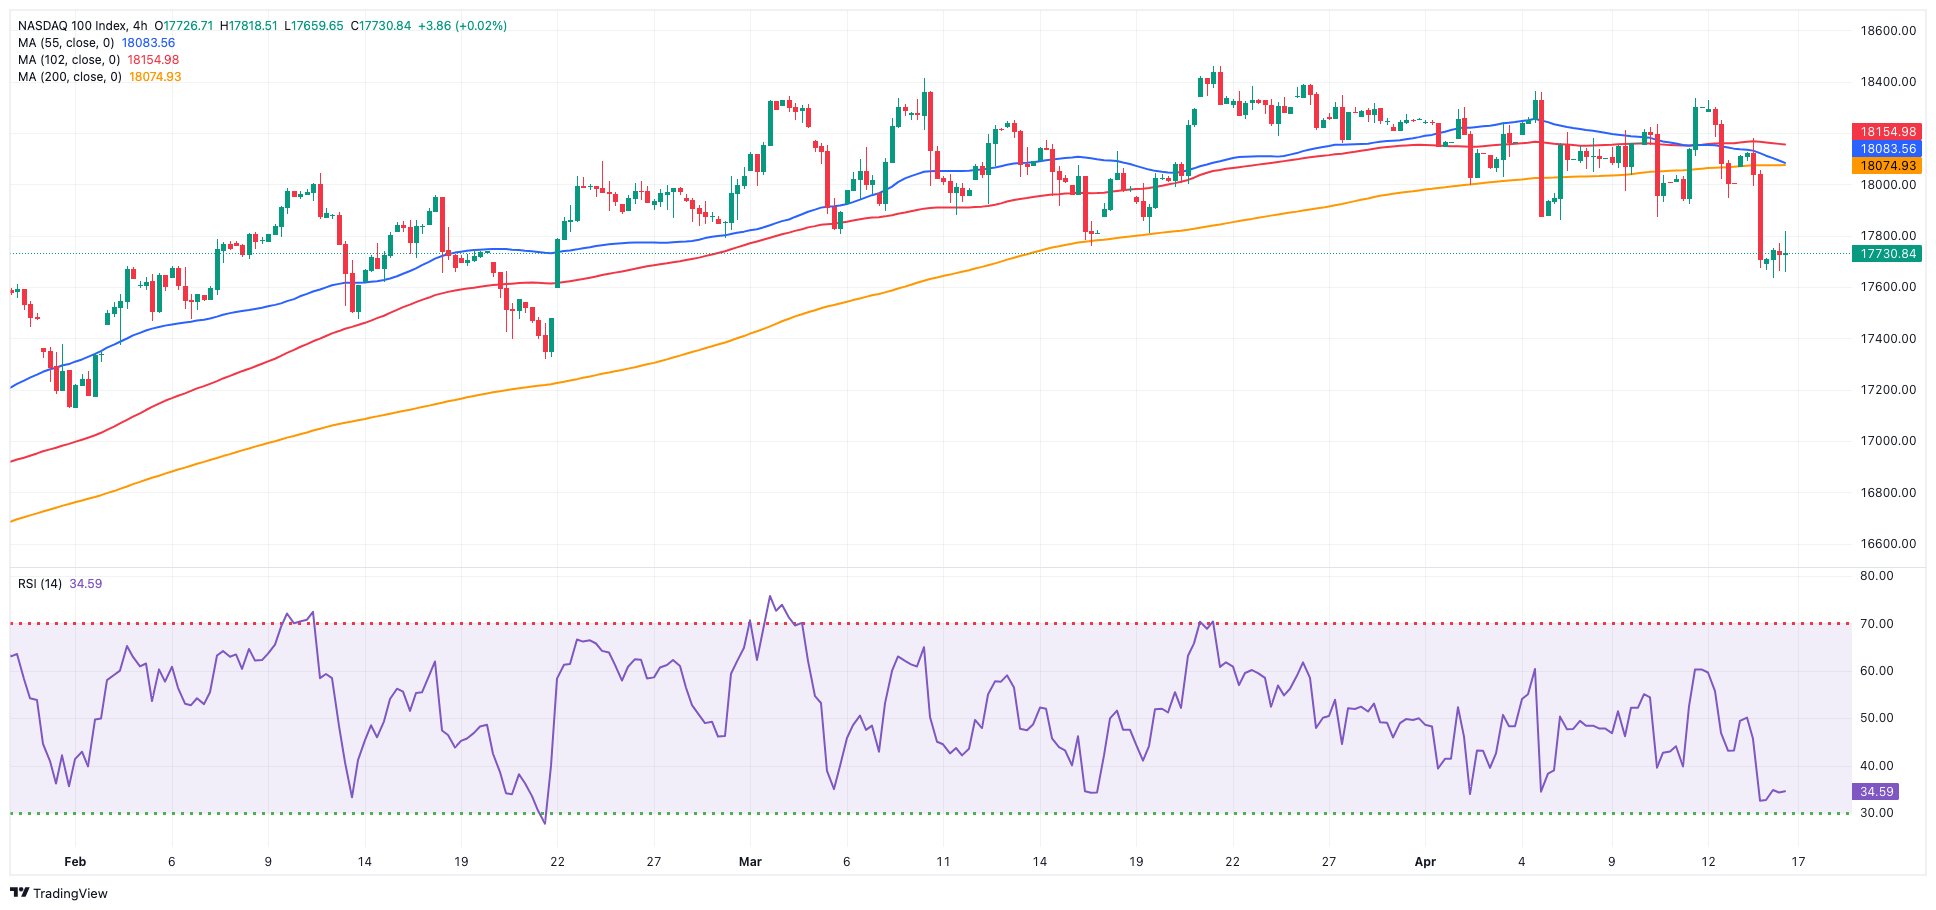
The US tech sector struggled for direction after two consecutive sessions of losses on turnaround Tuesday, motivating the reference Nasdaq 100 to navigate the area of two-month lows around 17,700.
Indeed, the index traded without a clear direction against the backdrop of the broad-based risk aversion mood, while geopolitical concerns and the tighter-for-longer narrative around the Fed also weighed on sentiment.
Extra losses might potentially return to the weekly low of 17,319 (February 21), which appears underpinned by the provisional 100-day SMA of 17,320 and comes ahead of another weekly low of 17,128 (January 31). If the latter is broken, a challenge to the 2024 low of 16,249 (January 5) may emerge, ahead of the crucial 200-day SMA of 16,234 and the December 2023 low of 15,695 (December 4). Additional losses from here may return to the October 2023 level of 14,058 (October 26), which comes before the April 2023 low of 12,724 (April 25) and the March 2023 low of 11,695 (March 13). If bulls regain the initiative, the next up obstacle appears at the all-time high of 18,464 (March 21). The daily RSI dropped below 42.
Top Gainers: GlobalFoundries, AMD, KLA Corp
Top Losers: Warner Bros Discovery, Tesla, Illumina
Resistance levels: 18,337 18,464 (4H chart)
Support levels: 17,660 17,319 17,128 (4H chart)
DOW JONES
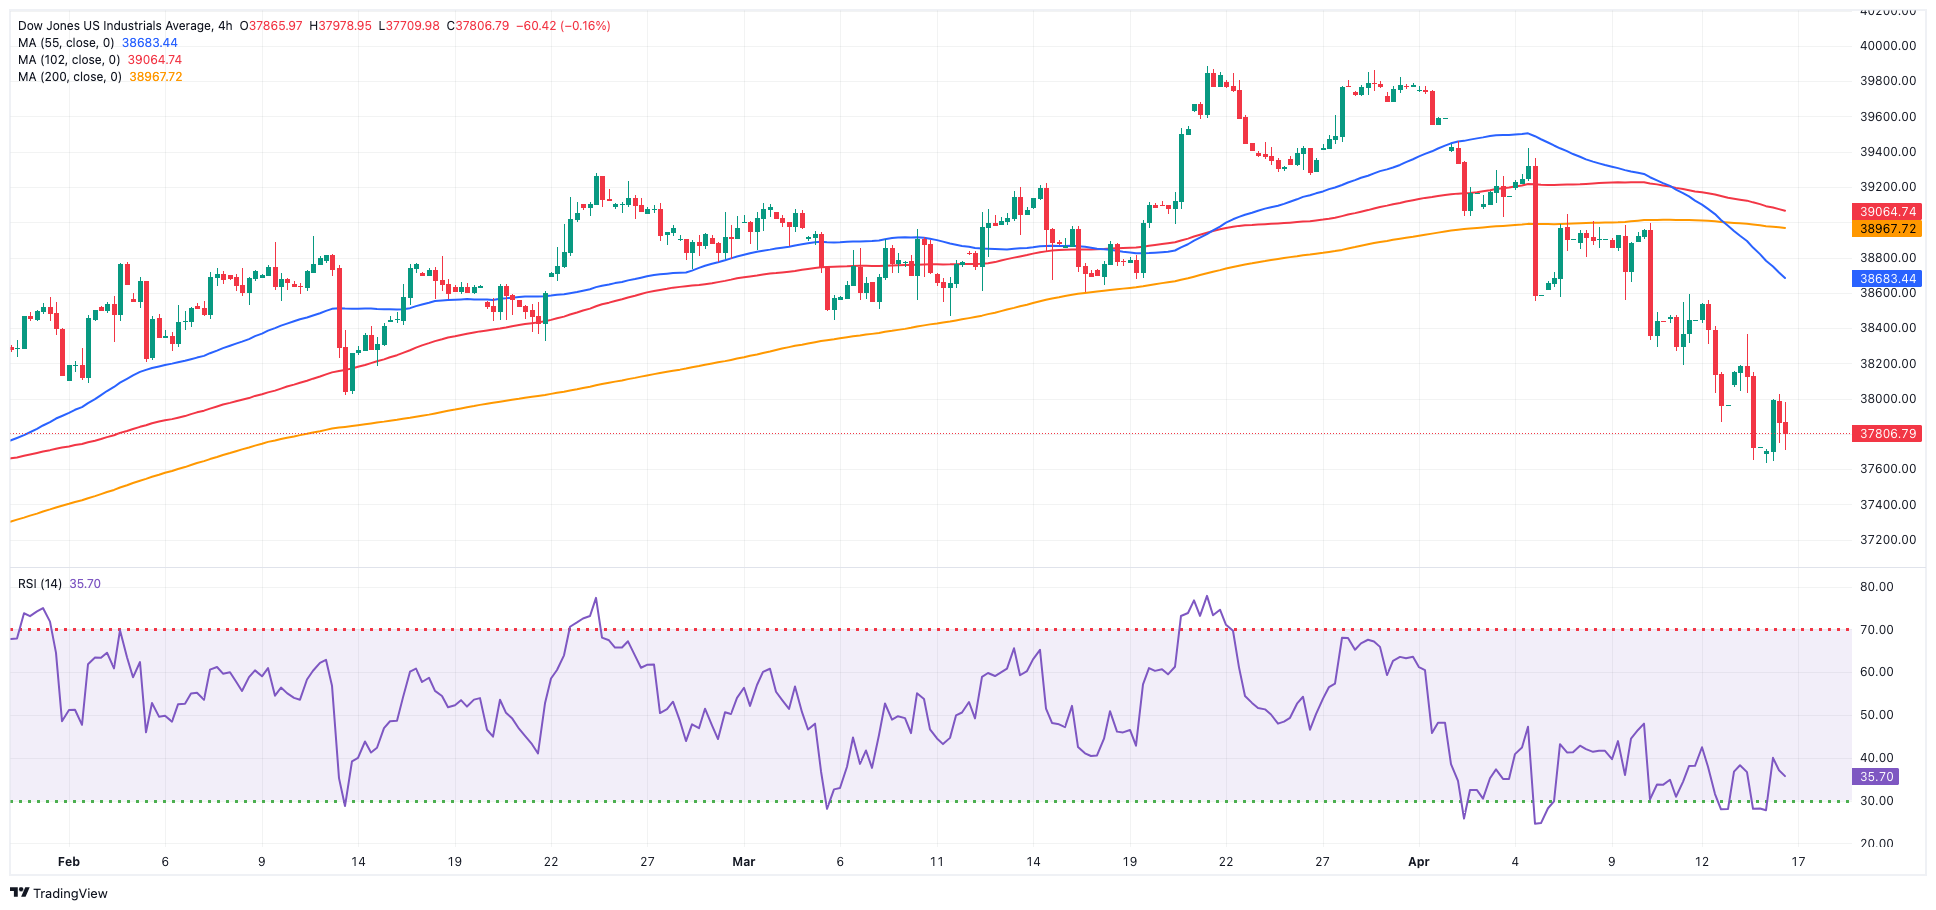
Finally, some respite for the reference Dow Jones came on Tuesday as investors digested the better-than-expected results from health insurance giant UnitedHealth.
In the meantime, the Dow Jones managed to snap six consecutive sessions of losses, bouncing off Monday’s multi-week lows near the 37,600 zone against the backdrop of increasing geopolitical tensions, a move higher in US yields, and expectations surrounding a later-than-anticipated Fed move on rates.
On Tuesday, the Dow Jones rose 0.04% to 37,749, the S&P 500 dropped 0.31% to 5,045, and the tech-benchmark Nasdaq Composite advanced 0.36% to 15,940.
If the selling pressure continues, the Dow Jones might test the 2024 low of 37,122 (January 18), before reaching the critical 200-day SMA at 36,162. The weekly low of 33,859 (November 7, 2023) is next, followed by the October 2023 low of 32,327 (October 27), all before the 2023 bottom of 31,429 (March 15). The other way around, the next upward hurdle is the interim 55-day SMA of 38,818 ahead of the record high of 39,889 on March 21. The daily RSI settled around 31.
Top Performers: UnitedHealth, Salesforce Inc, IBM
Worst Performers: J&J, Apple, Honeywell
Resistance levels: 38,598 39,421 39,889 (4H chart)
Support levels: 37,657 37,122 36,010 (4H chart)
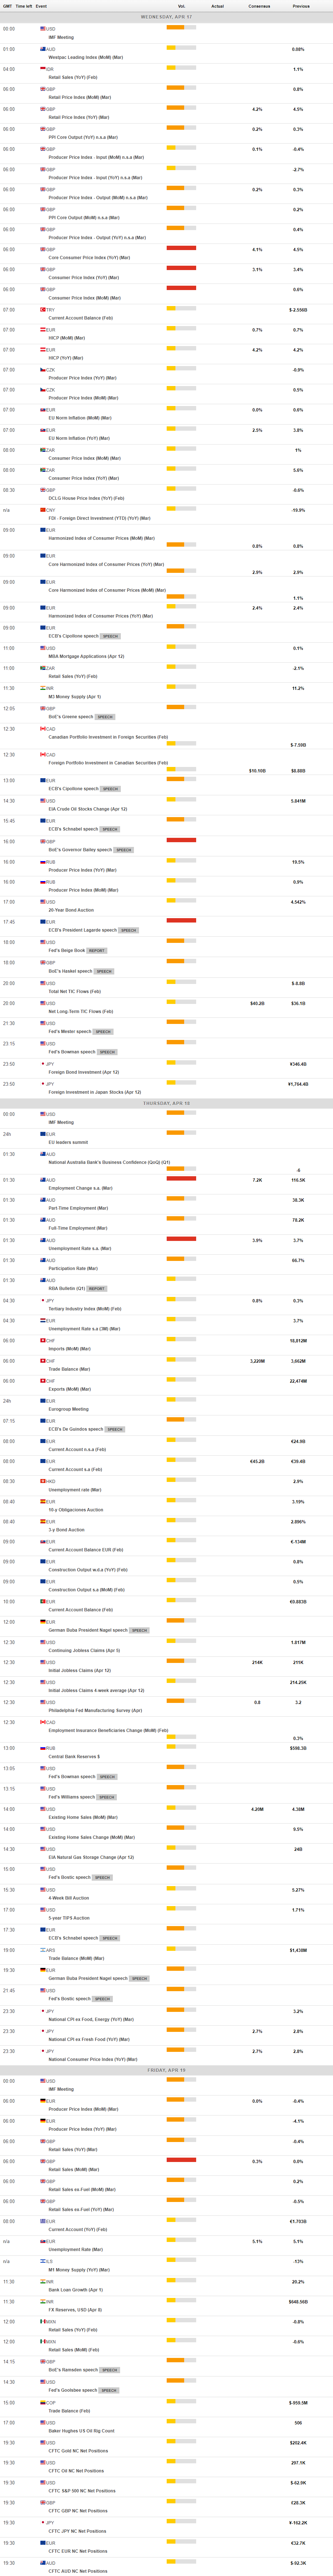
MACROECONOMIC EVENTS
All Information & Updates provided by:

All information relating to the financial markets available on this page has been prepared and issued by FXStreet (Forexstreet SL, Spain, Reg: B62498233) on the basis of publicly available information and all information believed to be reliable and does not conflict with Kuwaiti local laws, and all necessary care has been taken to before the company to ensure that the facts mentioned are correct from the source.
NCM Investment nor any of its directors or employees shall in any way be held responsible for the contents of this news, and the information contained on this page is intended only to provide clients with publicly available information and should not be construed as investment advice, report or analysis and/or constitute an offer or invitation to buy or sell financial instruments of any kind.
RISK WARNING: Forex and CFDs are highly risky leveraged products, as losses can exceed deposits. Please ensure you understand all the risks and take independent advice if necessary. NCM will segregate the clients based on the criteria of the regulator and its bylaws. NCM does not provide any advisory service; the material published does not constitute advice or a recommendation for a transaction in any financial instrument. NCM accepts no responsibility for any use of the content presented and any consequences of that use. Anyone acting on the information provided does so at their own risk.