
- Contact Us:
-

-

-

-


Daily Market Updates
18 Apr 2024
EURUSD
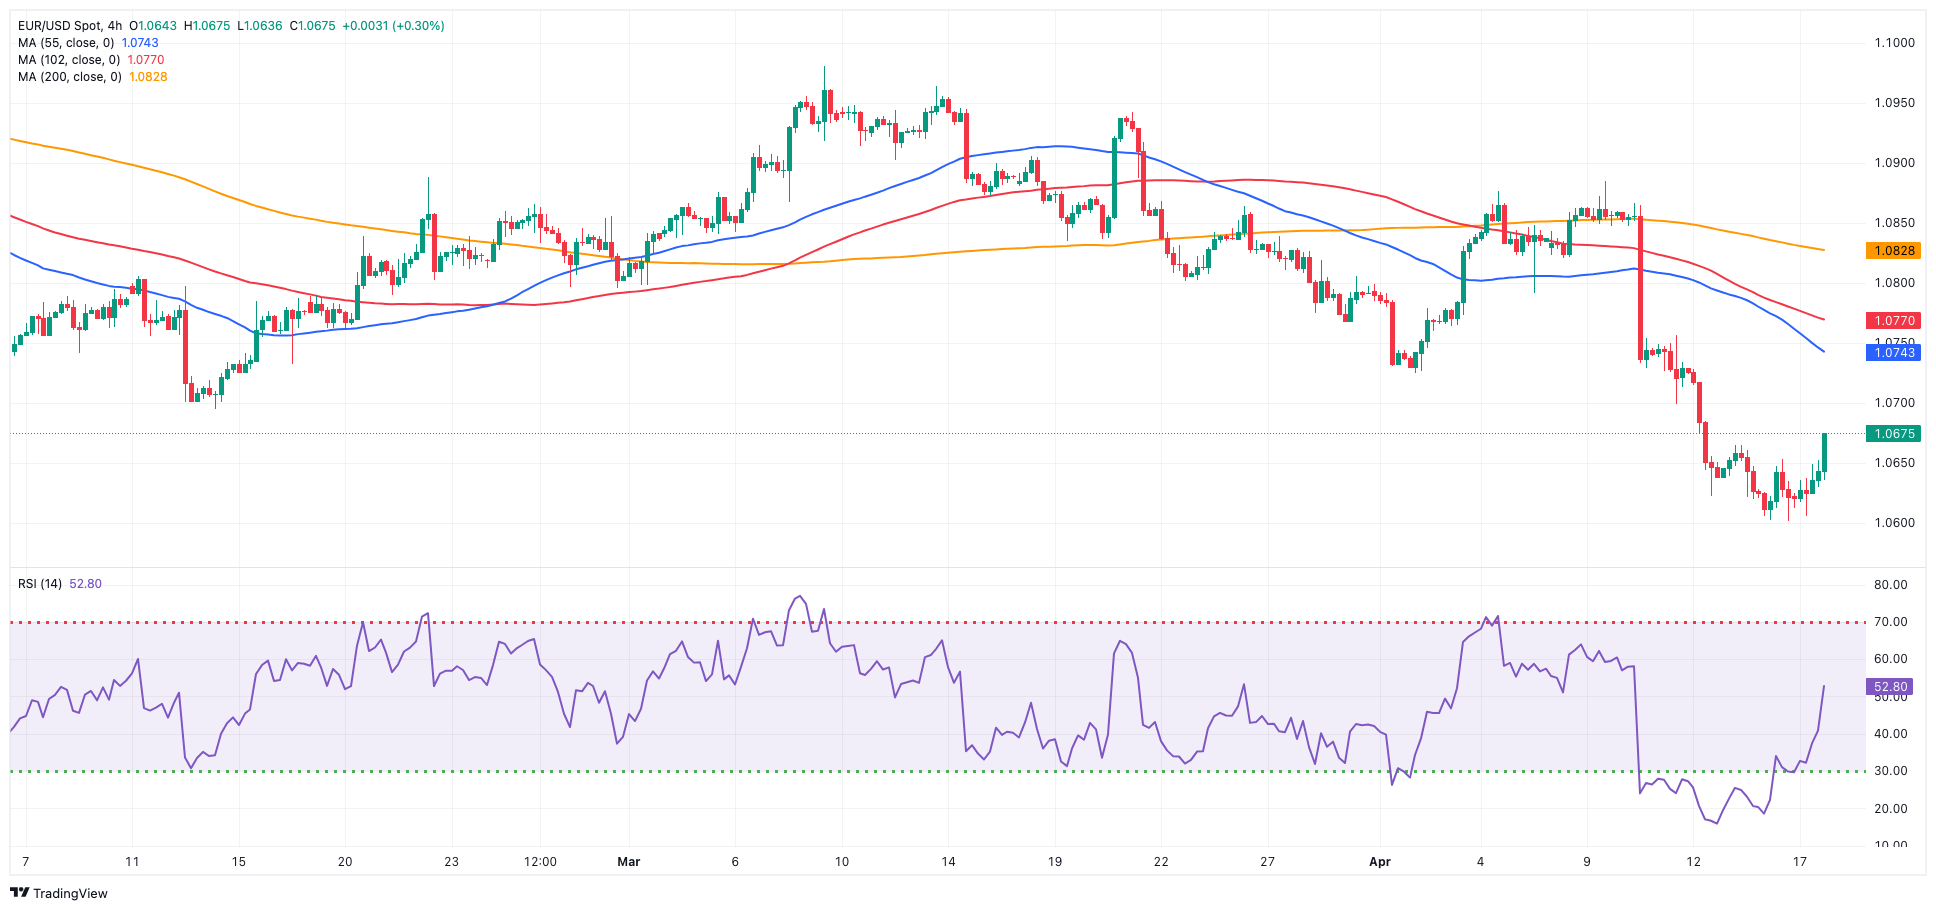
A considerable relief in the risk complex saw EUR/USD reverse six consecutive daily pullbacks and flirt with 1.0680 on Wednesday, all after bottoming out in a new 2024 low around 1.0600 recorded on April 16.
Around the greenback, the USD Index (DXY) came under pressure after hitting fresh multi-month tops past 106.50 in the previous session. The corrective decline in the dollar was accompanied by declining US yields across the curve and an intense sentiment towards risk-associated assets, all amidst an unchanged monetary policy backdrop that expects the Fed to reduce its interest rates at some point in Q4.
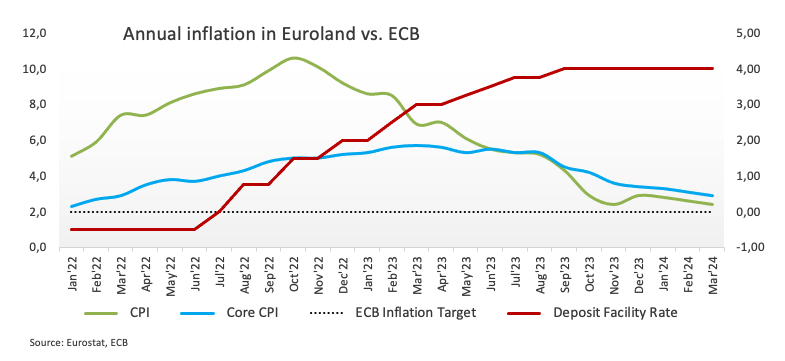
In the meantime, dovish comments from ECB rate setters continued to favour a rate cut in the summer. On this, the ECB's Holzmann warned against premature speculation on potential ECB cuts in 2024, citing differing inflation dynamics between Europe and the US. His colleague Cipollone observed a rapid decline in inflation, expecting a return to the 2% path next year and achieving the target by mid-2025. He added that if June and July data confirm this, easing restrictive measures in 2024 may be considered, noting that the Middle East conflict's impact on energy costs remains a significant risk factor.
On the docket, there were no surprises from the final Inflation Rate in the broad Euroland after the CPI rose by 2.4% in the year to March and 2.9% when it came to the Core CPI.
In the US, Mortgage Applications expanded by 3.3% in the week to April 12, while there was nothing new from the Fed Beige Book.
Extra losses in the EUR/USD may test the 2024 low of 1.0601 (April 16). A deeper slide might disclose a weekly low of 1.0495 (October 13, 2023), which precedes the 2023 low of 1.0448 (October 3) and the round milestone of 1.0400. The other way around, immediate resistance is found at the significant 200-day SMA of 1.0822, which precedes the weekly peak of 1.0885 (April 9) and the March high of 1.0981 (March 8). Up from here comes the weekly top of 1.0998 (January 5, 2011), just ahead of the important 1.1000 threshold. The breakout of this zone may put pressure on the December 2023 peak of 1.1139 (December 27), which is still supported by the 200-week SMA of 1.1138 and comes prior to the 2023 high of 1.1275 (July 18). The daily RSI bounced to around 33.
Resistance levels: 1.0677 1.0756 1.0826 (4H chart)
Support levels: 1.0601 1.0516 1.0495 (4H chart)
USDJPY
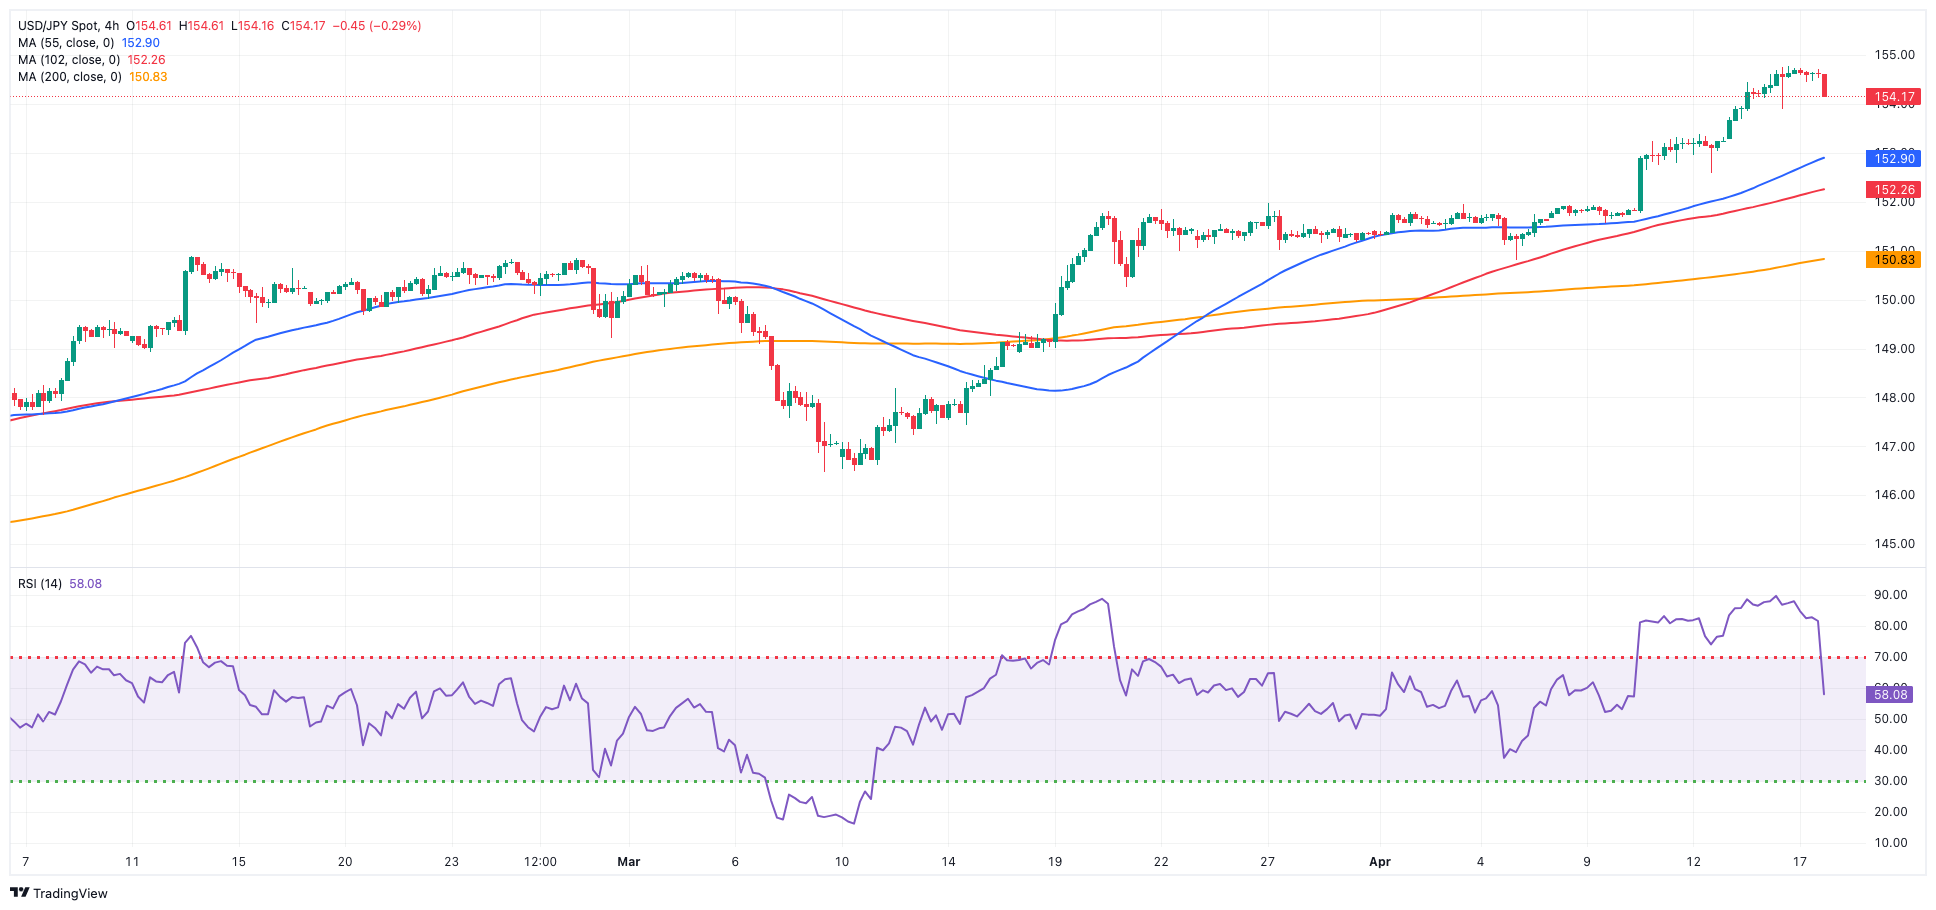
USD/JPY alternated gains with losses around the 154.70 zone in quite a narrow trading range on Wednesday.
Price action around spot came on the back of marginal gains in the dollar and a corrective retracement in US yields across different time frames, while JGB 10-year yields regained momentum and retested 0.88%.
Regarding the pervasive fear of intervention, Japan's Foreign Minister Hayashi emphasised the importance of currencies remaining stable in line with underlying fundamentals. He emphasised the close monitoring of FX movements and the willingness to take thorough measures if necessary. Additionally, he highlighted the need for closely monitoring FX developments.
The next upward hurdle for USD/JPY is the 2024 high of 154.78 (April 16), which comes before the June 1990 top of 155.80. Instead, the pair is projected to find initial support at the April low of 150.80 (April 5), with the 55- and 100-day SMAs at 150.40 and 148.05, respectively, providing temporary contention. The crucial 200-day SMA of 147.46 emerges below that zone, just before the March low of 146.47 (March 8). A breakdown of this zone might result in a return to the February low of 145.89 (February 1), which is prior to the December 2023 low of 140.24 (December 28), the round number 140.00, and the July low of 137.23 (July 14). The daily RSI eased a tad and remained above 78, suggesting an excessively overbought condition.
Resistance levels: 154.78 155.80 155.88 (4H chart)
Support levels: 153.88 152.58 150.80 (4H chart)
GBPUSD
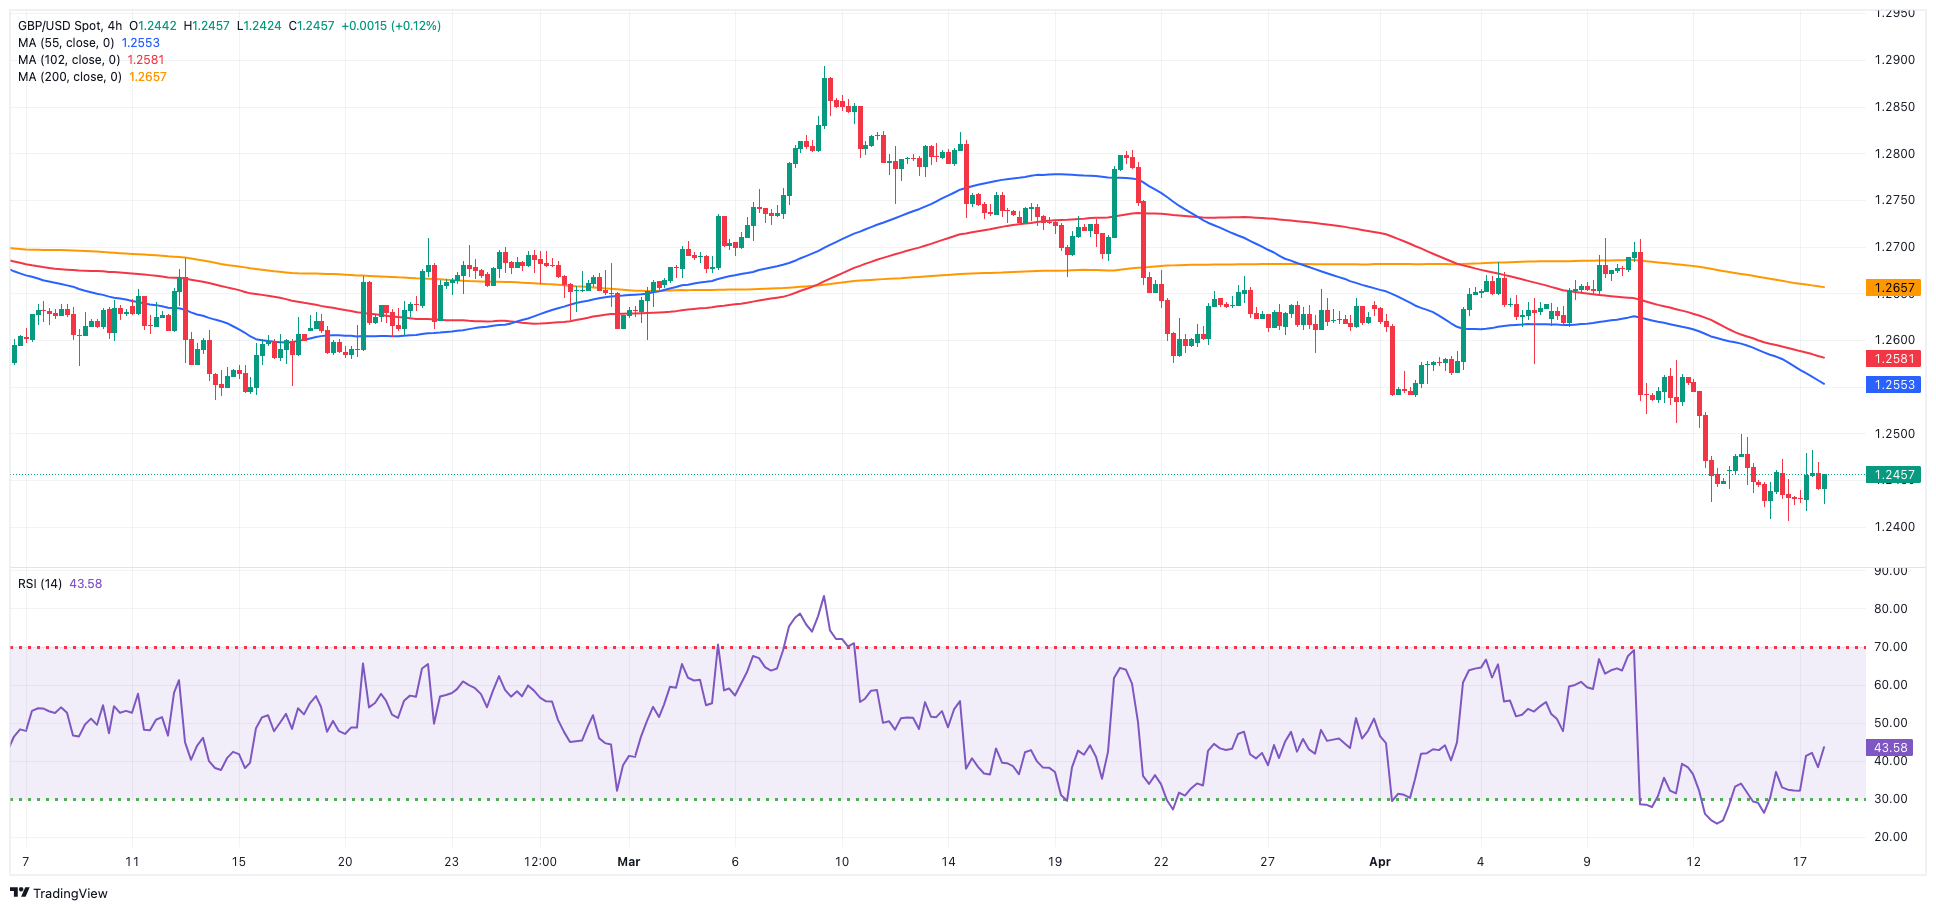
Further choppiness remained around the British pound midweek, lifting GBP/USD back to the 1.2480 zone, or two-day tops, on the back of marginal losses in the greenback.
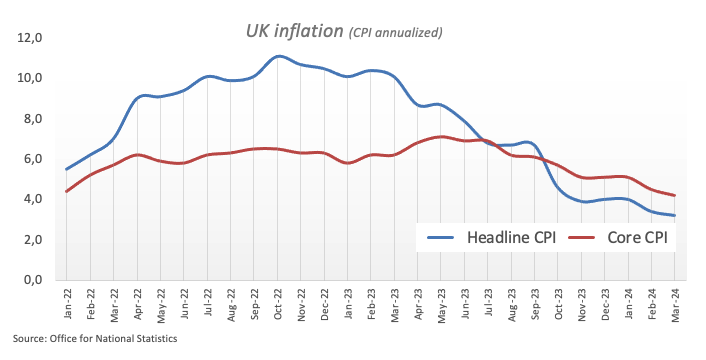
Cable picked up further pace after higher-than-expected UK inflation figures saw the CPI rise by 3.2% YoY in March and 4.2% when stripping food and energy costs. On this, expectations for BoE easing have been delayed, with the initial cut now anticipated in September instead of August, as assessed earlier this week. The likelihood of a second cut in December has decreased to 60%, down from being fully priced in at the beginning of the week.
On the monetary policy front, BoE’s M. Greene mentioned that we are nearer to our target compared to just a few months ago, so the recent news has been promising. However, developments in the Middle East do present a risk. There is concern about how an energy price shock or other supply-side shocks could impact inflation expectations.
Additionally, Bailey mentioned, that we're essentially following the trajectory we anticipated for inflation in February. He also anticipated a significant drop in next month's inflation figure.
In the meantime, UK 10-year gilt yields set aside two consecutive daily upticks after hitting fresh highs near 4.35%.
GBP/USD's immediate downward target is the 2024 low of 1.2405 (April 16). A deeper decline would not find major support until the weekly low of 1.2187 (November 10, 2023), which precedes the October 2023 low of 1.2037 and the main 1.2000 contention zone. On the other hand, the significant 200-day SMA of 1.2577 serves as the initial upward barrier, followed by the April high of 1.2709 (April 9), the weekly top of 1.2803 (March 21), and the 2024 peak of 1.2893 (March 8). Further north, the weekly high of 1.2995 (July 27, 2023) is just over the crucial 1.3000 yardstick. On the daily chart, the RSI rebounded past 35.
Resistance levels: 1.2498 1.2578 1.2656 (4H chart)
Support levels: 1.2405 1.2373 1.2187 (4H chart)
GOLD
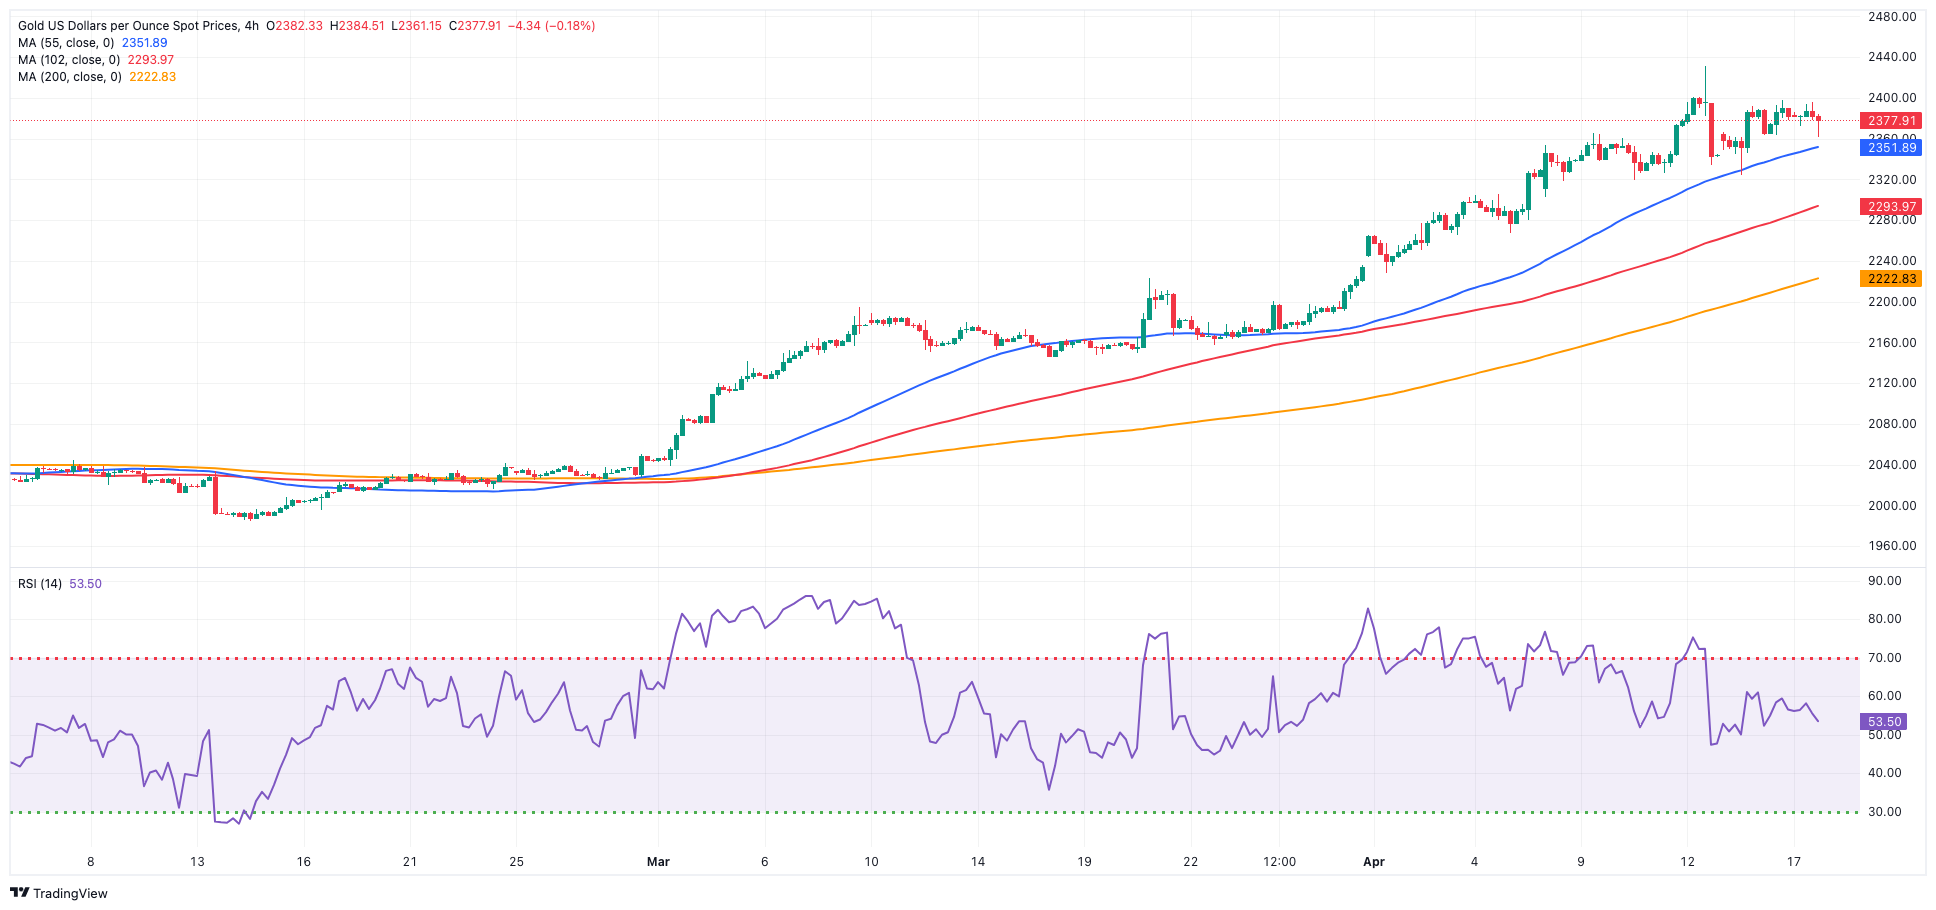
On Wednesday, Gold prices strengthened modestly due to persevering geopolitical unrest in the Middle East and remained underpinned by rising demand for safe-haven assets as well as by unabated purchases from central banks.
However, expectations of a US interest rate cut losing momentum and limited additional gains. This view was particularly reinforced after Chair Powell said on Tuesday that monetary policy needs to be restrictive for longer.
Gold is facing immediate resistance at its all-time high of $2,431 (April 12). Conversely, the weekly low of $2,146 (March 18) comes first, an area propped up by the preliminary 55-day SMA. The loss of the latter exposes a potential decline to the transitory 100-day SMA of $2,097, before the more important 200-day SMA of $2,015. Moving south, the 2024 low of $1,984 (February 14) is followed by the December 2023 low of $1,973 (December 13), and the November 2023 low of $1,931 (November 13). Failure in this position could drive the metal to test its October 2023 low of $1,810 (October 6), followed by the 2023 bottom of $1,804 (February 28) and the critical $1,800 conflict zone.
Resistance levels: $2,398 $2,431 (4H chart)
Support levels: $2,324 $2,267 $2,228 (4H chart)
CRUDE WTI
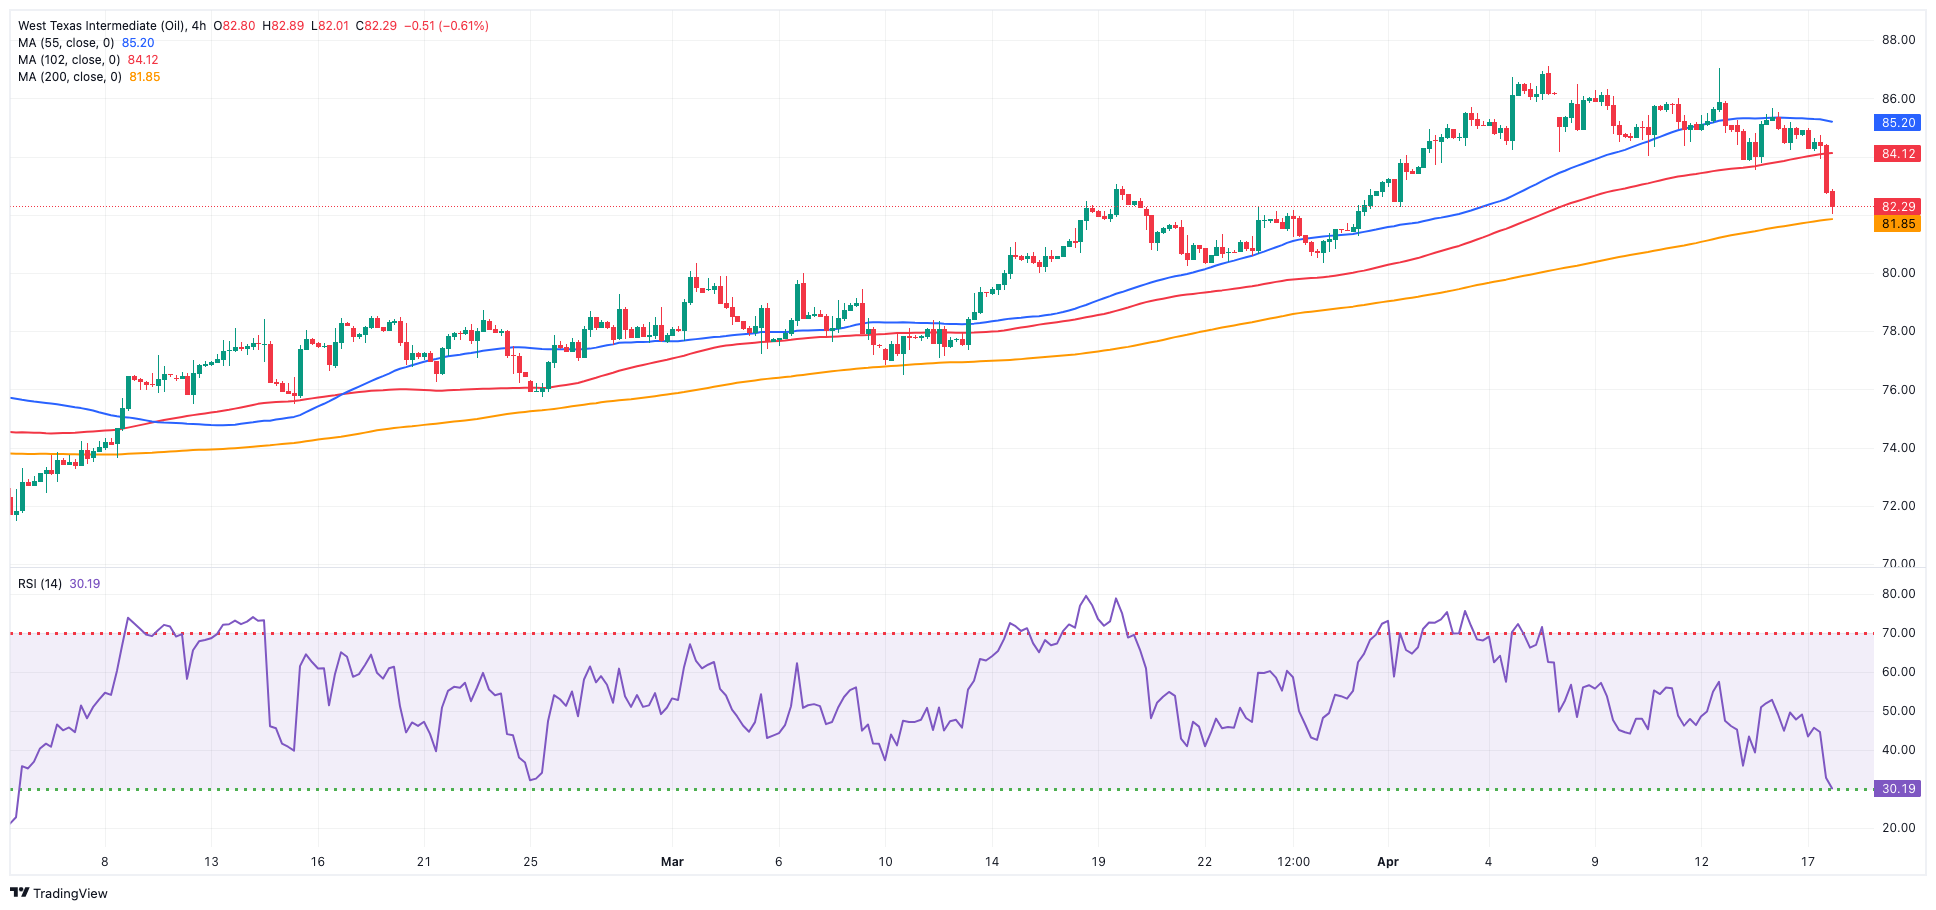
Prices of the American benchmark for sweet light crude oil retreated markedly after the unexpected increase in US crude oil inventories, according to the EIA’s weekly report. Indeed, the commodity slipped back to the vicinity of the $82.00 mark per barrel, reaching new monthly lows.
On the latter, the agency reported that US crude oil inventories increased by 2.735M barrels in the week to April 12, while supplies at Cushing rose by 0.033M barrels, Weekly Distillate Stocks shrank by 2.760M barrels, and gasoline stockpiles went down by 1.154M barrels.
The daily retracement in the commodity was influenced by a pessimistic forecast for global oil demand growth outlined in the IEA's latest monthly report, along with apprehensions regarding the pace of US interest rate reductions, while disheartening economic indicators from China and advancements in Ukraine and Israel aid bills in the US also collaborated with the sour mood.
Next on the downside for WTI comes the April low of $82.03 (April 17) seconded by the weekly low of $80.33 (March 21) and the key 200-day SMA at $79.74. Further south aligns the February low of $71.43 (February 5) prior to the important $70.00 barrier and the 2024 low of $69.31 (January 3). The breach of the latter exposes the December 2023 low of $67.74 (December 13). On the flip side, immediate barrier comes at the 2024 peak of $87.60 (April 12), before the weekly high of $89.83 (October 18, 2023) and the 2023 top of $94.99 (September 28, 2023). Further north, the weekly peak of $97.65 (August 30) is barely shy of the psychological $100.00 mark.
Resistance levels: $86.14 $87.60 $89.82 (4H chart)
Support levels: $82.03 $80.51 $76.76 (4H chart)
GER40
European shares rebounded on Wednesday following a sharp sell-off in the prior session, buoyed by robust quarterly earnings from consumer-related stocks. Additionally, investors remained cautious, monitoring developments in the Middle East.
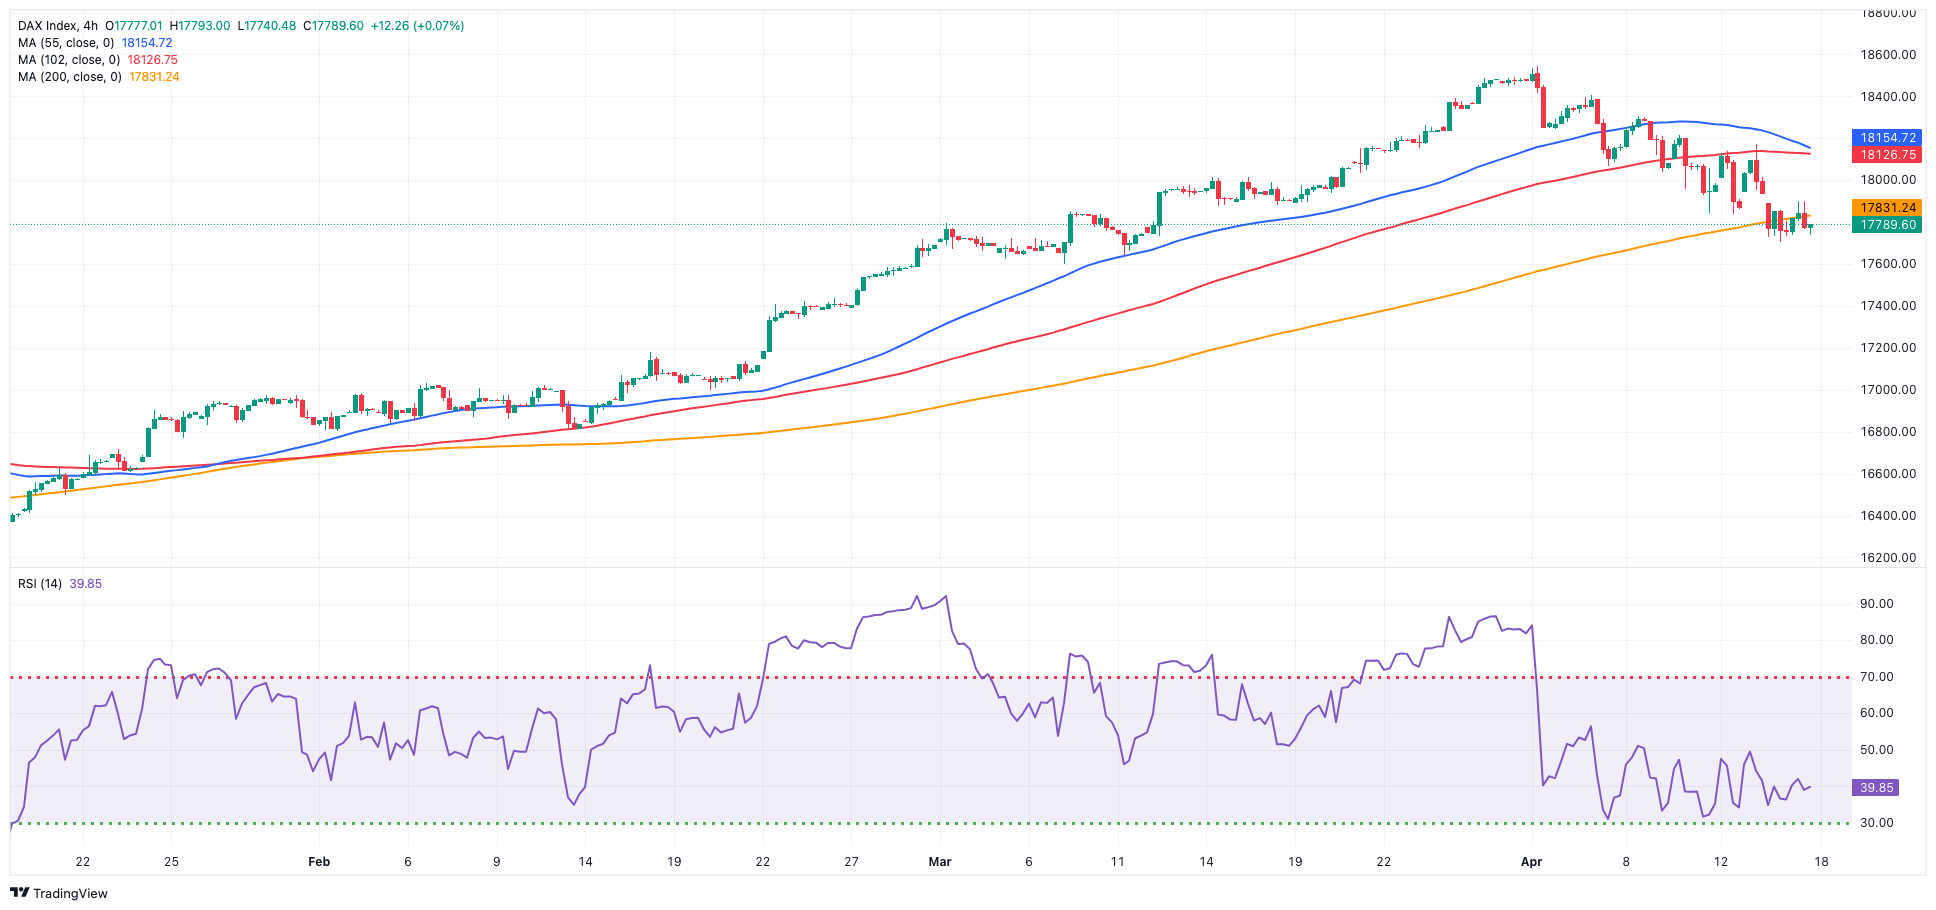
In fact, the German benchmark DAX40 ended the session barely changed near the 17,800 level, managing to regain some balance after Tuesday’s multi-week lows.
Meanwhile, market participants stayed attentive to deciphering hints from the ECB regarding a possible interest rate reduction over the summer after final inflation figures in the broader euro bloc confirmed the loss of momentum in consumer prices.
The muted price action in the DAX40 came in tandem with a small retracement in the 10-year bund yields to the sub-2.47% zone.
The loss of the April low of 17,713 (April 16) may prompt the DAX40 to challenge the March bottom of 17,619 (March 7), which appears to be supported by the provisional 55-day SMA of 17,653. A decline below the latter could bring the February low of 16,821 (February 1) back into focus, ahead of the important 200-day SMA of 16,392 and the 2024 bottom of 16,345 (January 17). After falling below the latter, the weekly low of 15,915 (November 28) might be tested, followed by the October low of 14,630 (October 23) and the 2023 low of 14,458 (March 20). On the upside, the next level of resistance is the record high of 18,567 (April 2). The daily RSI looked stable around 41.
Best Performers: Adidas, Siemens Energy AG, Commerzbank
Worst Performers: Continental AG, Merck, Sartorius AG VZO
Resistance levels: 18,190 18,427 18,567 (4H chart)
Support levels: 17,713 17,619 17,468 (4H chart)
GBPJPY
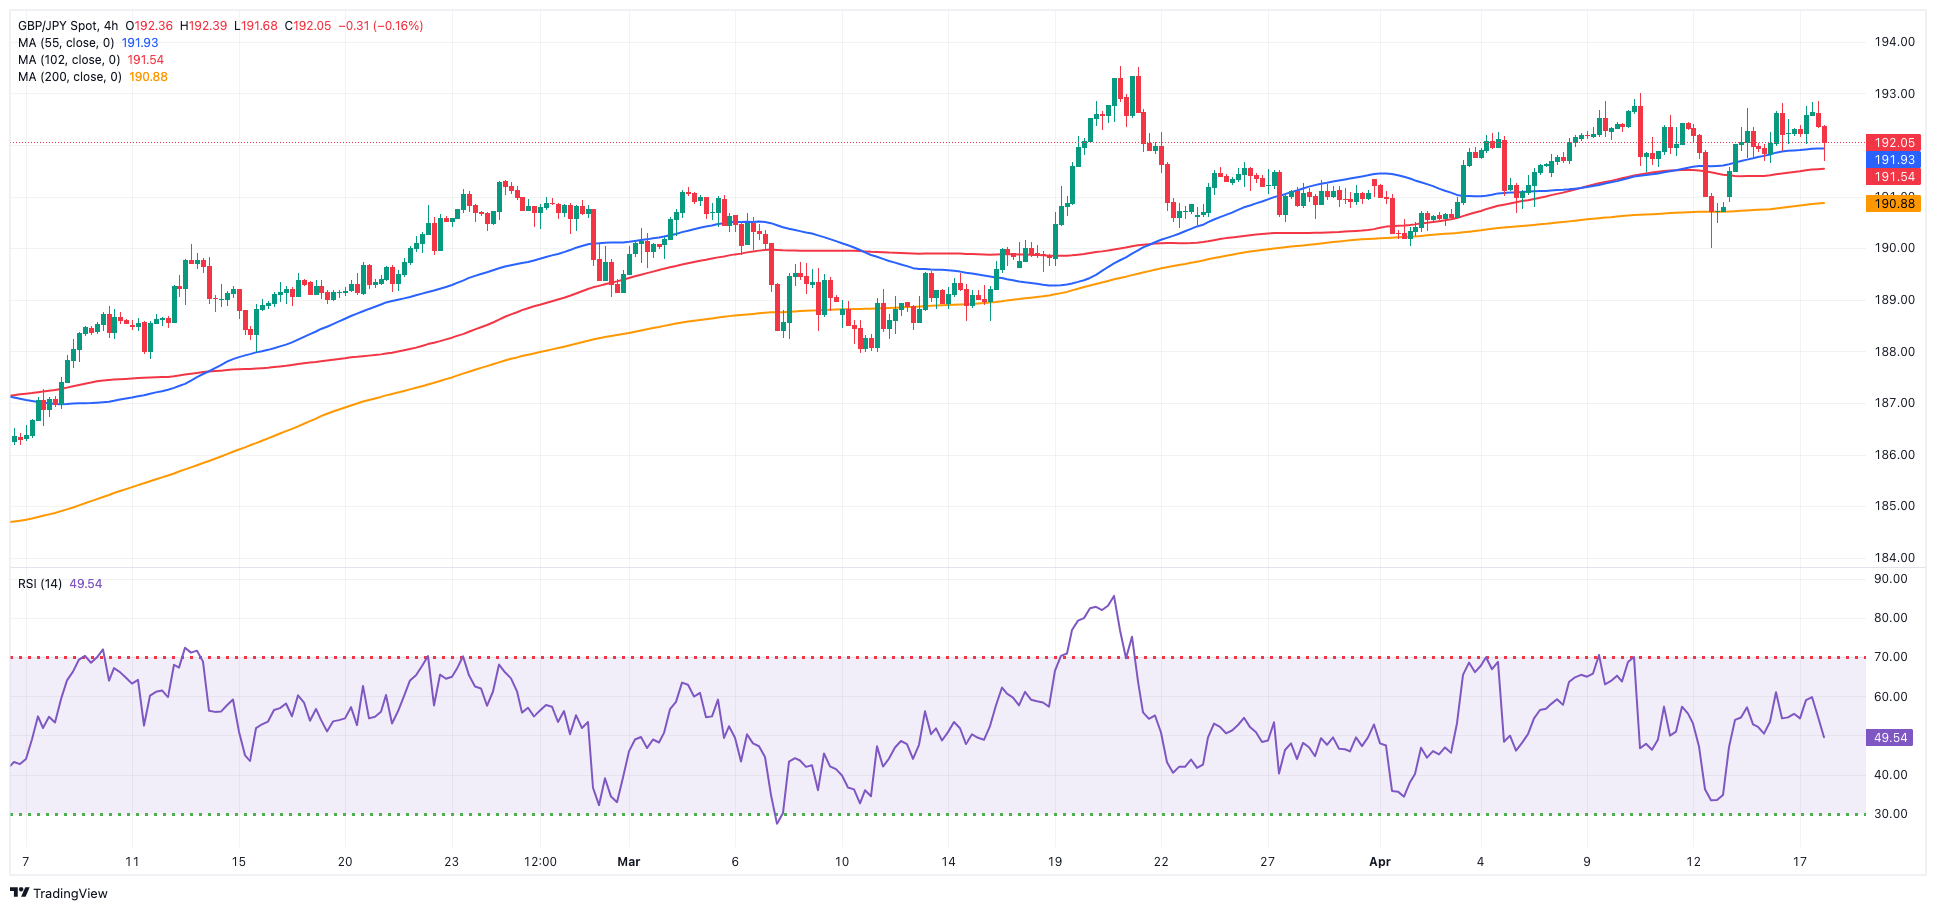
The weekly upward trend in GBP/JPY coincided with extra gains in the British pound amidst some corrective moves in the dollar, all sponsoring the third straight day of gains in the cross, which comes just short of the key 193.00 hurdle.
In the meantime, the subdued price action of the Japanese yen contributed to additional gains in the cross, which flirted with the area of monthly highs around the 193.00 region.
Presently, downward movements in GBP/JPY seem to be restricted around the 190.00 level, while reaching yearly highs in the mid-193.00s poses challenges for immediate further upward movement.
Further upside in GBP/JPY could revisit the April high of 192.97 (April 10) ahead of the 2024 top of 193.53 (March 20). The breakout of this level may result in a potential test of the August 2015 peak of 195.28 (August 18), followed by the record high of 195.88 (June 24, 2015). In the opposite direction, a breach of the April low of 189.99 (April 12), might prompt the cross to challenge the March low of 187.96 (March 11), which is before the intermediate 100-day SMA of 187.54. The 200-day SMA of 185.47 precedes the February low of 185.22 (February 1). A deeper retracement is projected to test the December 2023 low of 178.33 (December 14). The daily RSI increased to about 59.
Resistance levels: 192.81 192.97 193.53 (4H chart)
Support levels: 191.64 190.87 189.99 (4H chart)
NASDAQ
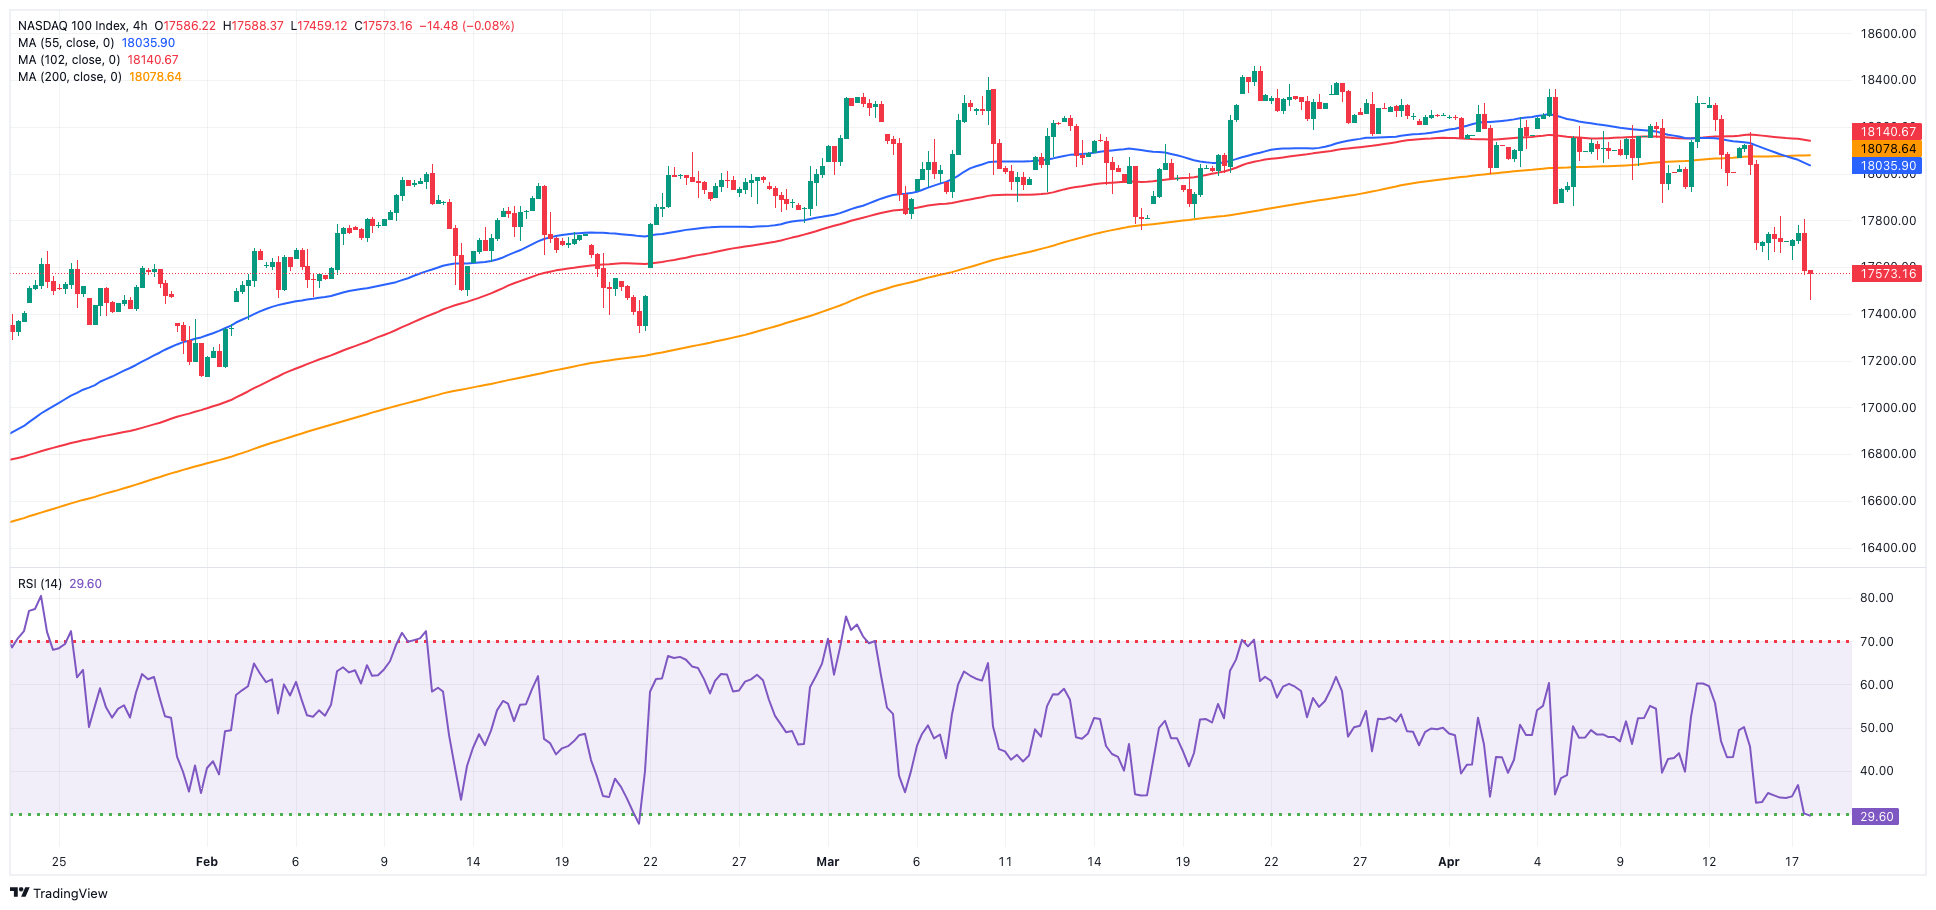
The bearish tone in the US tech sector gathered extra pace and dragged the reference Nasdaq 100 to a new two-month low in the sub-17,500 zone on Wednesday.
Once more, geopolitical worries and the Fed’s perspective of a prolonged tightening weighed on investor sentiment, although the dollar's retreat and decreasing US yields appear to have mitigated the downside to some extent.
Additionally, the underperformance of chip-related stocks added to the selling pressure.
Extra losses might likely revisit the weekly low of 17,319 (February 21), which appears to be supported by the provisional 100-day SMA and is ahead of another weekly low of 17,128 (January 31). If the latter is broken, a challenge to the 2024 low of 16,249 (January 5) could arise, ahead of the critical 200-day SMA of 16,246 and the December 2023 low of 15,695 (December 4). Additional losses from here may return to the October 2023 level of 14,058 (October 26), which is prior to the April 2023 low of 12,724 (April 25) and the March 2023 bottom of 11,695 (March 13). If the bulls regain the initiative, there is an interim hurdle at the 55-day SMA at 17,941 ahead of the all-time high of 18,464 (March 21). The daily RSI receded below 40.
Top Gainers: Regeneron Pharma, American Electric Power, Exelon
Top Losers: ASML ADR, Autodesk, Old Dominion Freight Line
Resistance levels: 18,337 18,464 (4H chart)
Support levels: 17,459 17,319 17,128 (4H chart)
DOW JONES
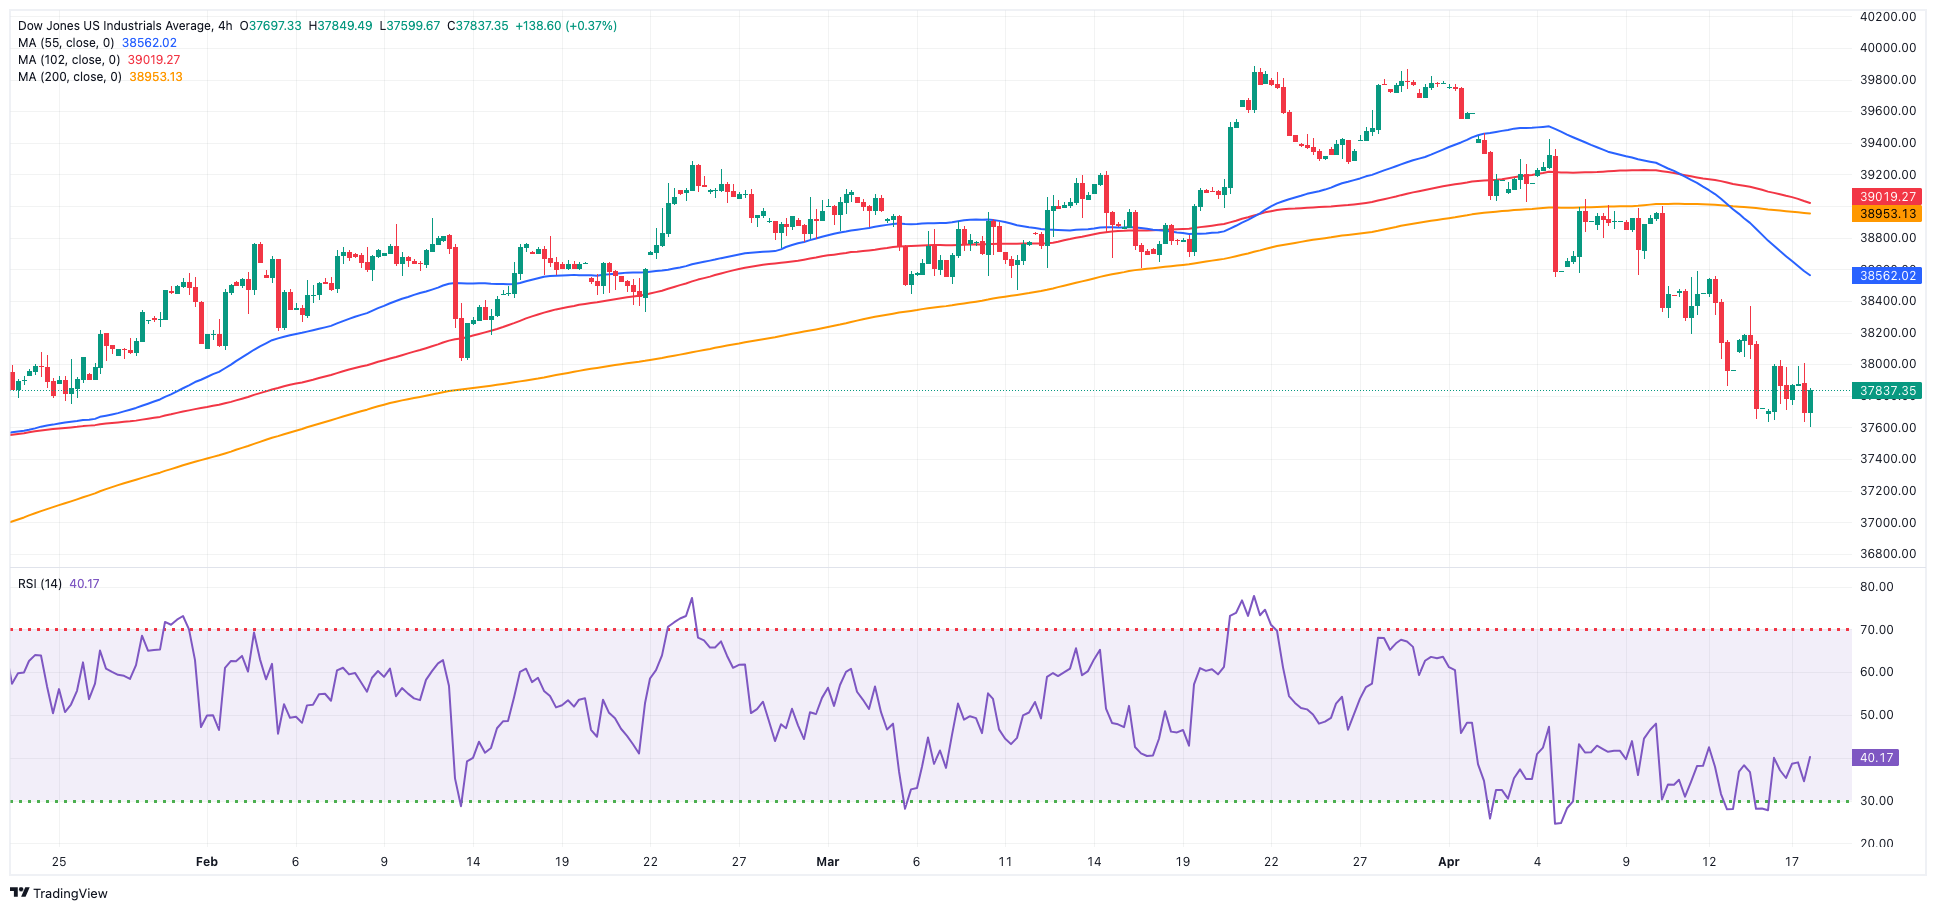
The Dow Jones traded within a narrow range on Wednesday, alternating gains with losses near the 37,800 region.
In the meantime, the index moved within a side-line theme amidst increasing geopolitical tensions, a corrective decline in the dollar, and expectations surrounding a later-than-anticipated Fed move on rates.
Also contributing to the dominating uncertainty among market participants were mixed results from corporate earnings reports.
All in all, the Dow Jones rose 0.02% to 37,799, the S&P 500 retreated 0.34% to 5,034, and the tech-heavy Nasdaq Composite dropped 0.71% to 15,753.
If the Dow Jones breaks below the April low of 37,611 (April 17) it may then target the 2024 low of 37,122 (January 18) before reaching the key 200-day SMA of 36,179. The weekly low of 33,859 (November 7, 2023) comes next, followed by the October 2023 low of 32,327 (October 27), all before the 2023 bottom of 31,429 (March 15). The other way around, the next upward obstacle is the interim 55-day SMA of 38,809 before the record high of 39,889 on March 21. The daily RSI settled at approximately 33.
Top Performers: UnitedHealth, Goldman Sachs, Nike
Worst Performers: Travelers, Intel, Caterpillar
Resistance levels: 38,598 39,421 39,889 (4H chart)
Support levels: 37,611 37,122 36,010 (4H chart)
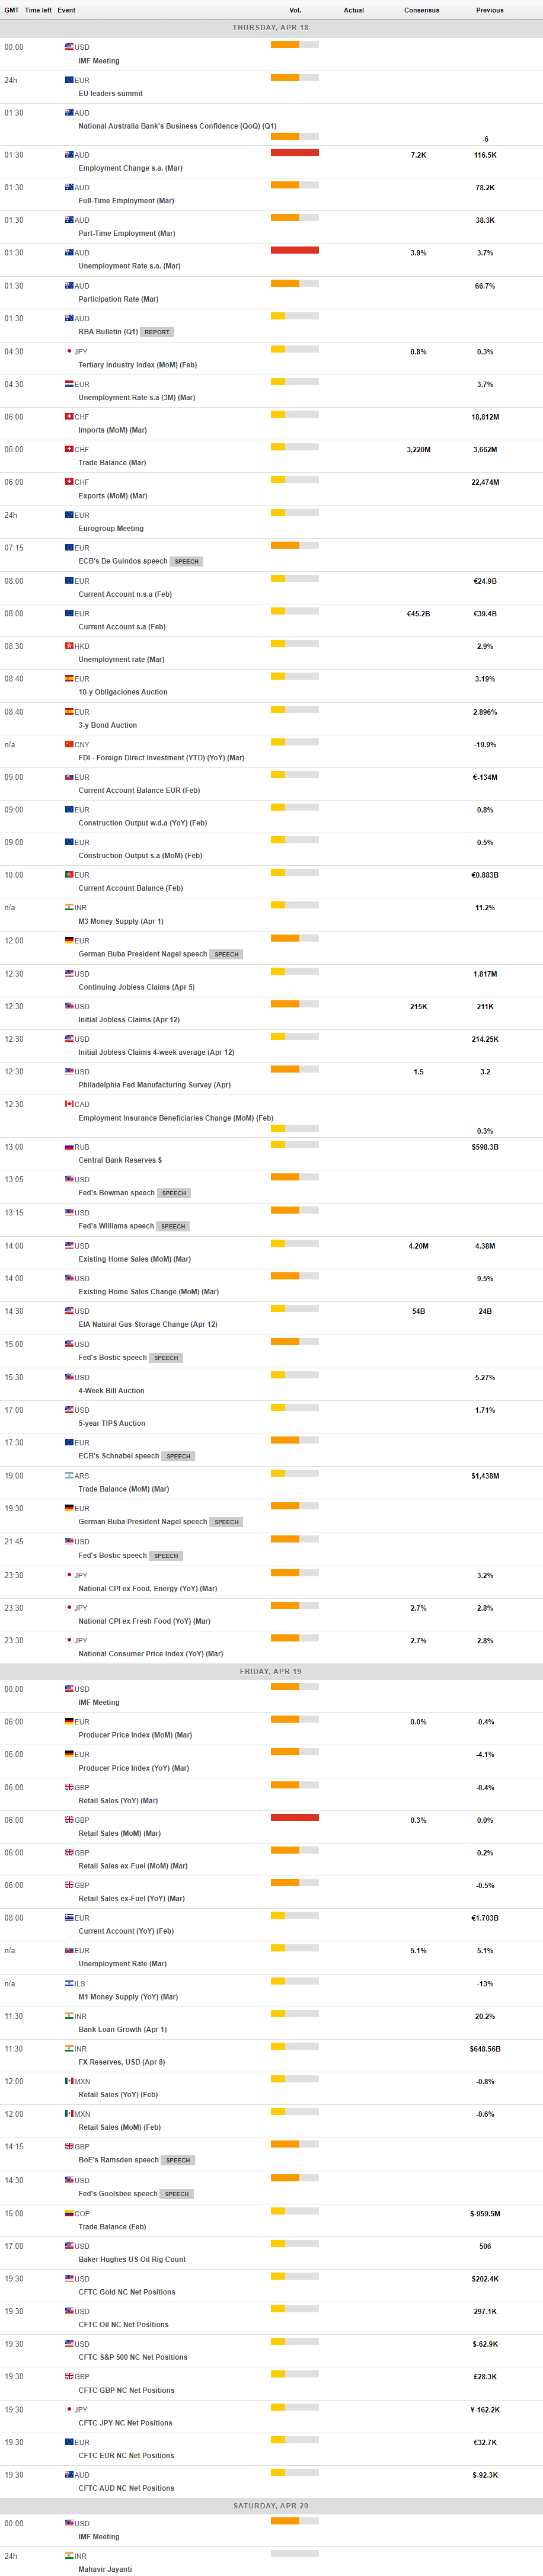
MACROECONOMIC EVENTS
All Information & Updates provided by:

All information relating to the financial markets available on this page has been prepared and issued by FXStreet (Forexstreet SL, Spain, Reg: B62498233) on the basis of publicly available information and all information believed to be reliable and does not conflict with Kuwaiti local laws, and all necessary care has been taken to before the company to ensure that the facts mentioned are correct from the source.
NCM Investment nor any of its directors or employees shall in any way be held responsible for the contents of this news, and the information contained on this page is intended only to provide clients with publicly available information and should not be construed as investment advice, report or analysis and/or constitute an offer or invitation to buy or sell financial instruments of any kind.
RISK WARNING: Forex and CFDs are highly risky leveraged products, as losses can exceed deposits. Please ensure you understand all the risks and take independent advice if necessary. NCM will segregate the clients based on the criteria of the regulator and its bylaws. NCM does not provide any advisory service; the material published does not constitute advice or a recommendation for a transaction in any financial instrument. NCM accepts no responsibility for any use of the content presented and any consequences of that use. Anyone acting on the information provided does so at their own risk.