
- Contact Us:
-

-

-

-


Daily Market Updates
19 Apr 2024
EURUSD
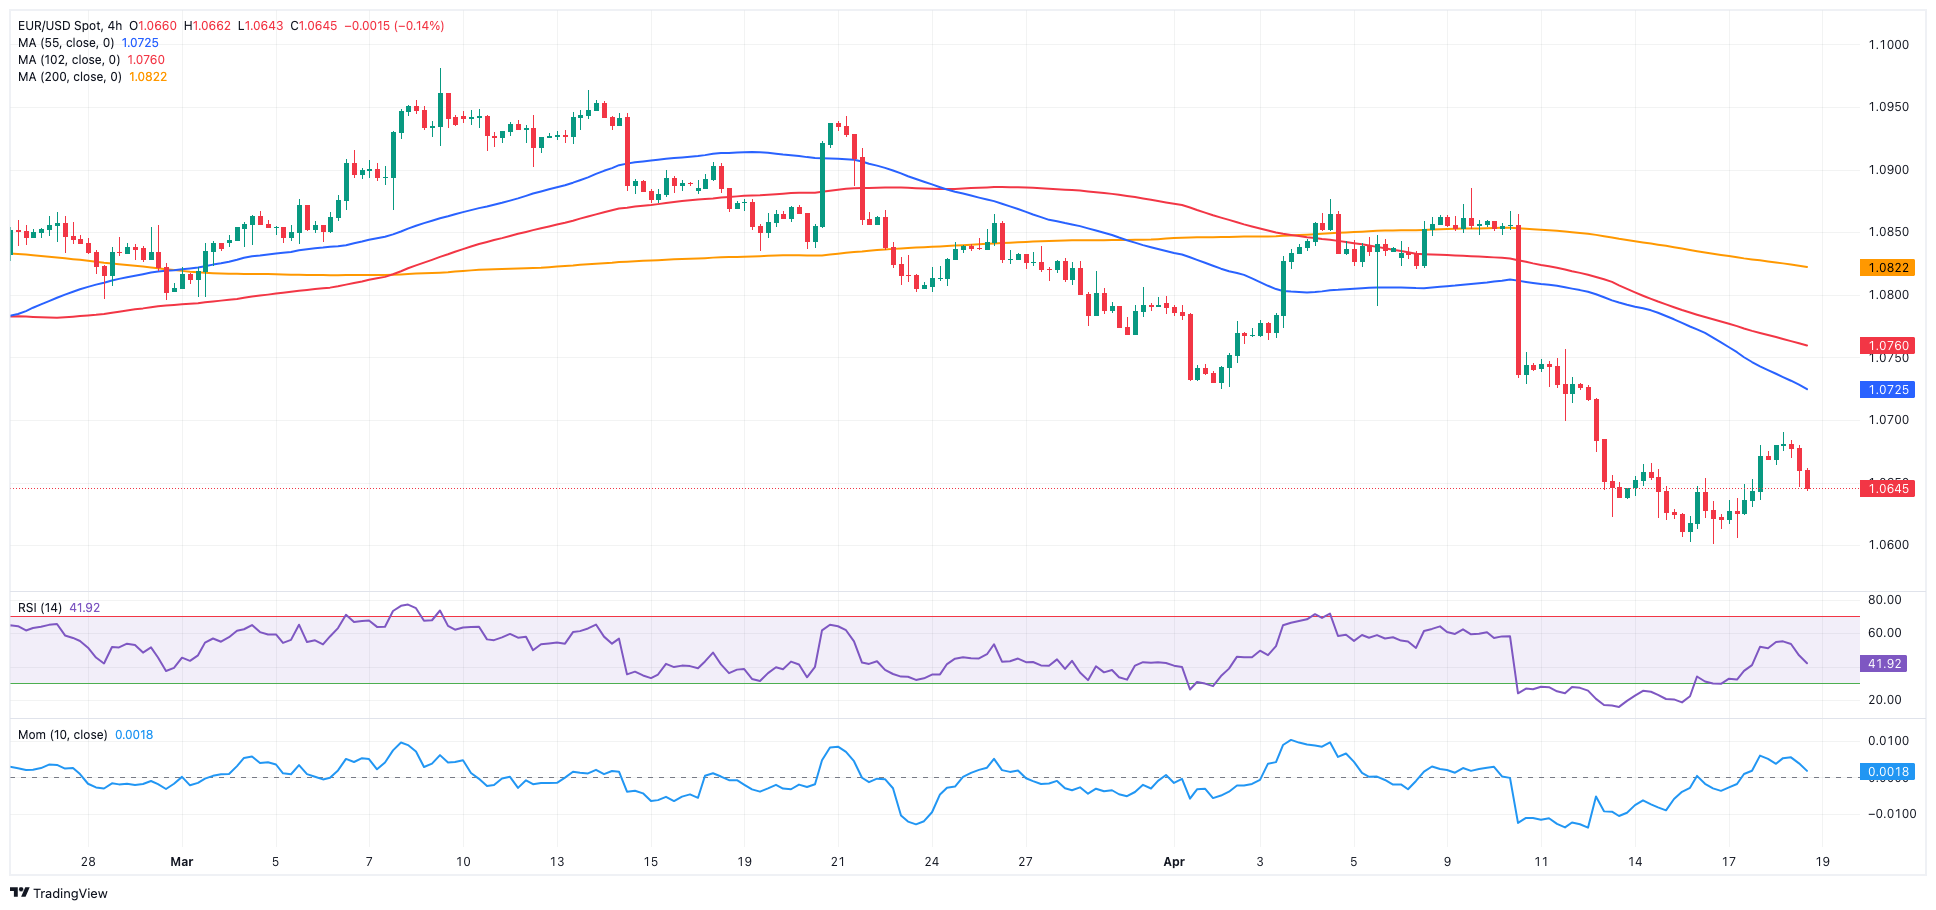
EUR/USD quickly faded Wednesday’s uptick, coming under fresh selling pressure after an initial move to weekly tops around 1.0690 and eventually ending the session around the mid-1.0600s.
Indeed, the hawkish message from New York Fed J. Williams lent support to the greenback, prompting spot to eventually give away those gains and refocus on the downside, while the USD Index (DXY) reclaimed the area beyond the 106.00 barrier.
Back to Williams, he emphasized the Fed's decisions are based on positive data, highlighting the economy's strength and mitigating imbalances. He acknowledged the need for rate cuts but noted no predetermined hikes. If higher rates are needed, the Fed may hike accordingly.
Persistent geopolitical concerns, as well as the revival of the uptrend in US yields across multiple maturity periods, aided the dollar's rise against a backdrop of unchanged monetary policy, with the Fed expected to cut interest rates at some point in the fourth quarter.
Accentuating the Fed-ECB policy divergence, the ECB's rate setters sounded more convinced of an interest rate cut in June. On this, Board member Villeroy advocated a rate cut at the bank’s next gathering, while his colleague Simkus favoured three rate cuts this year, and Kazaks highlighted that a rate reduction in June is highly probable.
On the US docket, Initial Jobless Claims rose by 212K in the week to April 13, the Philly Fed Manufacturing Index improved to 15.5 in April, the CB Leading Index dropped by 0.3% MoM in March, and Existing Home Sales contracted by 4.3% in March vs. the previous month.
Extra losses in EUR/USD might test the 2024 low of 1.0601 (April 16). A deeper decline might reveal a weekly low of 1.0495 (October 13, 2023), which comes before the 2023 bottom of 1.0448 (October 3) and the round milestone of 1.0400. In the opposite direction, immediate resistance is found at the key 200-day SMA of 1.0820, which comes before the weekly peak of 1.0885 (April 9) and the March high of 1.0981 (March 8). Up from here comes the weekly top of 1.0998 (January 5, 2011), just ahead of the critical 1.1000 mark. The breakout of this zone might put pressure on the December 2023 peak of 1.1139 (December 27), which is still supported by the 200-week SMA of 1.1138 and comes prior to the 2023 high of 1.1275 (July 18). The daily RSI receded to around 35.
Resistance levels: 1.0690 1.0756 1.0821 (4H chart)
Support levels: 1.0601 1.0516 1.0495 (4H chart)
USDJPY
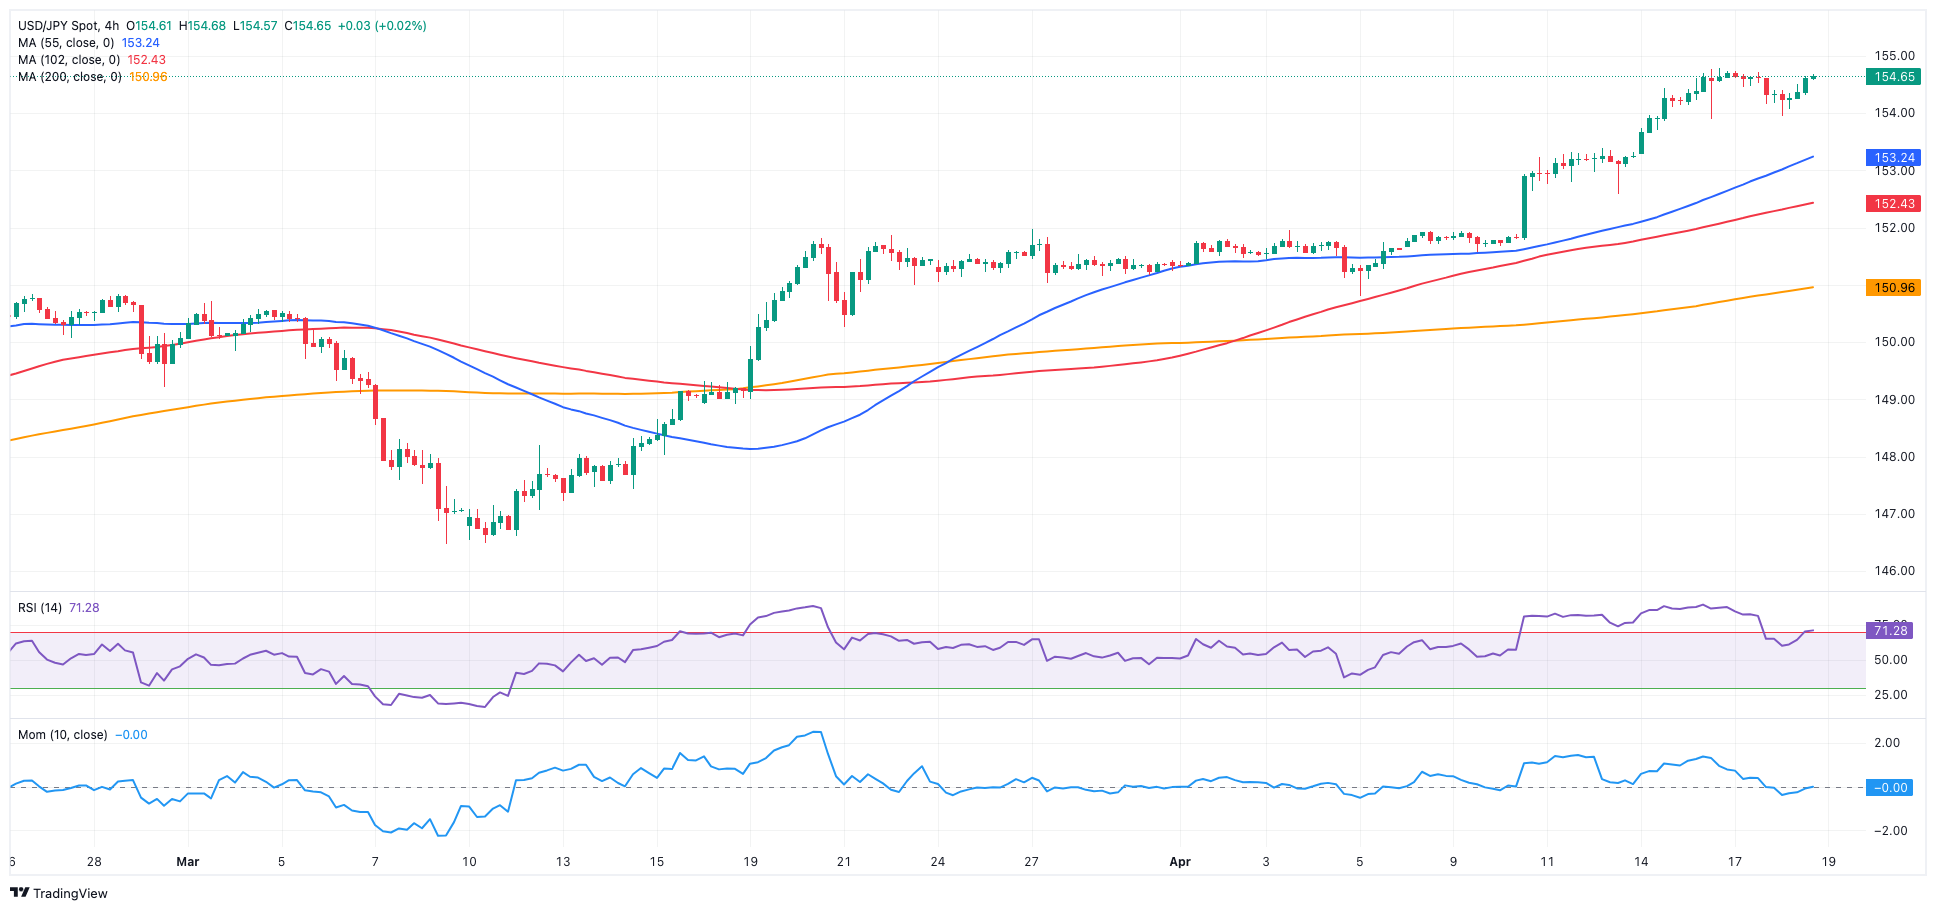
The continuation of the selling pressure in the Japanese yen motivated USD/JPY to resume its uptrend and leave behind Wednesday’s drop.
The persistent buying interest in the greenback, along with higher US yields across different timeframes and dovish comments from BoJ’s Noguchi, accompanied the daily uptick in spot.
Speaking about the BoJ, Board member Noguchi argued his case for gradual rate hikes and vowed to keep policy settings easy. However, his dovish comments were not that surprising, as he was one of two BoJ board members who voted against the March rate hike.
In the meantime, JGB 10-year yields added to the recent range bound at sub-0.90% levels.
On the domestic calendar, Foreign Bond Investment shrank by ¥1005.9B in the week to April 13.
The next upward hurdle for USD/JPY is the 2024 high of 154.78 (April 16), which precedes the June 1990 high of 155.80. The other way around, the pair is expected to find initial support at the April low of 150.80 (April 5), an area reinforced by the provisional 55-day SMA of 150.55. The loss of this region exposes the interim 100-day SMAs at 148.12 and the critical 200-day SMA of 147.54 prior to the March low of 146.47 (March 8). A breakdown of this zone might lead to a return to the February low of 145.89 (February 1), before the December 2023 bottom of 140.24 (December 28), the round number 140.00, and the July low of 137.23 (July 14). The daily RSI advanced to the 76 region, maintaining the overbought condition.
Resistance levels: 154.78 155.80 155.88 (4H chart)
Support levels: 153.88 152.58 151.56 (4H chart)
GBPUSD
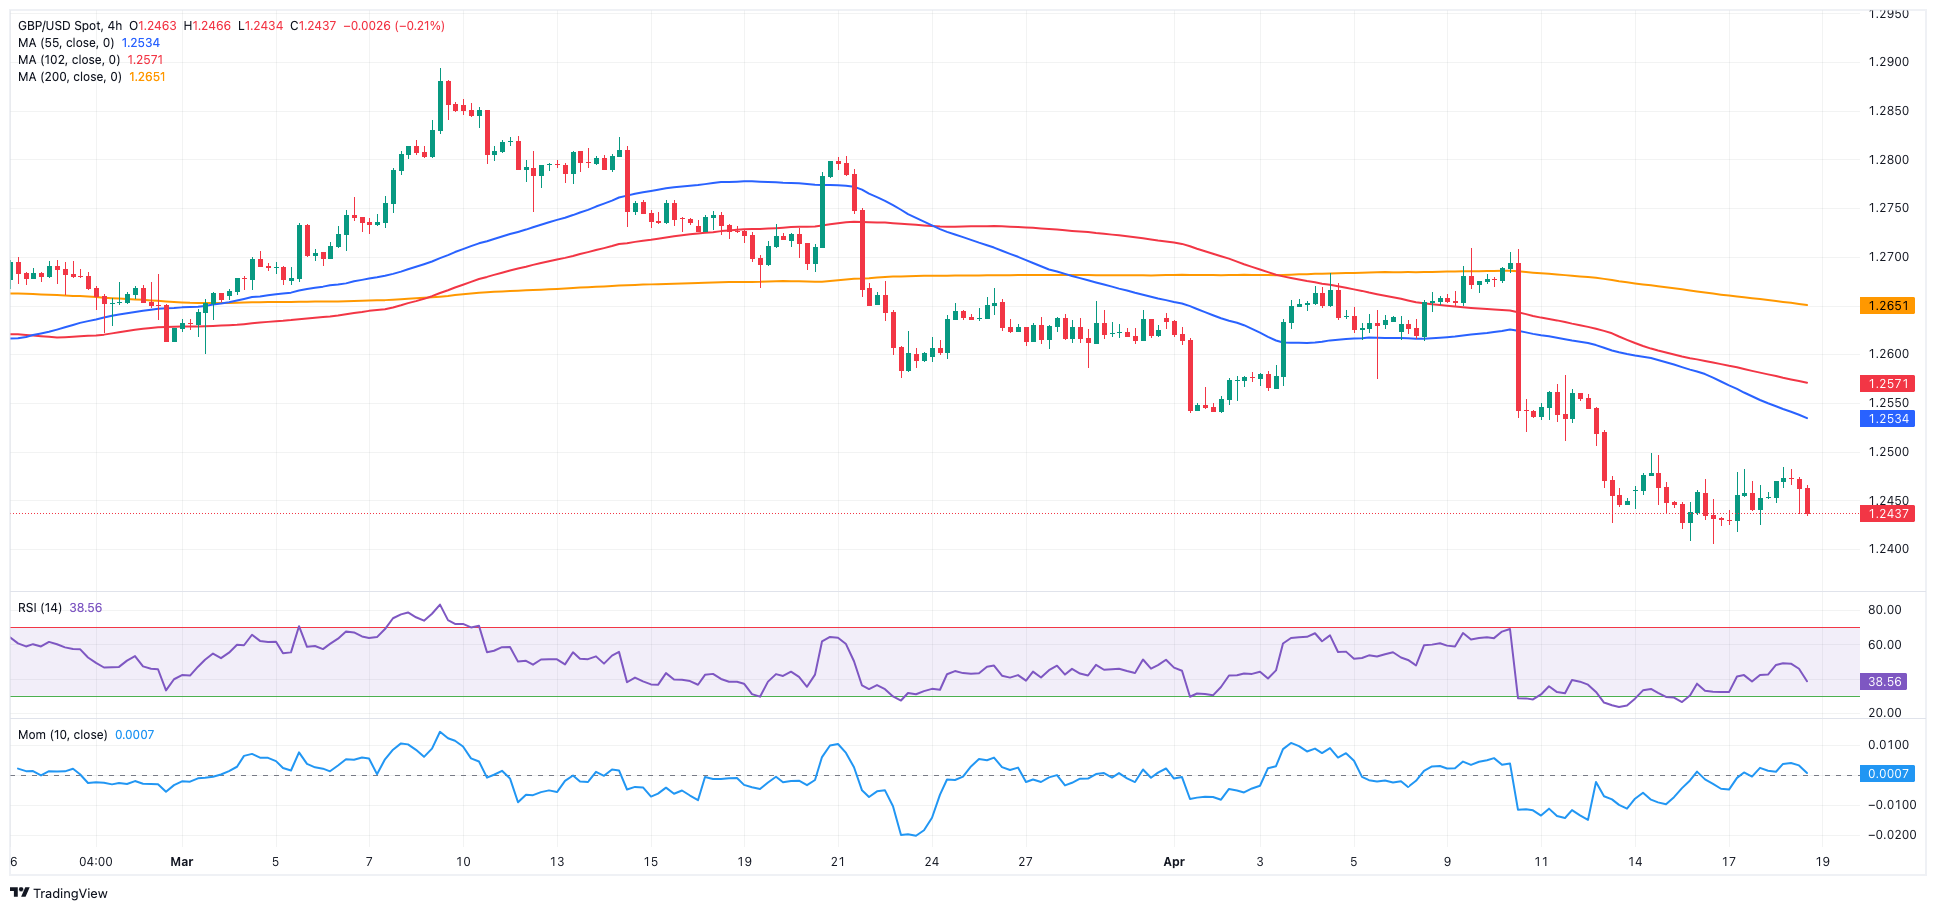
GBP/USD alternated gains with losses in the mid-1.2400s amidst a narrow trading range on Thursday.
The inconclusive price action in Cable came amidst decent gains in the greenback, while investors continued to evaluate the recent data releases from the UK labour market and inflation figures, which altogether pushed back expectations for a rate cut by the BoE from August to September.
Meanwhile, UK 10-year gilt yields resumed their monthly uptrend, approaching the 4.30% level.
The immediate downward target for GBP/USD is the 2024 low of 1.2405 (April 16). A deeper retracement would not find significant support until the weekly low of 1.2187 (November 10, 2023), which comes before the October 2023 low of 1.2037 and the main 1.2000 contention zone. On the other hand, the key 200-day SMA of 1.2575 acts as the first upward barrier, followed by the April high of 1.2709 (April 9), the weekly top of 1.2803 (March 21), and the 2024 peak of 1.2893 (March 8). Further north, the weekly high of 1.2995 (July 27, 2023) is just above the critical 1.3000 yardstick. On the daily chart, the RSI eased to the 34 region.
Resistance levels: 1.2498 1.2578 1.2650 (4H chart)
Support levels: 1.2405 1.2373 1.2187 (4H chart)
GOLD
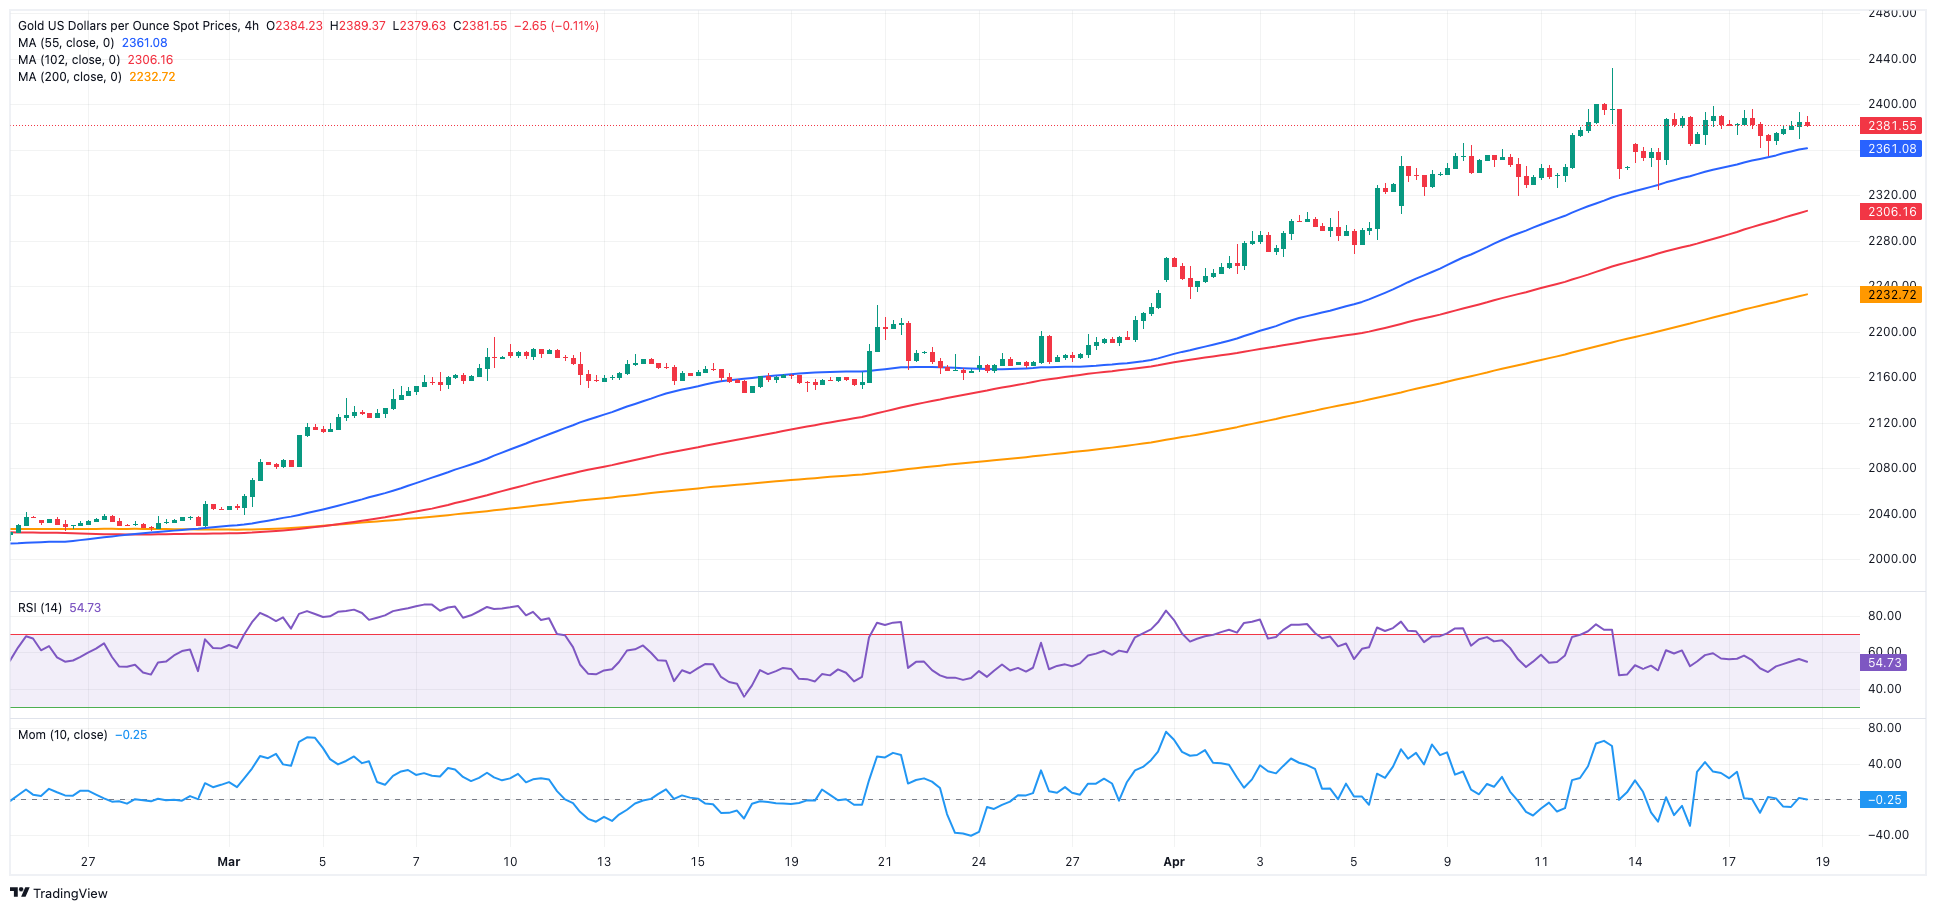
Gold prices saw the resumption of bullish momentum on Thursday, always propped up by sustained demand for safe-haven assets in response to surging geopolitical tensions, particularly in the Middle East.
Bolstering the upside impetus also came continued purchases from central banks, while fading expectations of a Fed’s interest rate cut seem to have limited prospects for further gains.
The latter was further solidified following Chair Powell's remarks on Tuesday, emphasizing the need for a prolonged period of restrictive monetary policy, while J. Williams (New York) did not entirely rule out rate hikes in case of need.
Gold faces immediate resistance at its all-time high of $2,431 (April 12). Conversely, the weekly low of $2,146 (March 18) comes first, supported by the preliminary 55-day SMA ($2,154). The breakdown of the latter reveals a likely drop to the transitory 100-day SMA of $2,100, which comes before the more relevant 200-day SMA of $2,017. Moving south, the 2024 low of $1,984 (February 14) is followed by the December 2023 bottom of $1,973 (December 13) and the November 2023 low of $1,931 (November 10). Failure in this position could push the metal down to its October 2023 low of $1,810 (October 6), followed by the 2023 low of $1,804 (February 28) and the important $1,800 conflict zone.
Resistance levels: $2,398 $2,431 (4H chart)
Support levels: $2,324 $2,267 $2,231 (4H chart)
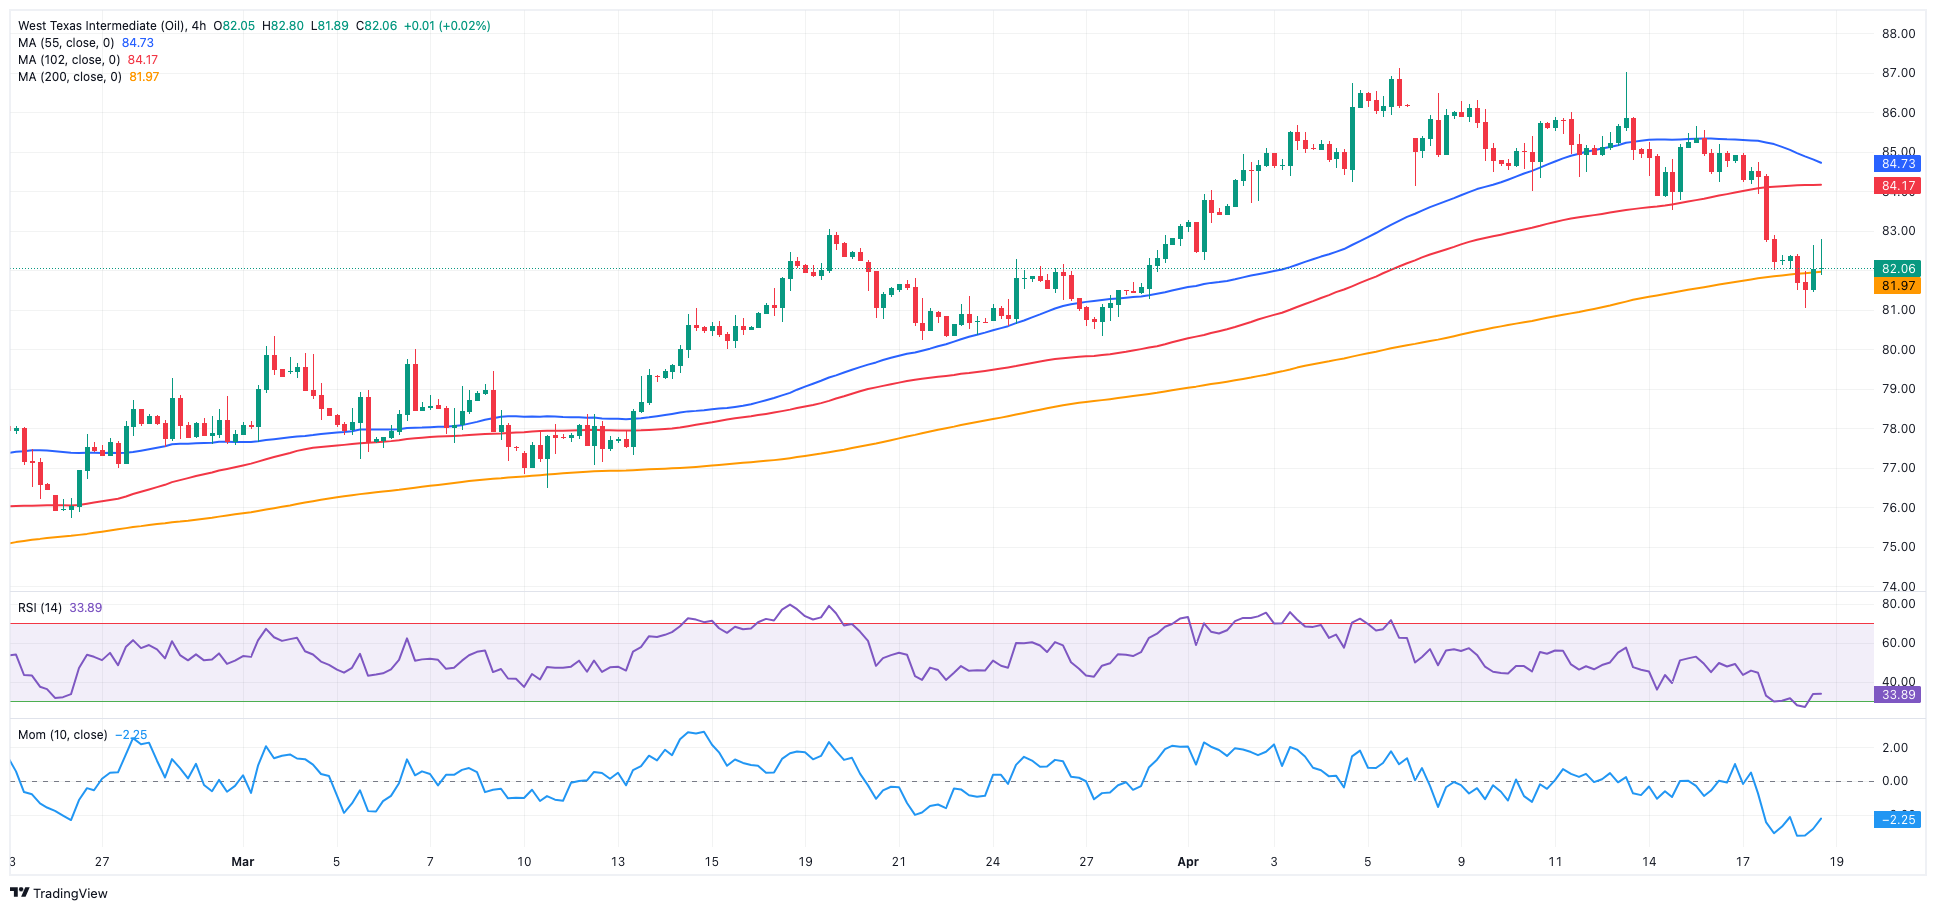
CRUDE WTI
WTI prices extended their decline and revisited the boundaries of the $81.00 mark per barrel, or three-week lows, on Thursday.
The commodity's prices stayed subdued as traders processed updates on sanctions imposed on Venezuela and Iran. Additionally, concerns regarding demand and reduced geopolitical tensions, combined with a larger-than-anticipated weekly increase in US crude oil inventories, continued to weigh on prices.
Next on the downside for WTI is the April low of $81.03 (April 18), followed by the weekly low of $80.33 (March 21) and the important 200-day SMA of $79.79. Further south, the February low of $71.43 (February 5) precedes the critical $70.00 barrier and the 2024 bottom of $69.31 (January 3). The breach of the latter reveals the December 2023 low of $67.74 (December 13). On the flip side, the immediate up-barrier is the 2024 peak of $87.60 (April 12), prior to the weekly high of $89.83 (October 18, 2023) and the 2023 top of $94.99 (September 28, 2023). The breakout of this level could put a potential test of the weekly peak of $97.65 (August 30) back on the radar ahead of the psychological $100.00 threshold.
Resistance levels: $86.14 $87.60 $89.82 (4H chart)
Support levels: $81.03 $80.51 $76.76 (4H chart)
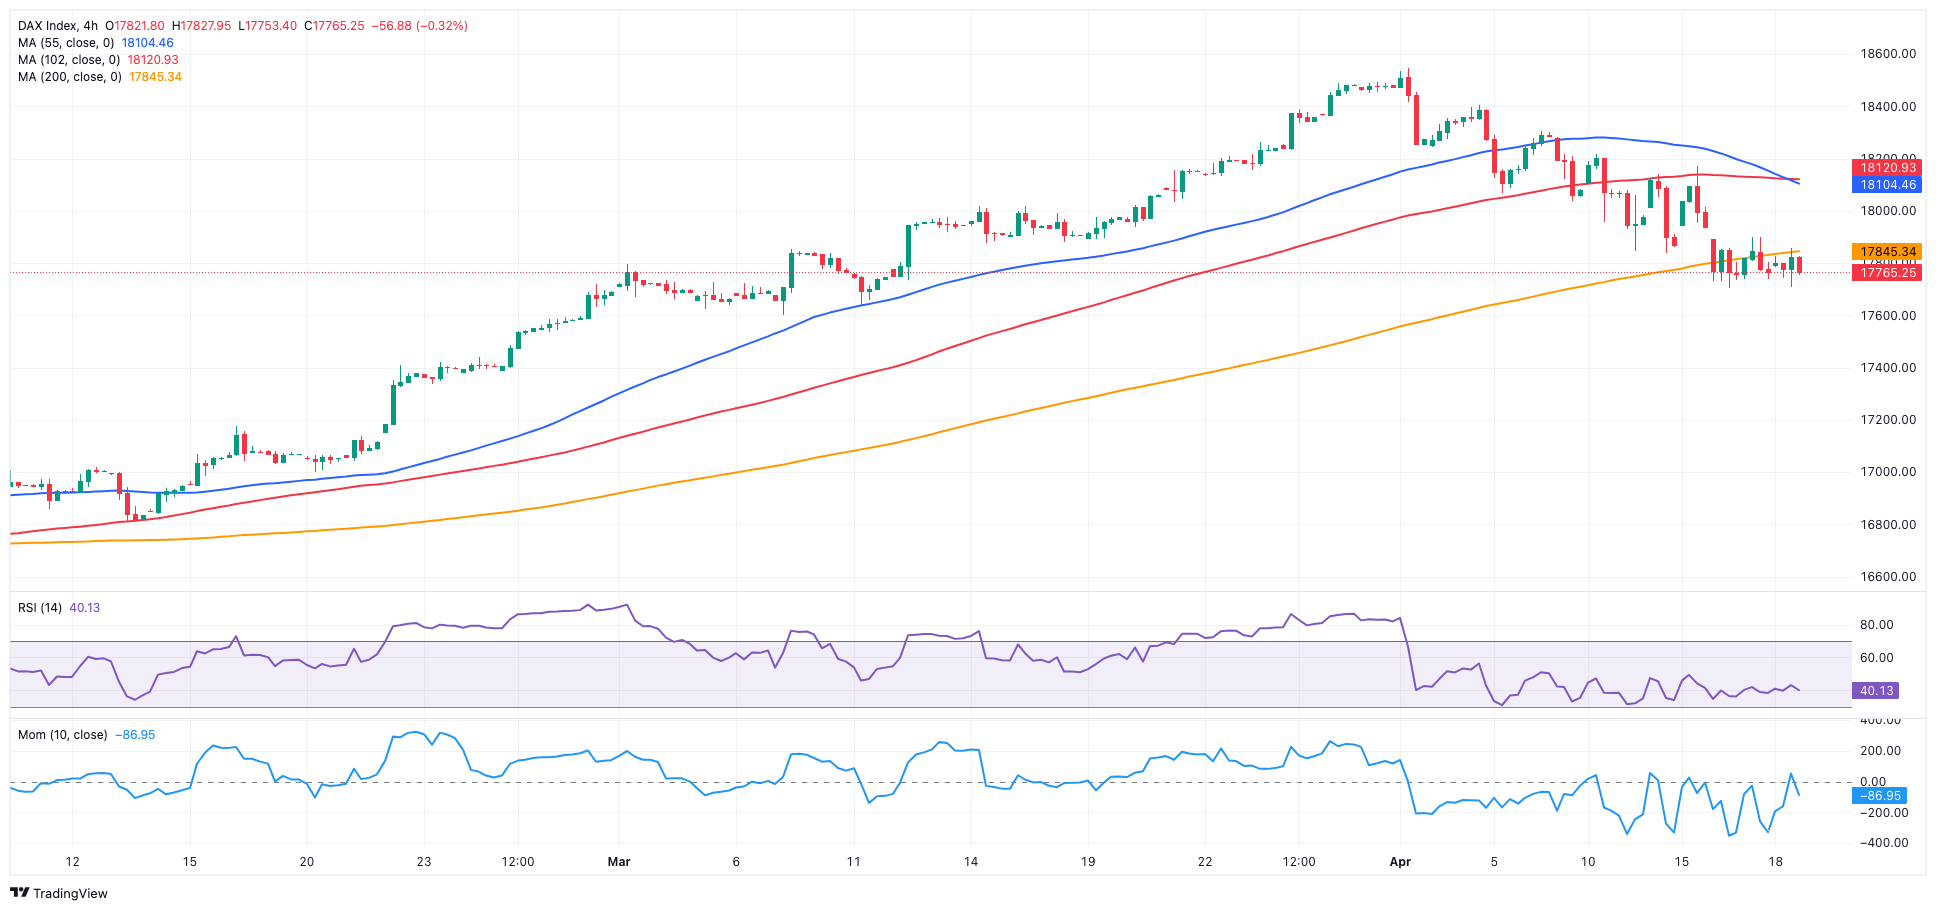
GER40
European markets concluded Thursday's session with marginal gains, following fluctuations throughout the day fueled by ongoing speculation regarding the potential for the ECB to implement its first interest rate cut as soon as in June.
The latter was reinforced by ECB officials (Villeroy, Simkus, and Kazaks), who advocated for the start of the bank’s easing cycle in the summer while also suggesting three rate cuts for the remainder of the year.
Against that, the German reference DAX40 managed to add to Wednesday’s small advance and reclaim the area beyond the 17,800 level.
Meanwhile, 10-year bund yields rose to around 2.50%, leaving behind the previous day’s decline.
The loss of the April low of 17,713 (April 16) may push the DAX40 to test the March low of 17,619 (March 7), which appears to be supported by the provisional 55-day SMA of 17,669. A drop below the latter could bring the February low of 16,821 (February 1) back into view, ahead of the critical 200-day SMA of 16,404 and the 2024 bottom of 16,345 (January 17). After dropping below the latter, the weekly low of 15,915 (November 28) might be tested, followed by the October low of 14,630 (October 23) and the 2023 bottom of 14,458 (March 20). On the upside, the next level of resistance is the record high of 18,567 (April 2). The daily RSI improved past 44.
Best Performers: Adidas, Continental AG, RWE AG ST
Worst Performers: Sartorius AG VZO, Rheinmetall AG, Infineon
Resistance levels: 18,191 18,427 18,567 (4H chart)
Support levels: 17,713 17,619 17,504 (4H chart)
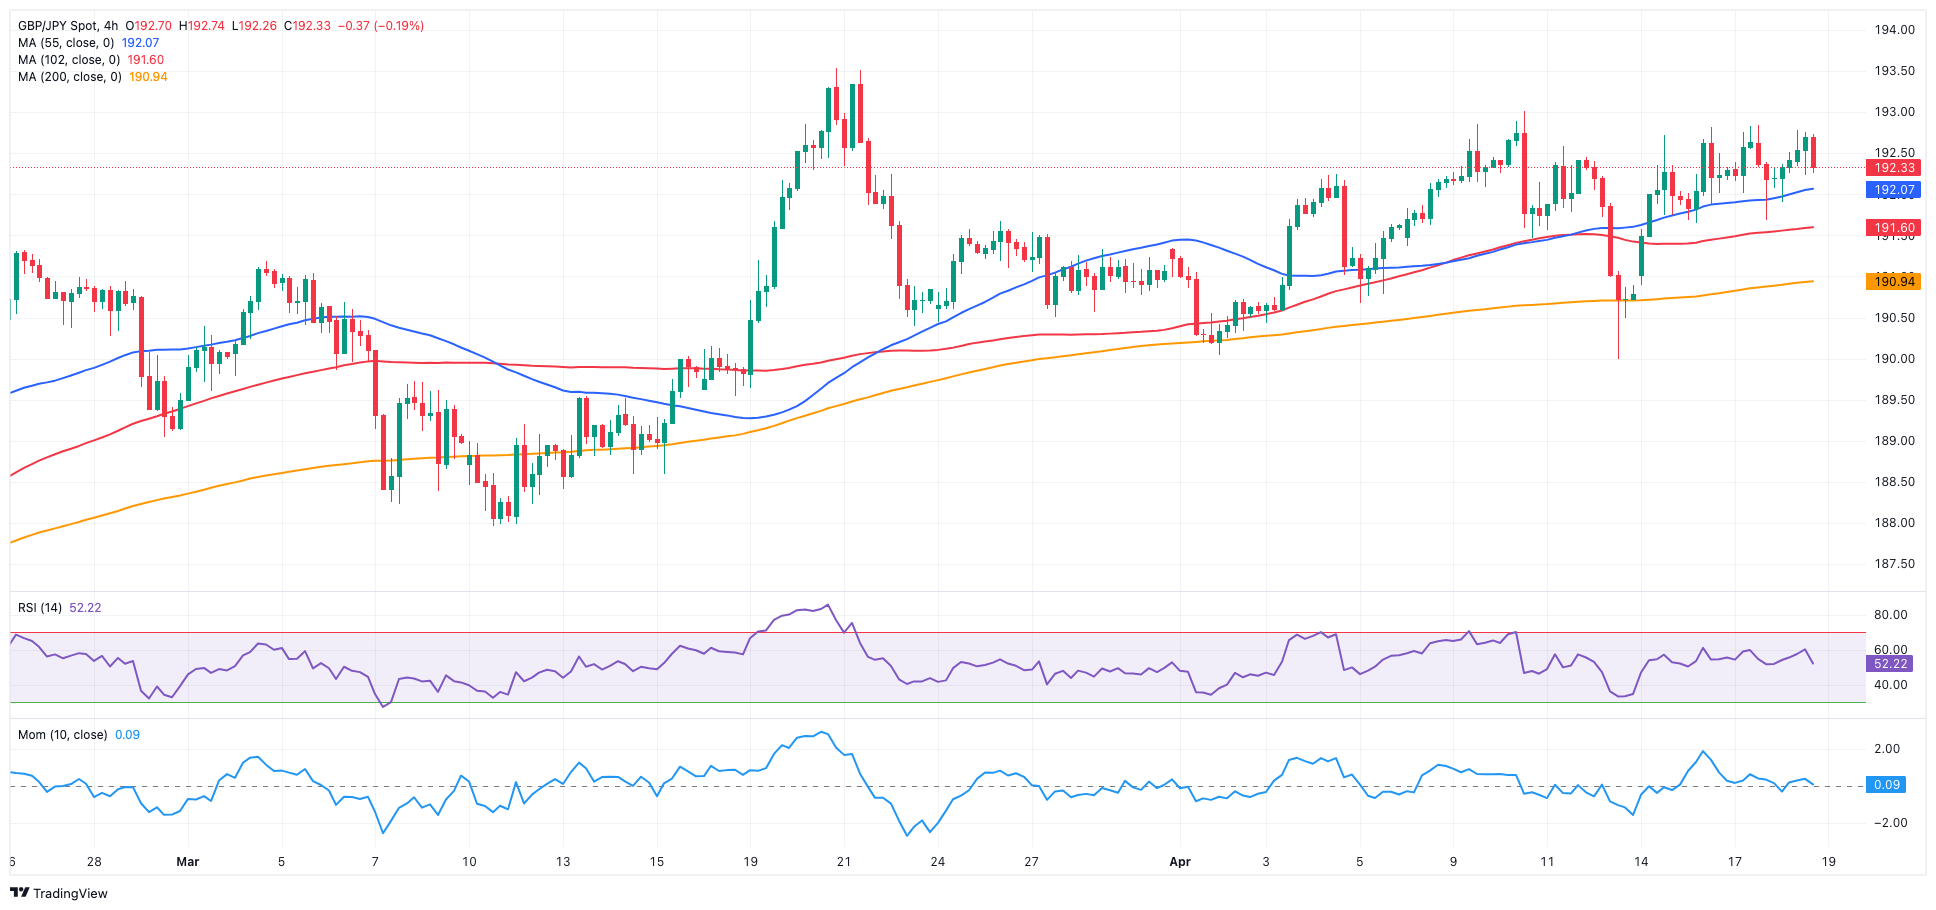
GBPJPY
The resumption of the bearish bias in the Japanese yen along with the inconclusive session in the British pound seem to have been enough to sponsor the fourth consecutive daily advance in GBP/JPY, which flirted with the area of recent peaks near the 193.00 barrier on Thursday.
Indeed, higher US yields coupled with BoJ-driven weakness in the yen further bolstered the weekly advance in the cross, opening the door to a potential visit to the 2024 tops in the mid-193.00s sooner rather than later.
At the moment, GBP/JPY appears to encounter contention near the 190.00 region during downward movements, while surpassing yearly highs in the mid-193.00s presents obstacles for immediate upward momentum.
GBP/JPY faces immediate upside barrier at the April top of 192.97 (April 10) before reaching the 2024 peak of 193.53 (March 20). The breakout of this level may lead to a test of the August 2015 high of 195.28 (August 18), followed by the record top of 195.88 (June 24, 2015). In the other direction, a break of the April low of 189.99 (April 12) might push the cross to test the March low of 187.96 (March 11), which comes ahead of the intermediate 100-day SMA of 187.59. The 200-day SMA of 185.52 comes next before the February low of 185.22 (February 1) and the December 2023 bottom of 178.33 (December 14). The daily RSI climbed past 59.
Resistance levels: 192.81 192.97 193.53 (4H chart)
Support levels: 191.68 190.93 189.99 (4H chart)
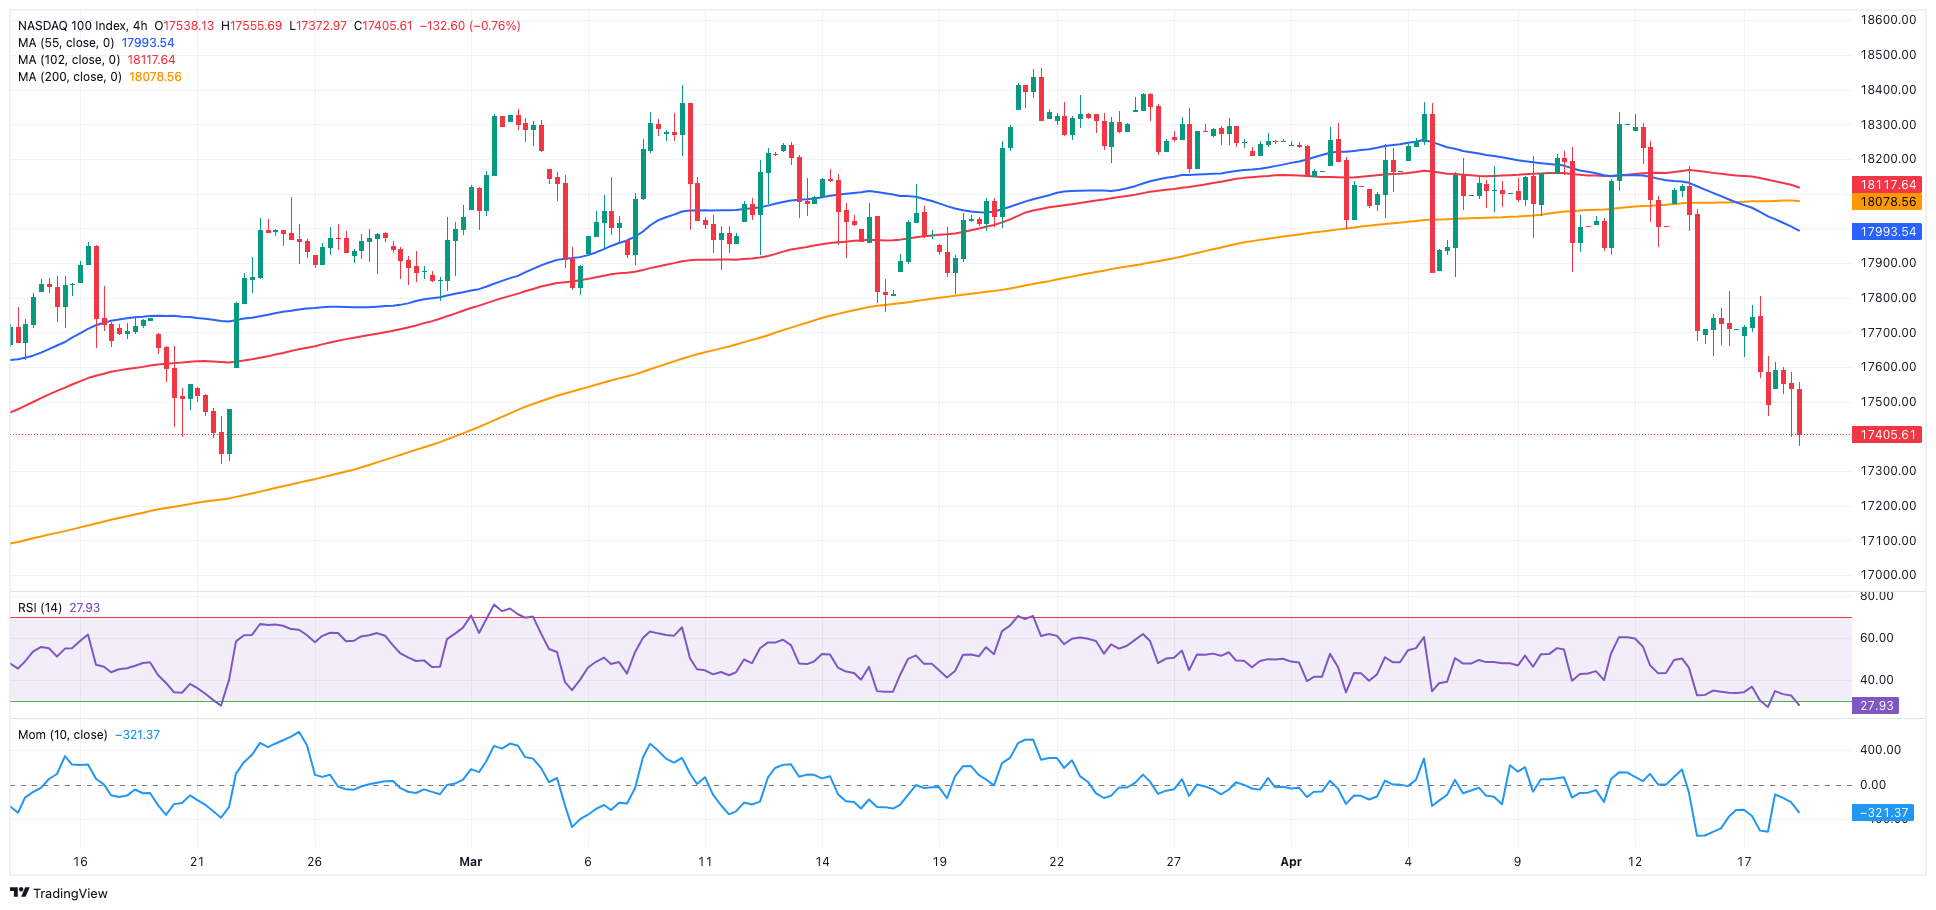
NASDAQ
The negative sentiment in the US technology sector intensified, pushing the reference Nasdaq 100 to a fresh two-month low near the 17,400 level on Thursday.
The second straight decline in the index came on the back of persevering geopolitical concerns and the Fed’s outlook of extended monetary tightening. The latter was further underpinned by comments from the Fed's Williams and Bostic.
Also contributing to the prevailing sour mood in the market, the dollar posted marked gains in line with US yields across several timeframes.
Extra losses are anticipated to revisit the weekly low of 17,319 (February 21), ahead of another weekly low of 17,128 (January 31). If the latter is broken, a challenge to the 2024 bottom of 16,249 (January 5) may emerge, prior to the crucial 200-day SMA of 16,257 and the December 2023 low of 15,695 (December 4). Additional losses from here may return to the October 2023 level of 14,058 (October 26), which precedes the April 2023 low of 12,724 (April 25) and the March 2023 low of 11,695 (March 13). The other way around, if bulls reclaim the momentum, there is an interim hurdle at the 55-day SMA of 17,938, ahead of the all-time high of 18,464 (March 21). The daily RSI receded to around 35.
Top Gainers: Meta Platforms, CSX, Warner Bros Discovery
Top Losers: Tesla, NXP, Autodesk
Resistance levels: 17,817 18,337 18,464 (4H chart)
Support levels: 17,388 17,319 17,128 (4H chart)
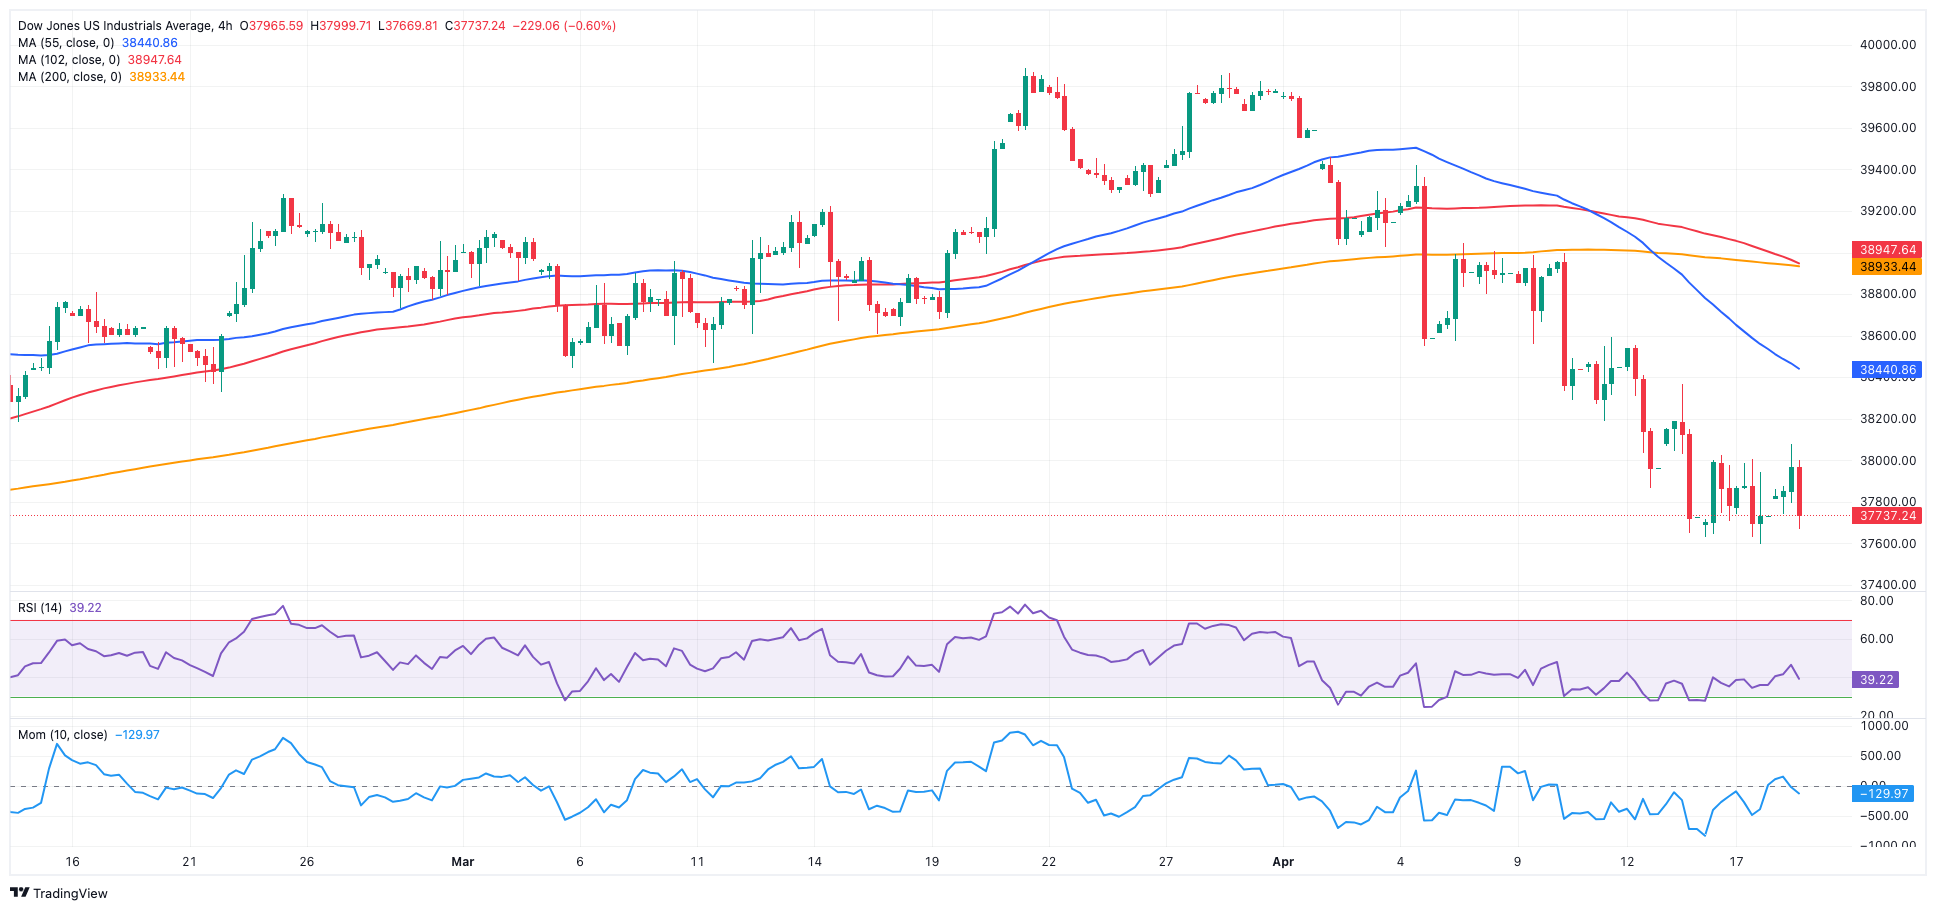
DOW JONES
US stocks tracked by the benchmark Dow Jones traded in a vacillating fashion on Thursday, extending the consolidative range in the lower end of the weekly range so far.
Meanwhile, the index remained range-bound amid escalating geopolitical tensions, a notable strengthening of the dollar, expectations of a delayed interest rate adjustment by the Fed, and positive corporate earnings announcements.
In addition, hawkish comments from Fed rate setters kept the sentiment among investors depressed.
On Thursday, the Dow Jones advanced 0.02% to 37,764, the S&P 500 dropped 0.16% to 5,014, and the tech-focused Nasdaq Composite retreated 0.42% to 15,617.
If the Dow Jones falls below its April low of 37,611 (April 17), it might then hit the 2024 bottom of 37,122 (January 18) before reaching the critical 200-day SMA of 36,195. The weekly low of 33,859 (November 7, 2023) is next, seconded by the October 2023 low of 32,327 (October 27), all before the 2023 bottom of 31,429 (March 15). Having said that, the interim 55-day SMA of 38,795 stands in the way of the March 21 record high of 39,889 on the upside. The daily RSI barely changed around 32.
Top Performers: UnitedHealth, American Express, Travelers
Worst Performers: Intel, Salesforce Inc, Microsoft
Resistance levels: 38,598 39,421 39,889 (4H chart)
Support levels: 37,611 37,122 36,010 (4H chart)
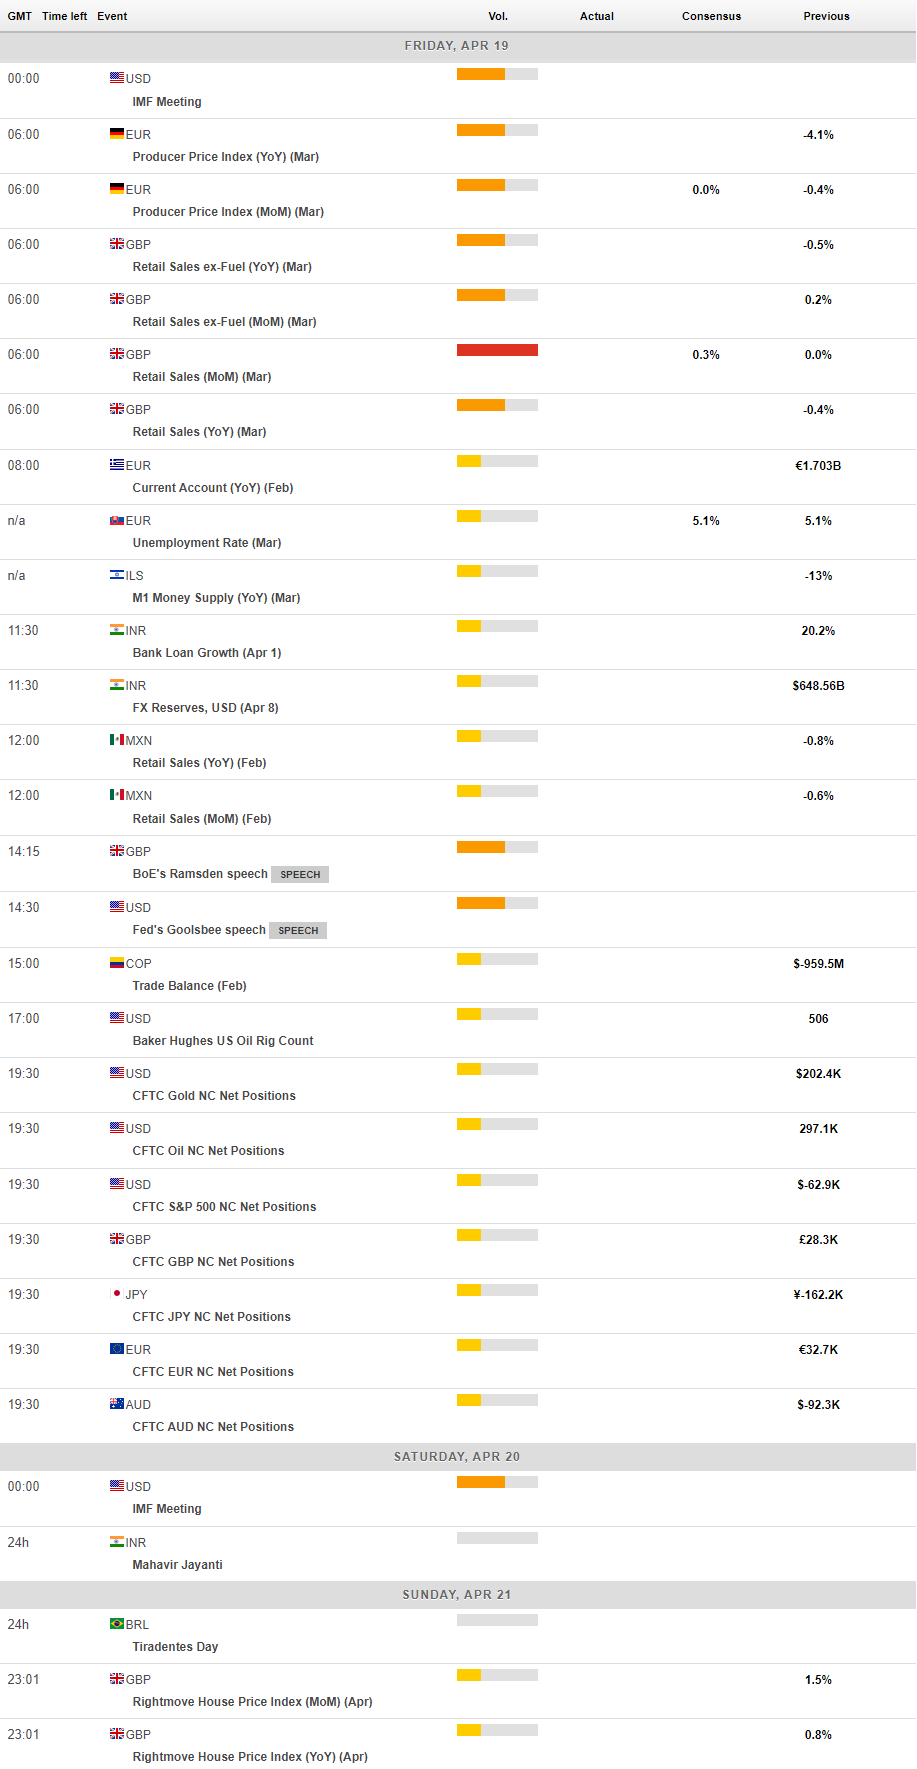
MACROECONOMIC EVENTS
All Information & Updates provided by:

All information relating to the financial markets available on this page has been prepared and issued by FXStreet (Forexstreet SL, Spain, Reg: B62498233) on the basis of publicly available information and all information believed to be reliable and does not conflict with Kuwaiti local laws, and all necessary care has been taken to before the company to ensure that the facts mentioned are correct from the source.
NCM Investment nor any of its directors or employees shall in any way be held responsible for the contents of this news, and the information contained on this page is intended only to provide clients with publicly available information and should not be construed as investment advice, report or analysis and/or constitute an offer or invitation to buy or sell financial instruments of any kind.
RISK WARNING: Forex and CFDs are highly risky leveraged products, as losses can exceed deposits. Please ensure you understand all the risks and take independent advice if necessary. NCM will segregate the clients based on the criteria of the regulator and its bylaws. NCM does not provide any advisory service; the material published does not constitute advice or a recommendation for a transaction in any financial instrument. NCM accepts no responsibility for any use of the content presented and any consequences of that use. Anyone acting on the information provided does so at their own risk.