
- Contact Us:
-

-

-

-


Daily Market Updates
22 Apr 2024
EURUSD
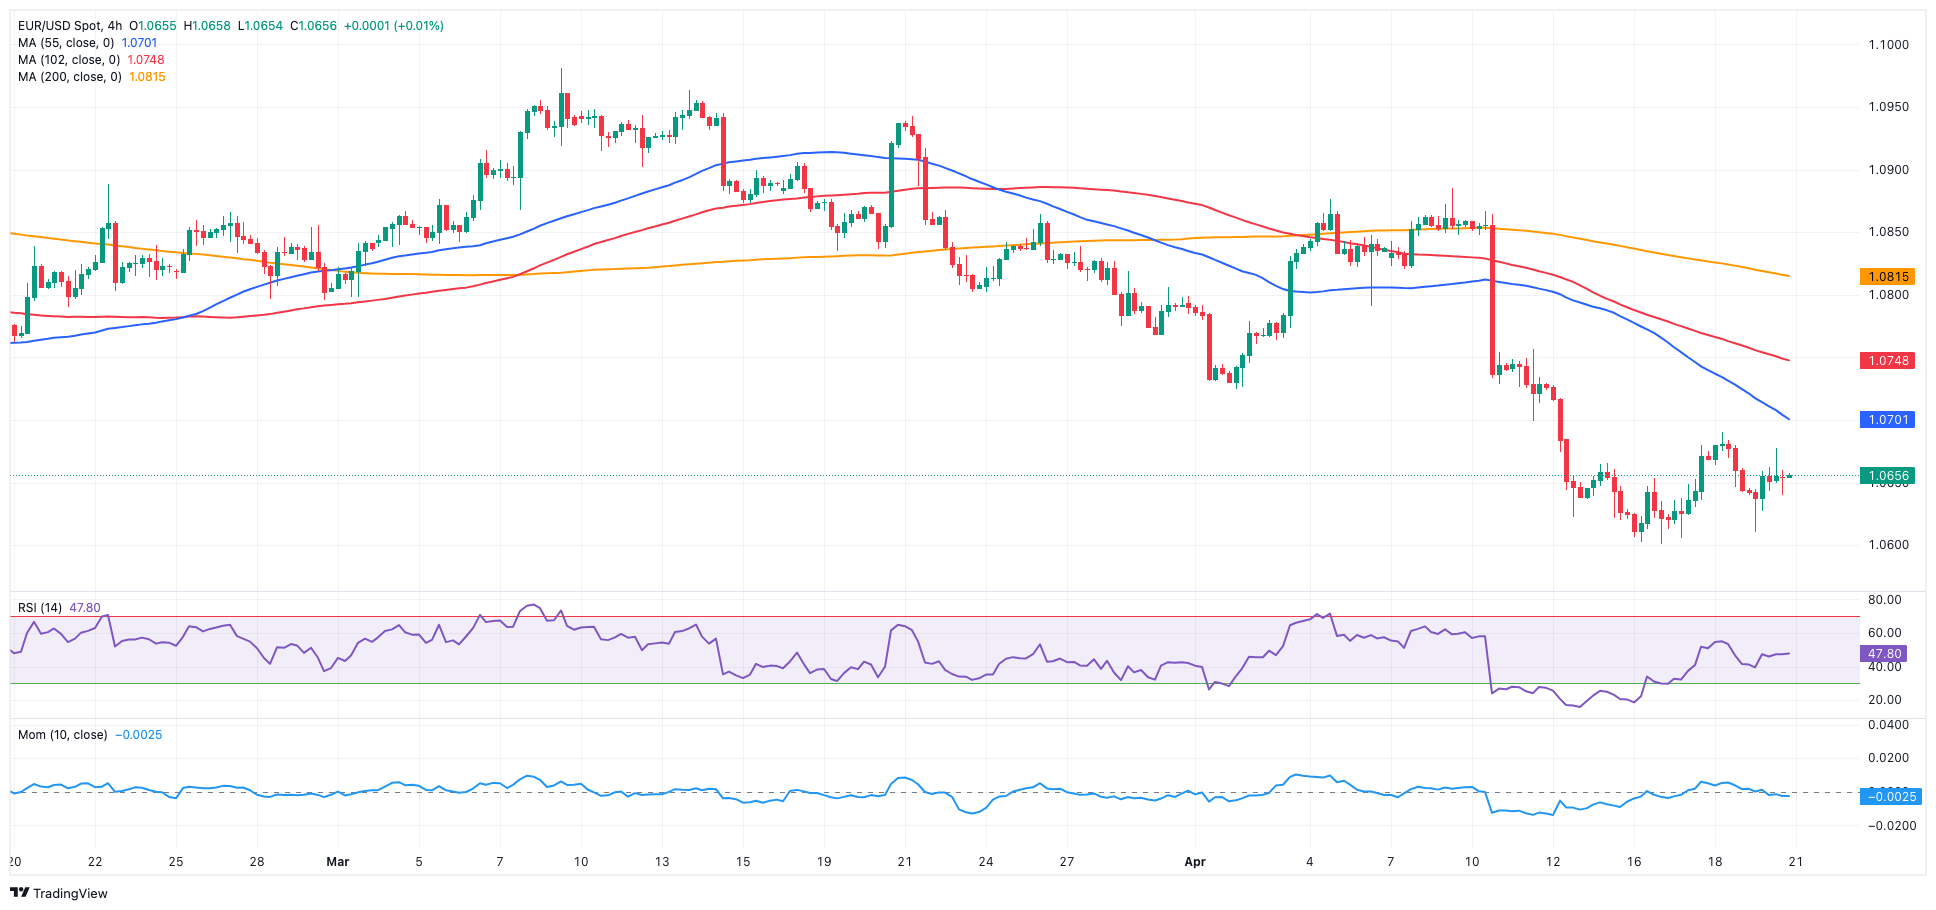
In quite a volatile end of the week, EUR/USD managed to regain upside traction and end Friday’s sessions slightly up around the 1.0650 region. After recovering from fresh yearly lows near 1.0600, the pair successfully managed to close the week in positive territory and partially reverse the prior week’s sharp retracement.
The tepid bounce in the pair came on the back of the equally lacklustre price action in the Greenback, although the USD Index (DXY) did manage well to maintain the trade above the 106.00 mark amidst a marginal increase in yields on the short end of the curve vs. small pullbacks on the belly and the long end.
In the meantime, the Fed-ECB policy divergence continued to dominate the scenario in the FX universe, with investors so far favouring an interest rate cut by the Fed in September vs. the start of the easing cycle by the ECB at some point in the summer.
Around the Fed, A. Goolsbee (Chicago) argued on Friday that he cannot dismiss the possibility of a rate hike. He also emphasized that the Fed's actions will be guided by data to address the need to lower inflation to its 2% target.
Extra losses in the EUR/USD might test the 2024 low of 1.0601 (April 16). A deeper slide might expose a weekly low of 1.0495 (October 13, 2023), just before the 2023 low of 1.0448 (October 3) and the round milestone of 1.0400. In the opposite direction, immediate resistance exists at the crucial 200-day SMA of 1.0817, which precedes the weekly peak of 1.0885 (April 9) and the March high of 1.0981 (March 8). Up from here comes a weekly top of 1.0998 (January 5, 2011), just ahead of the important 1.1000 threshold. The breakthrough of this zone may put pressure on the December 2023 peak of 1.1139 (December 27), which is still supported by the 200-week SMA of 1.1138 and comes prior to the 2023 high of 1.1275 (July 18). The daily RSI ticked higher past 36.
Resistance levels: 1.0690 1.0756 1.0814 (4H chart)
Support levels: 1.0601 1.0516 1.0495 (4H chart)
USDJPY
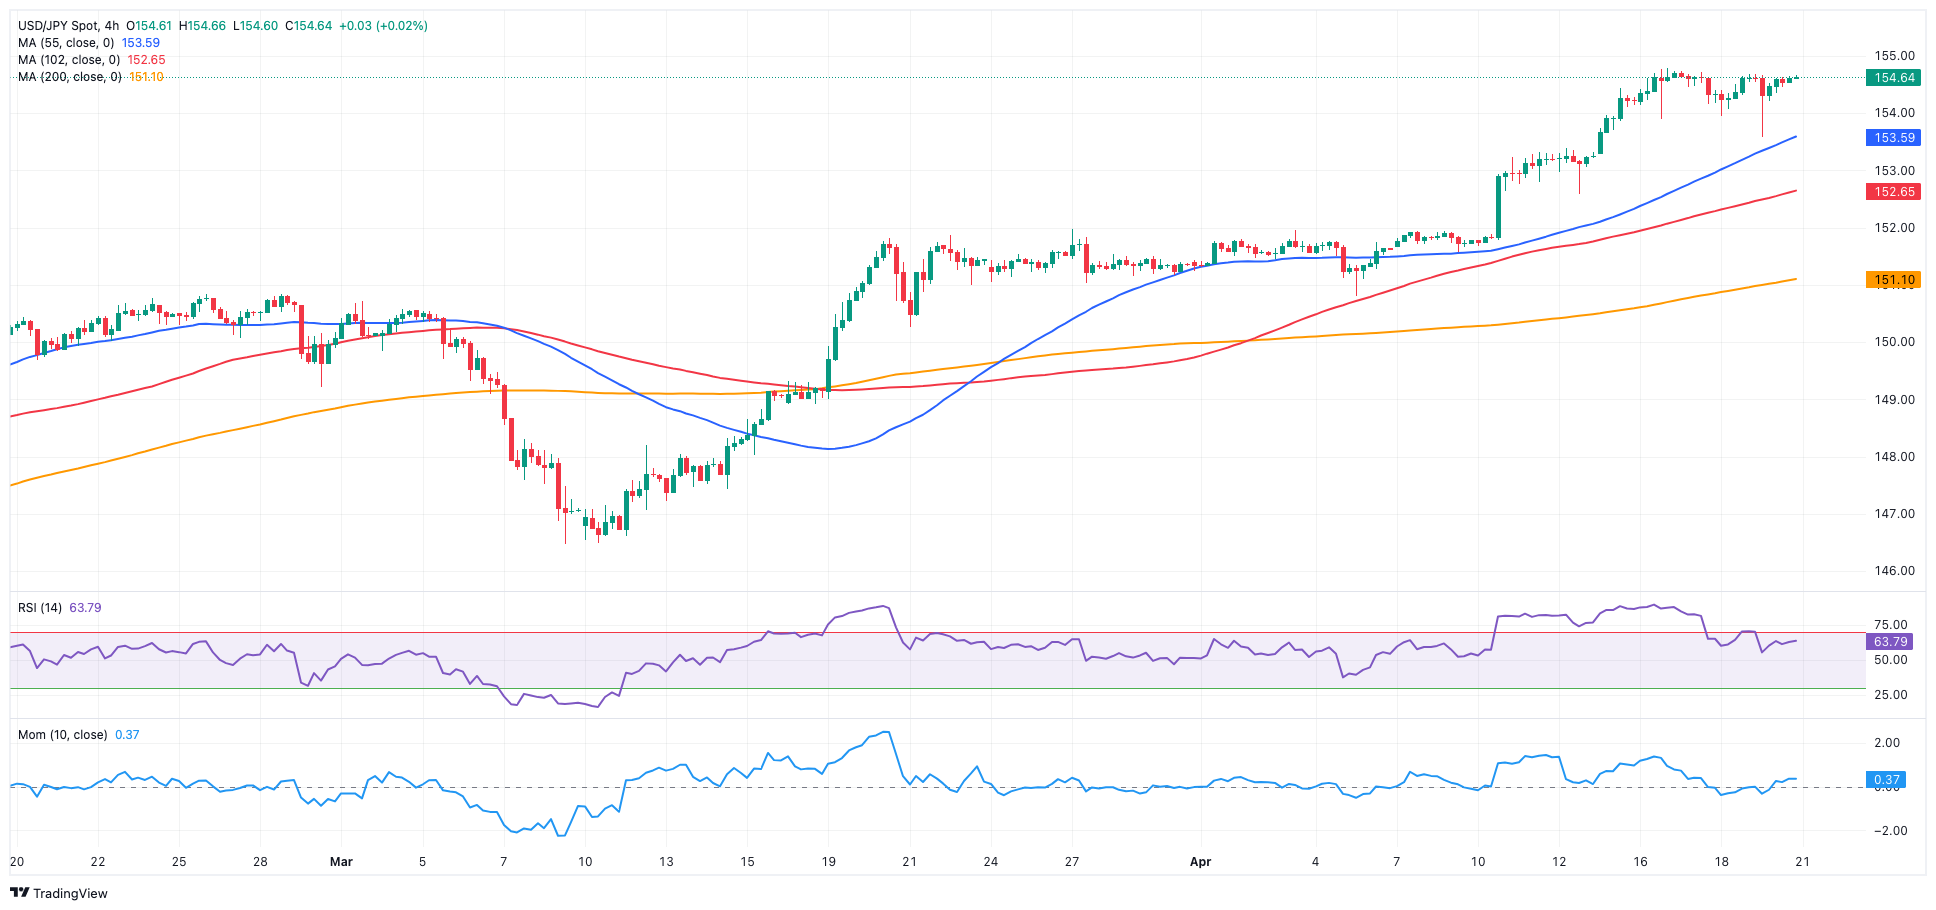
USD/JPY traded with marginal losses amidst the multi-session consolidative theme on Friday, always above the 154.00 hurdle.
In fact, price action around spot came on the back of mixed US yields, lacklustre developments in the greenback, and a drop to weekly lows in JGB 10-year yields, while fears of potential FX intervention appeared somewhat dissipated, albeit temporarily.
In Japan, the March Inflation Rate rose by 2.7% YoY, the Core Inflation Rate rose by 2.6% over the last twelve months, and the Inflation Rate Ex-Food and Energy advanced at an annualized 2.9%.
The next upward hurdle for USD/JPY is the 2024 high of 154.78 (April 16), which comes before the June 1990 top of 155.80. Conversely, the pair is projected to find initial support at the April low of 150.80 (April 5), which is backed by the preliminary 55-day SMA of 150.66. The loss of this region reveals the interim 100-day SMAs at 148.18 and the key 200-day SMA at 147.62, all before the March low of 146.47 (March 8). A breakdown of this zone might result in a return to the February low of 145.89 (February 1), prior to the December 2023 bottom of 140.24 (December 28), the round number 140.00, and the July low of 137.23 (July 14). The day-to-day RSI eased to around 75, maintaining the overbought condition.
Resistance levels: 154.78 155.80 155.88 (4H chart)
Support levels: 153.58 152.58 151.56 (4H chart)
GBPUSD
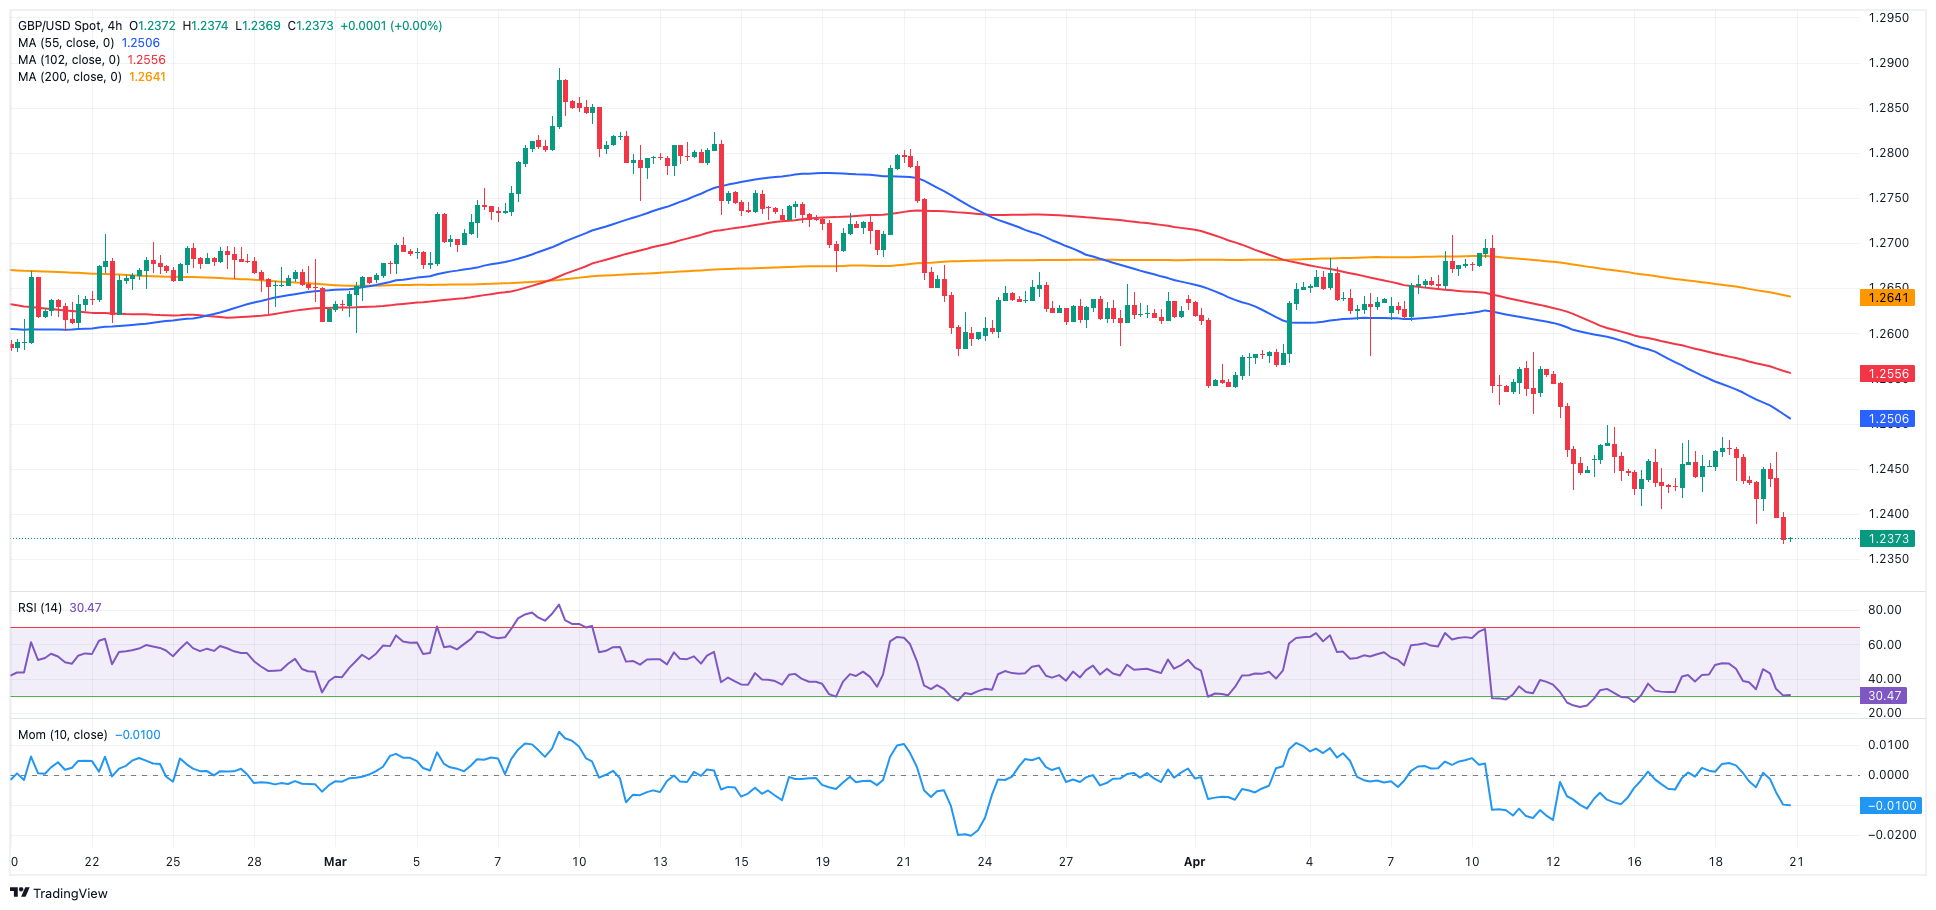
Increased weakness dragged GBP/USD to levels last visited in mid-November 2023, around 1.2360 at the end of the week.
The marked decline in Cable came amidst persistent bearish bias in the latter part of the week, despite the modest losses in the dollar, poor results from the UK docket, and dovish comments from BoE officials.
In fact, the British pound added to Thursday’s decline after headline Retail Sales expanded by 0.8% YoY in March and by 0.4% YoY when excluding fuel.
Around the BoE, MPC member D. Ramsden has suggested that UK inflation's likelihood of remaining elevated has decreased, potentially lower than the bank’s latest projections. He also suggested that inflation could remain around the 2% target for the next three years. In addition, S. Breeden expressed a shift in her focus, now contemplating the duration for which interest rates should remain at their present level rather than considering whether they should be increased further. So far, investors seem to be pricing in two rate cuts at most by the BoE this year.
In the meantime, the daily losses in the pair came in line with a small retreat in UK 10-year gilt yields, this time falling below 4.25%.
GBP/USD's immediate downward target is the 2024 low of 1.2361 (April 19). Further south, the next major support comes at the weekly low of 1.2187 (November 10, 2023), which is preceding the October 2023 low of 1.2037 and the main 1.2000 contention zone. On the other hand, the critical 200-day SMA of 1.2572 serves as the initial upward barrier, followed by the April high of 1.2709 (April 9), the weekly top of 1.2803 (March 21), and the 2024 peak of 1.2893 (March 8). North from here emerges the weekly high of 1.2995 (July 27, 2023), which is just above the key 1.3000 yardstick. On the daily chart, the RSI dropped below 30, entering the oversold zone.
Resistance levels: 1.2498 1.2578 1.2641 (4H chart)
Support levels: 1.2361 1.2187 1.2069 (4H chart)
GOLD
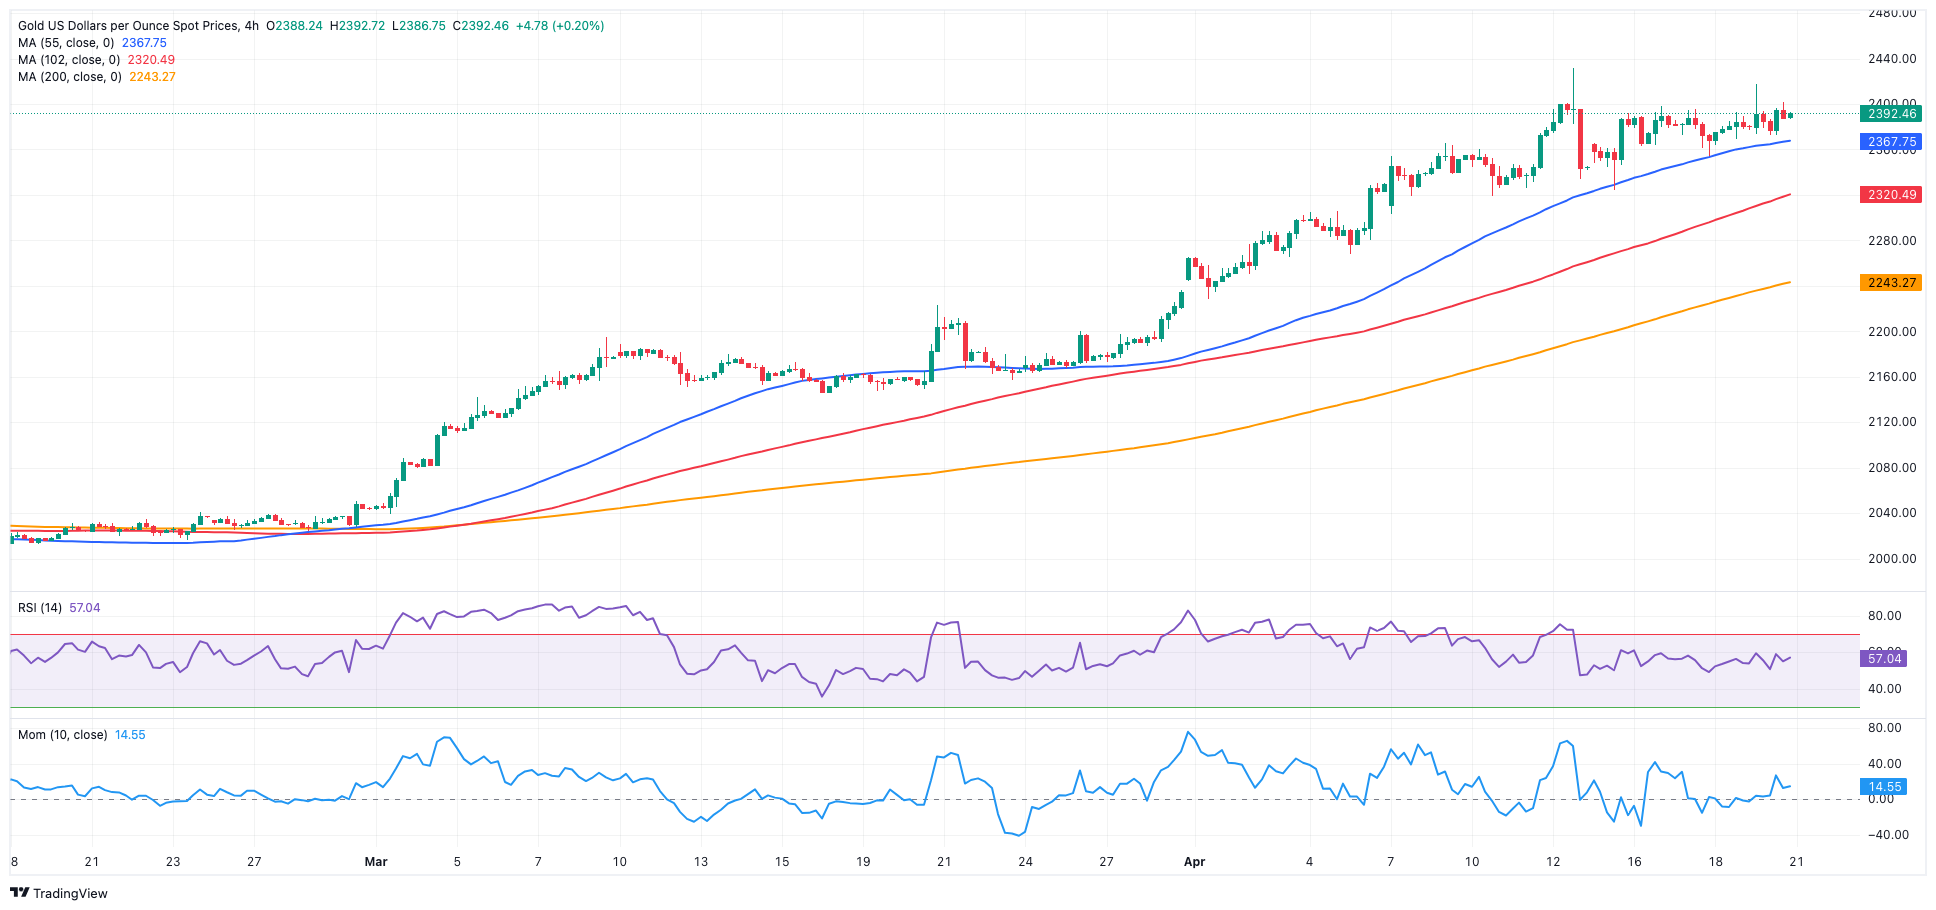
On Friday, gold prices witnessed the continuation of their bullish momentum and advanced past the $2,400 mark per troy ounce, buoyed by ongoing demand for safe-haven assets amid omnipresent geopolitical tensions. That said, the precious metal clinched its five consecutive week of gains.
Additionally, continued purchases from central banks contributed to the upward momentum, along with a tepid downward bias in the dollar and marginal moves in US yields across the curve.
Limiting the upside, however, aligned rising expectations that the Fed might keep its restrictive stance for longer than anticipated, a view that has been recently propped up by Fed officials, including Chief Powell.
Gold is facing immediate resistance at its all-time high of $2,431 (April 12). Just the opposite, the weekly low of $2,146 (March 18) comes first, supported by the preliminary 55-day SMA ($2,161). The breach of the latter indicates a probable decline to the transitory 100-day SMA of $2,103, ahead of the more significant 200-day SMA of $2,019. Down from here comes the 2024 low of $1,984 (February 14) followed by the December 2023 low of $1,973 (December 13) and the November 2023 bottom of $1,931 (November 10). Failure in this position could send the metal down to its October 2023 low of $1,810 (October 6), followed by the 2023 bottom of $1,804 (February 28) and the critical $1,800 conflict zone.
Resistance levels: $2,417 $2,431 (4H chart)
Support levels: $2,324 $2,267 $2,228 (4H chart)
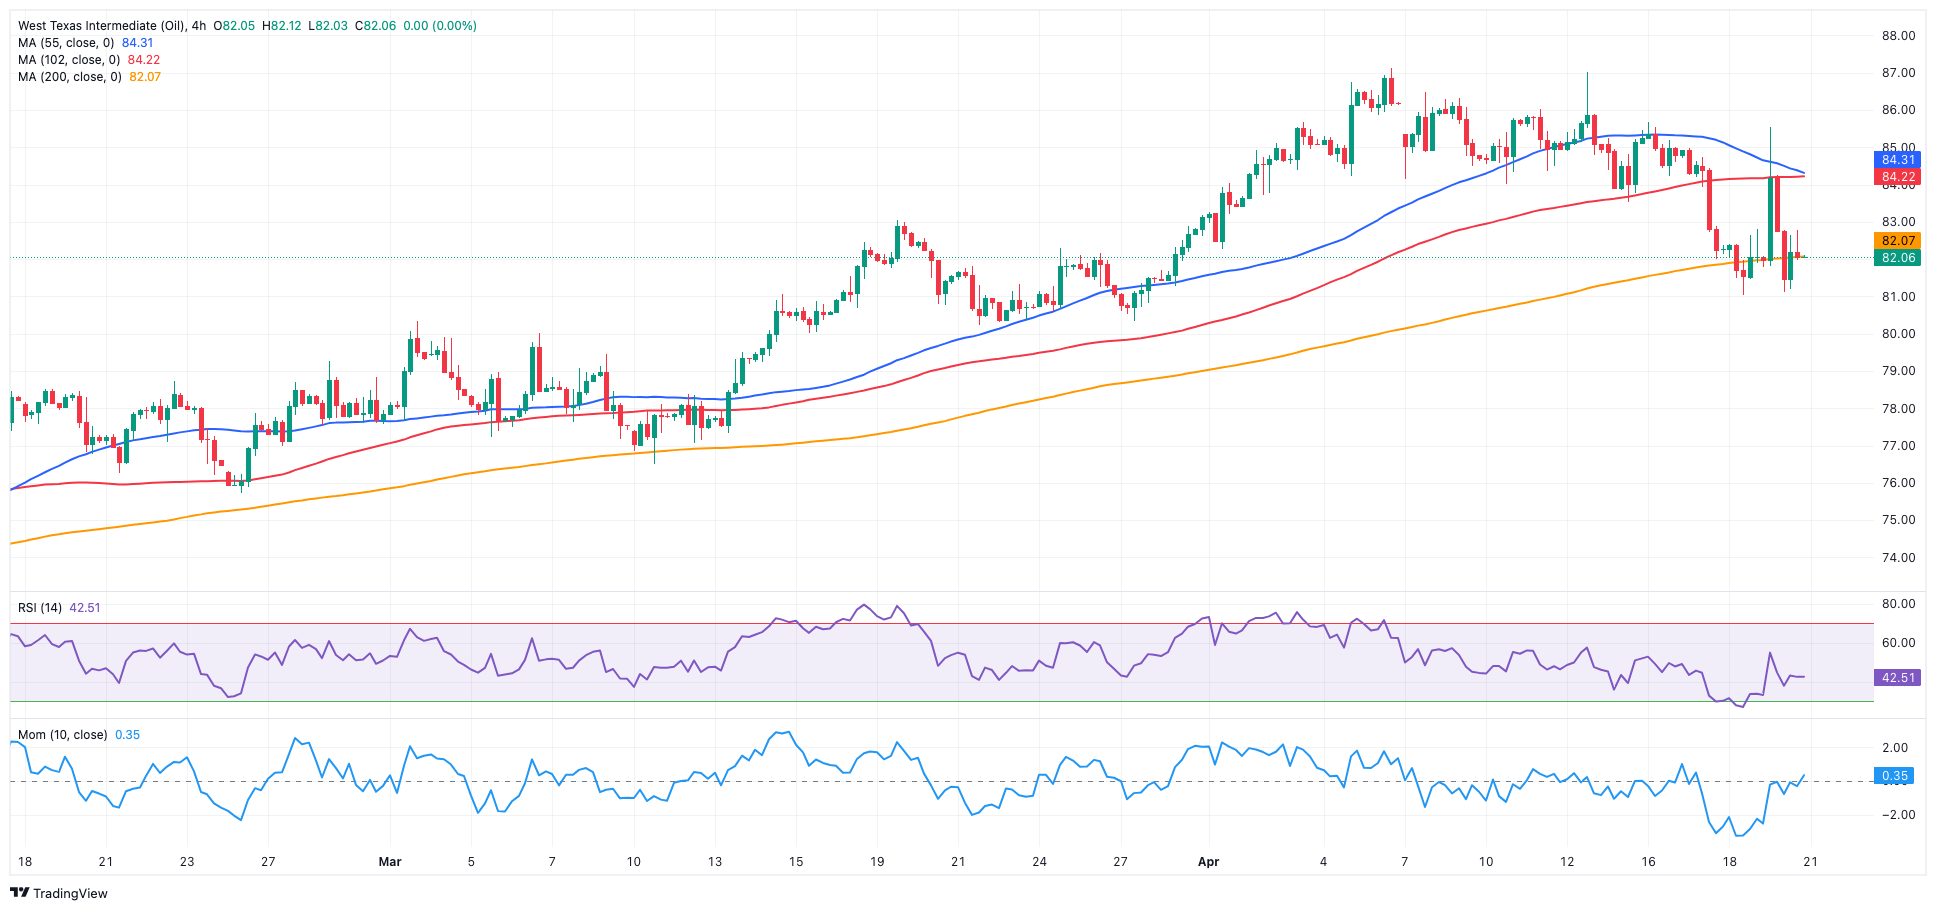
CRUDE WTI
Prices of WTI closed with a modest uptick on Friday but registered the worst weekly drop since February after Iran downplayed a report of an Israeli attack on its territory, suggesting a potential avoidance of an escalation of tensions in the Middle East.
Also weighing on traders’ sentiment came demand concerns, a larger-than-anticipated weekly increase in US crude oil inventories, and news that the IMF anticipated the OPEC+ to commence boosting oil production starting in July.
In the calendar, US total active oil rigs went up by 5 to 511 in the week to April 19.
Next on the downside for WTI is the April low of $81.09 (April 18), seconded by the weekly low of $80.33 (March 21) and the critical 200-day SMA of $79.82. A breach of the latter could put a test of the February low of $71.43 (February 5) back on the radar before the key $70.00 barrier and the 2024 low of $69.31 (January 3). Extra losses from here expose a move to. the December 2023 bottom of $67.74 (December 13). On the flip side, the immediate upward barrier is the 2024 peak of $87.60 (April 12), which precedes the weekly high of $89.83 (October 18, 2023) and the 2023 top of $94.99 (September 28, 2023). The breakout of this level might prompt the commodity to dispute the weekly peak of $97.65 (August 30) prior to the psychological $100.00 hurdle.
Resistance levels: $85.58 $86.14 $87.60 (4H chart)
Support levels: $81.03 $80.51 $76.76 (4H chart)
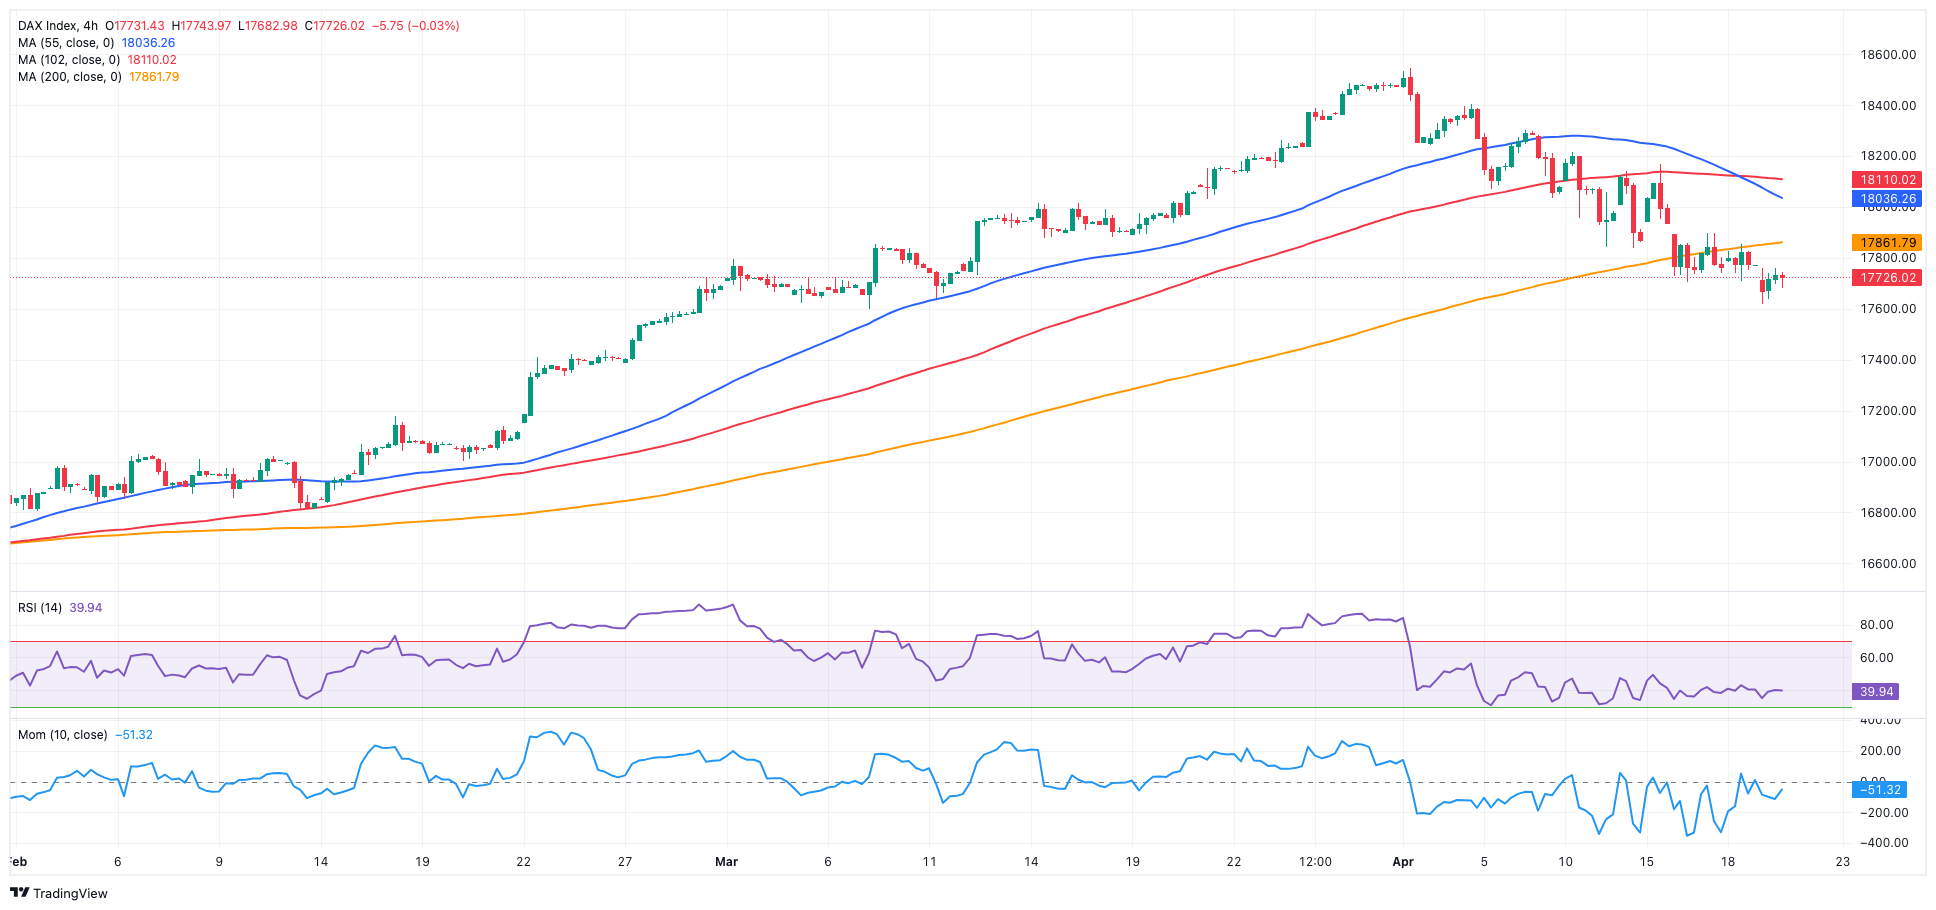
GER40
European markets traded mostly on the defensive on Friday, motivating the German reference DAX40 to revisit six-week lows near the 17,600 region. In addition, the index extended its negative streak for the third week in a row.
Friday’s bearish performance around equities in the old continent came amidst unabated geopolitical tensions in the Middle East.
Speaking about monetary policy, market participants remained wary regarding the increasing likelihood that the ECB might start reducing its interest rates sooner than the Fed.
Additionally, 10-year bund yields rose marginally to the 2.50% level, adding to Thursday’s decent uptick.
The loss of the April low of 17,626 (April 19) may cause the DAX40 to test the March low of 17,619 (March 7). Once sellers clear the latter, a probable test of the February low of 16,821 (February 1) could start shaping up, ahead of the important 200-day SMA of 16,415 and the 2024 bottom of 16,345 (January 17). After falling below this region, the weekly low of 15,915 (November 28) may be revisited, seconded by the October low of 14,630 (October 23) and the 2023 bottom of 14,458 (March 20). On the upside, the next level of resistance is the record high of 18,567 (April 2). The RSI dropped to the vicinity of 41 on the daily chart.
Best Performers: Symrise AG, Qiagen, deutsche Bank AG
Worst Performers: Covestro, Sartorius AG VZO, Infineon
Resistance levels: 18,191 18,427 18,567 (4H chart)
Support levels: 17,626 17,521 16,831 (4H chart)
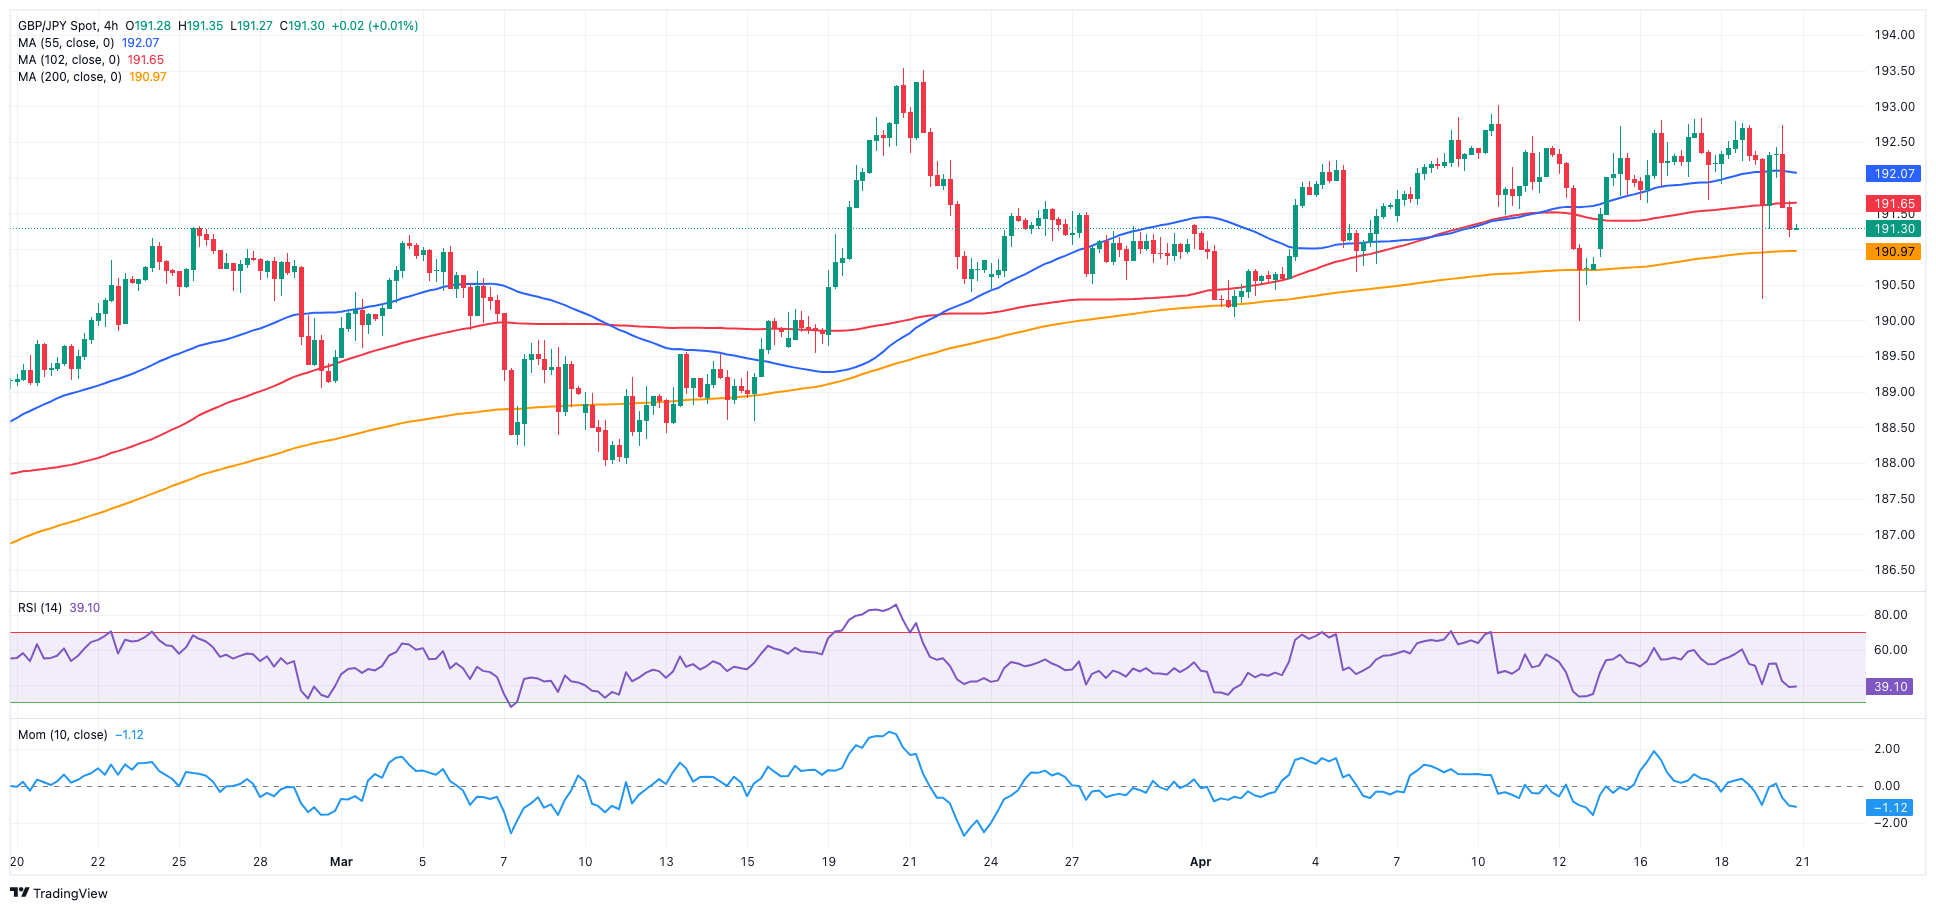
GBPJPY
The marked pullback in sterling sponsored the first daily retracement in GBP/JPY this week, coming under pressure and revisiting the 190.30 region, an area coincident with the provisional 55-day SMA.
The strong decline in the cross also came in tandem with another vacillating session in the Japanese yen, always against the backdrop of persistent FX intervention fears and a slight pullback of yields in Japan’s money market.
At the moment, GBP/JPY appears to be in contention near the 190.00 level during downward swings, while exceeding yearly highs in the mid-193.00 range provides difficulties for immediate upward momentum.
GBP/JPY faces an immediate upside obstacle at the April high of 192.97 (April 10) before reaching the 2024 top of 193.53 (March 20). The breakout of this level might lead to a test of the August 2015 peak of 195.28 (August 18), followed by the record high of 195.88 (June 24, 2015). In the other direction, a break of the April low of 189.99 (April 12) might lead the cross to test the March low of 187.96 (March 11), ahead of the intermediate 100-day SMA of 187.63. The 200-day SMA of 185.57 comes before the February low of 185.22 (February 1) and the December 2023 low of 178.33 (December 14). The everyday RSI tumbled below the 50 threshold.
Resistance levels: 192.81 192.97 193.53 (4H chart)
Support levels: 190.30 189.99 189.54 (4H chart)
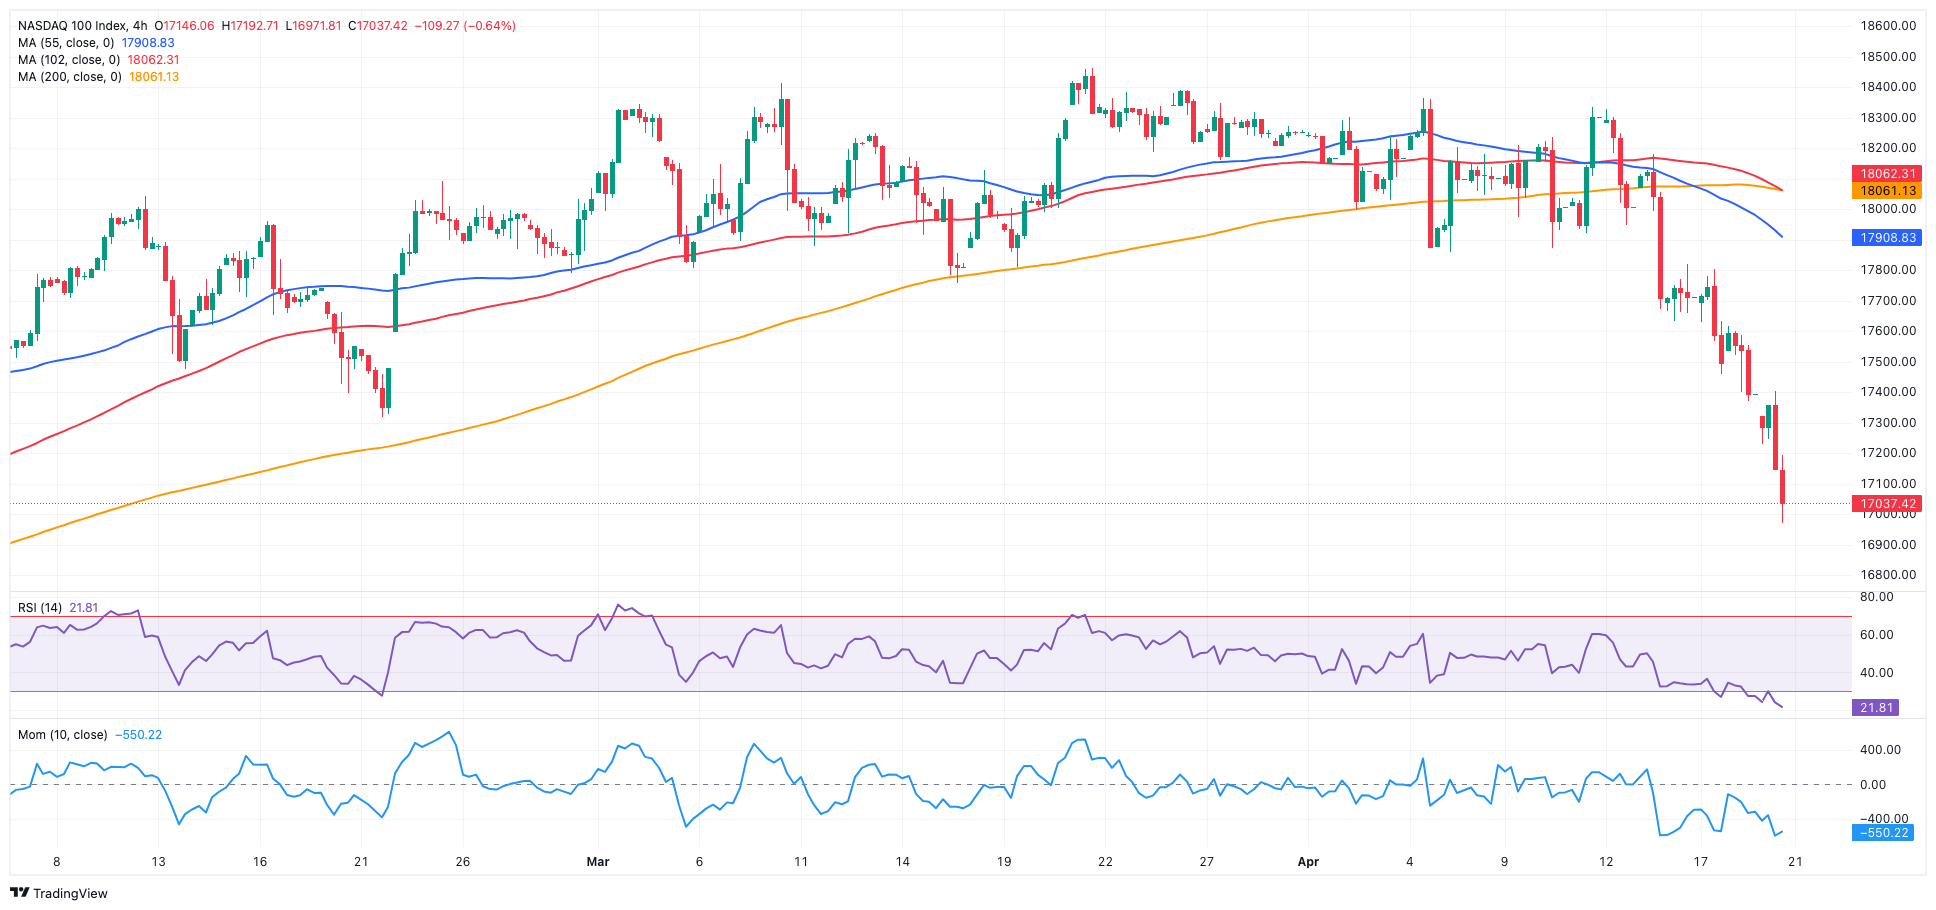
NASDAQ
Extra weakness motivated the tech benchmark Nasdaq 100 to clock its worst session since October 2023 on Friday, retreating to three-month lows in the sub-17,000 zone and clinching its fourth week in a row of losses at the same time.
In fact, tech companies are facing a challenging environment due to the Fed delay in interest rate cuts, increasing uncertainty from upcoming corporate earnings, and escalating geopolitical risks in the Middle East and the Russia-Ukraine front.
Extra losses are expected to dispute the April low of 16,973 (April 19), ahead of the 2024 bottom of 16,249 (January 5) and the key 200-day SMA of 16,266. Further losses could revisit the December 2023 low of 15,695 (December 4) prior to the October 2023 bottom of 14,058 (October 26), and the April 2023 low of 12,724 (April 25), all preceding the March 2023 low of 11,695 (March 13). Just the opposite, if bulls regain momentum, the 55-day SMA of 17,937 emerges as an interim barrier seconded by the all-time high of 18,464 (March 21). The daily RSI flirted with the oversold territory near 30.
Top Gainers: Walgreen Boots, Autodesk, Exelon
Top Losers: NVIDIA, Netflix, AMD
Resistance levels: 17,359 18,337 18,464 (4H chart)
Support levels: 16,973 16,249 15,695 (4H chart)
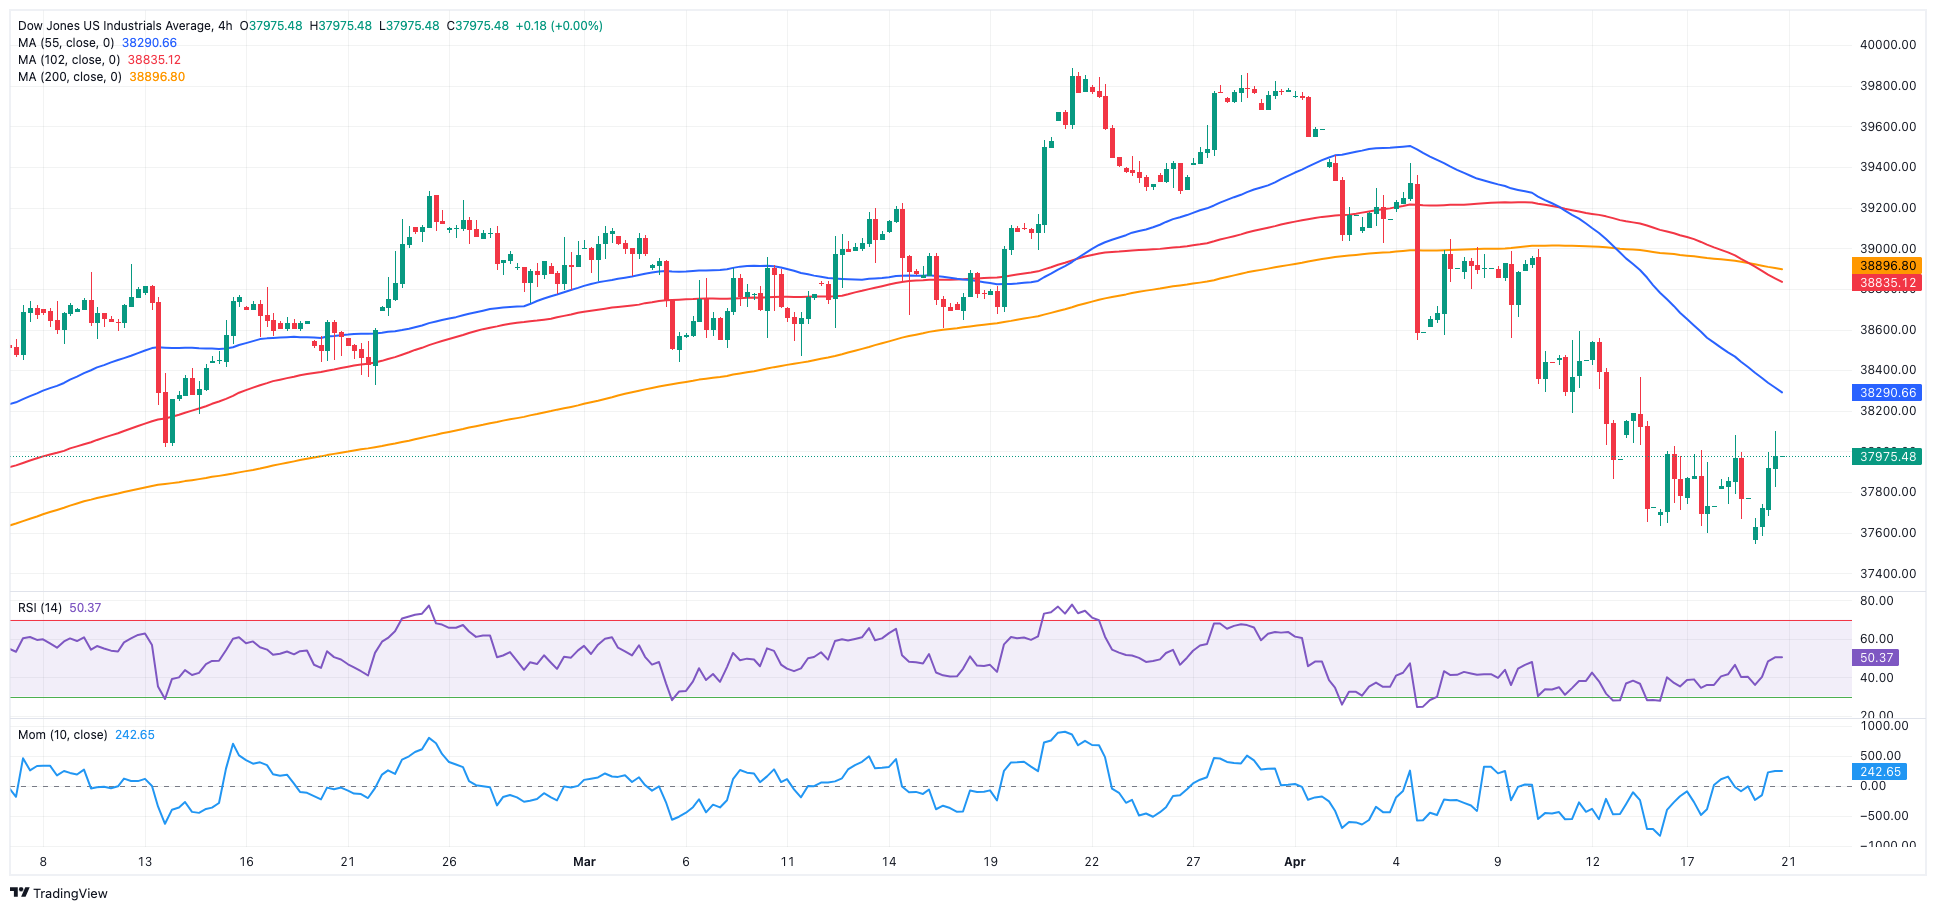
DOW JONES
Unlike its US peers, the stocks reference Dow Jones added to Thursday’s advance and climbed to three-day highs on Friday, also managing to reverse two consecutive weekly retracements.
Meanwhile, the index extended its rebound from earlier three-month lows against the backdrop of persistent geopolitical tensions, a mild pullback of the dollar, anticipations of a postponed interest rate cuts by the Fed, and rising expectations ahead of corporate earnings reports.
At the end of the week, the Dow Jones rose 0.56% to 37,986, the S&P 500 deflated 0.88% to 4,967, and the tech-centric Nasdaq Composite dropped 2.05% to 15,282.
If the Dow Jones falls below its April low of 37,611 (April 17), it may touch the 2024 low of 37,122 (January 18) before the key 200-day SMA of 36,214. The weekly low of 33,859 (November 7, 2023) comes next, ahead of the October 2023 low of 32,327 (October 27), all prior to the 2023 bottom of 31,429 (March 15). The other way around, the temporary 55-day SMA of 38,793 emerges as the next up-barrier ahead of the record high of 39,889 (March 21). The daily RSI scarcely climbed past 38.
Top Performers: American Express, JPMorgan, Amgen
Worst Performers: Amazon.com, Intel, Microsoft
Resistance levels: 38,598 39,421 39,889 (4H chart)
Support levels: 37,611 37,122 36,010 (4H chart)
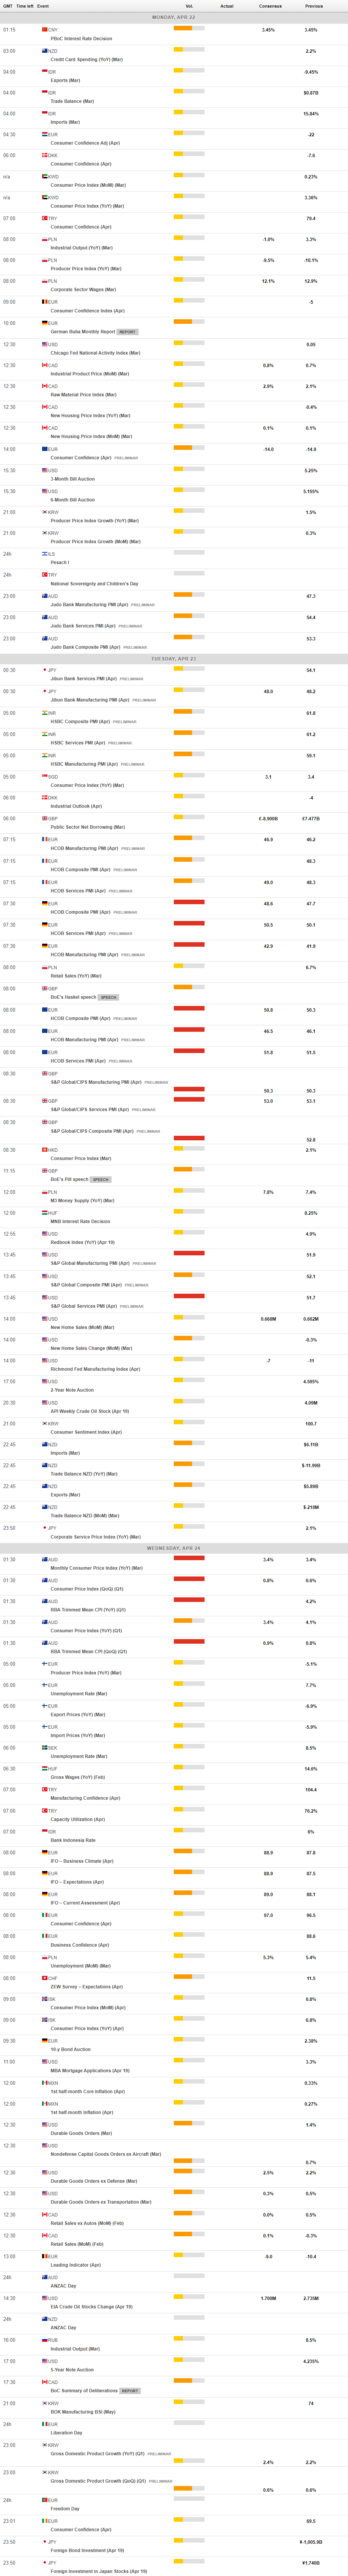
MACROECONOMIC EVENTS
All Information & Updates provided by:

All information relating to the financial markets available on this page has been prepared and issued by FXStreet (Forexstreet SL, Spain, Reg: B62498233) on the basis of publicly available information and all information believed to be reliable and does not conflict with Kuwaiti local laws, and all necessary care has been taken to before the company to ensure that the facts mentioned are correct from the source.
NCM Investment nor any of its directors or employees shall in any way be held responsible for the contents of this news, and the information contained on this page is intended only to provide clients with publicly available information and should not be construed as investment advice, report or analysis and/or constitute an offer or invitation to buy or sell financial instruments of any kind.
RISK WARNING: Forex and CFDs are highly risky leveraged products, as losses can exceed deposits. Please ensure you understand all the risks and take independent advice if necessary. NCM will segregate the clients based on the criteria of the regulator and its bylaws. NCM does not provide any advisory service; the material published does not constitute advice or a recommendation for a transaction in any financial instrument. NCM accepts no responsibility for any use of the content presented and any consequences of that use. Anyone acting on the information provided does so at their own risk.