
- Contact Us:
-

-

-

-


Daily Market Updates
23 Apr 2024
EURUSD
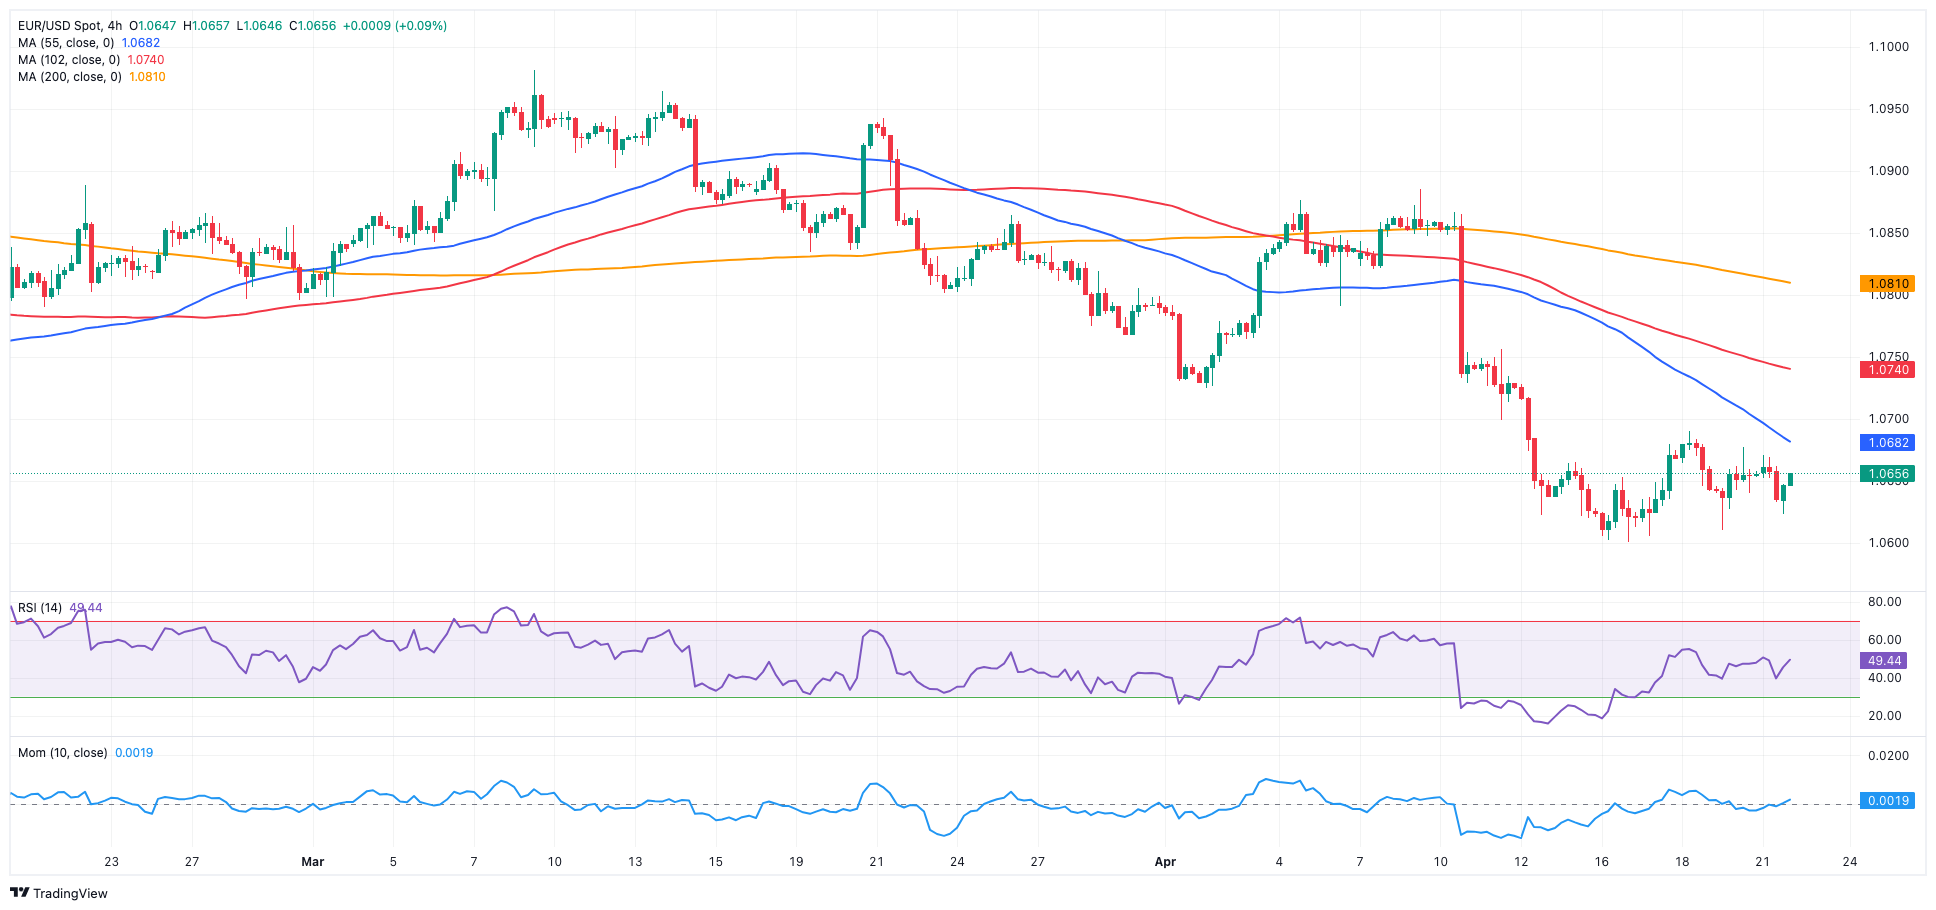
A dull start to the week saw EUR/USD hover around the 1.0650 region amidst an equally inconclusive price development in the greenback.
That said, the USD Index (DXY) hovered just above the 106.00 region, regaining some balance following Friday’s small pullback, all amidst the mixed performance in US yields across various maturities.
Taking a wider view, the policy gap between the Fed and ECB remained the focal point in the FX realm, with investors currently leaning towards a Fed interest rate cut in September compared to the ECB commencing its easing cycle sometime during the summer.
In the euro docket, the advanced Consumer Confidence gauged by the European Commission improved slightly to -14.7 in April.
Across the ocean, the Chicago Fed National Activity Index ticked higher to 0.15 in March.
Extra losses in the EUR/USD might test the 2024 low of 1.0601 (April 16). A deeper drop might reveal a weekly low of 1.0495 (October 13, 2023), well before the 2023 low of 1.0448 (October 3) and the round milestone of 1.0400. In the other direction, immediate resistance lies at the critical 200-day SMA of 1.0814, which comes before the weekly top of 1.0885 (April 9) and the March peak of 1.0981 (March 8). Up from here comes a weekly high of 1.0998 (January 5, 2011), just ahead of the crucial 1.1000 level. The breakout of this zone could put pressure on the December 2023 top of 1.1139 (December 27), which is still supported by the 200-week SMA of 1.1138 and occurs before the 2023 peak of 1.1275 (July 18). The daily RSI receded to around 35.
Resistance levels: 1.0690 1.0756 1.0809 (4H chart)
Support levels: 1.0601 1.0516 1.0495 (4H chart)
USDJPY
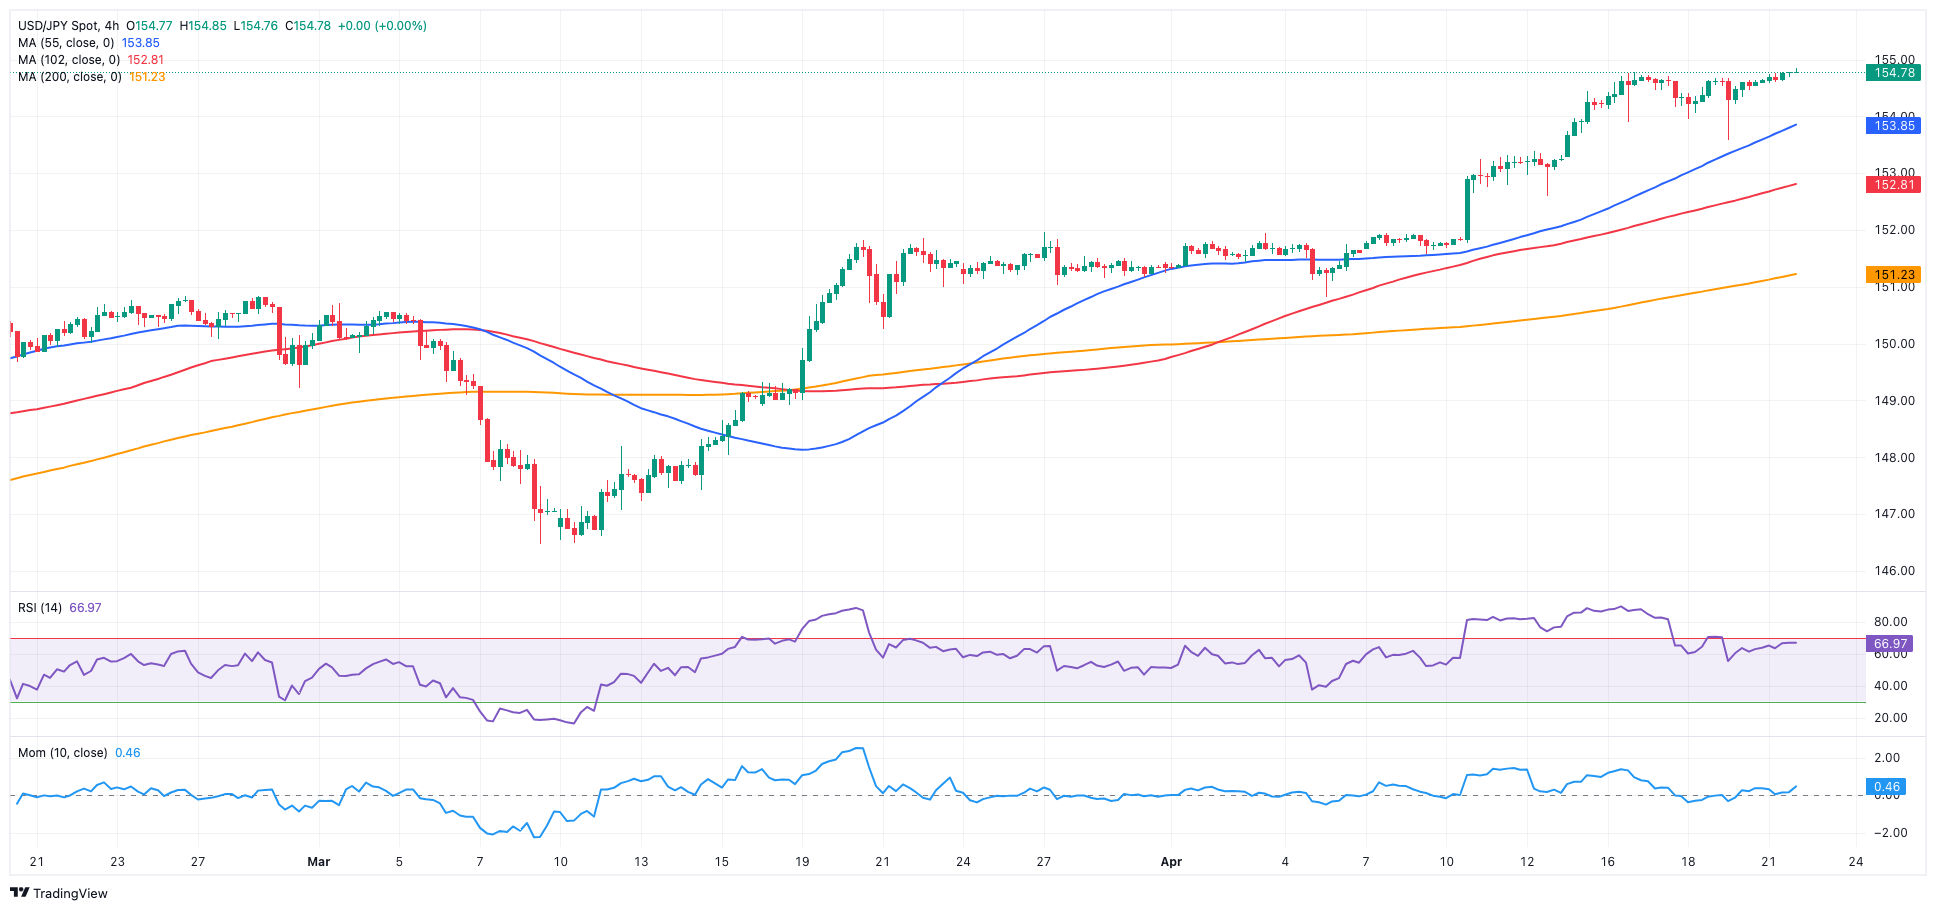
The greenback’s vacillating price action allowed USD/JPY to resume its uptrend at the beginning of the week.
Also accompanying the pair’s auspicious start to the week emerged the mixed tone in US yields across the curve vs. a marked bounce in JGB 10-year yields to the 0.90% zone.
Meanwhile, speculation about the first interest rate cut by the Fed occurring in September continued to rise, while market participants see the BoJ leaving its rates unchanged at its gathering later in the week.
The next upward hurdle for USD/JPY is the 2024 high of 154.78 (April 16), which precedes the June 1990 top of 155.80. Conversely, the pair is anticipated to find first support at the April low of 150.80 (April 5), which is backed by the preliminary 55-day SMA of 150.77. The loss of this region discloses the interim 100-day SMAs at 148.26 and the critical 200-day SMA at 147.70, all before the March low of 146.47 (March 8). A breakdown of this zone might lead to a return to the February low of 145.89 (February 1), which precedes the December 2023 low of 140.24 (December 28), the round number 140.00, and the July 2023 bottom of 137.23 (July 14). The day-to-day RSI climbed past 76, showing the severely overbought condition of spot.
Resistance levels: 154.78 155.80 155.88 (4H chart)
Support levels: 153.58 152.58 151.56 (4H chart)
GBPUSD
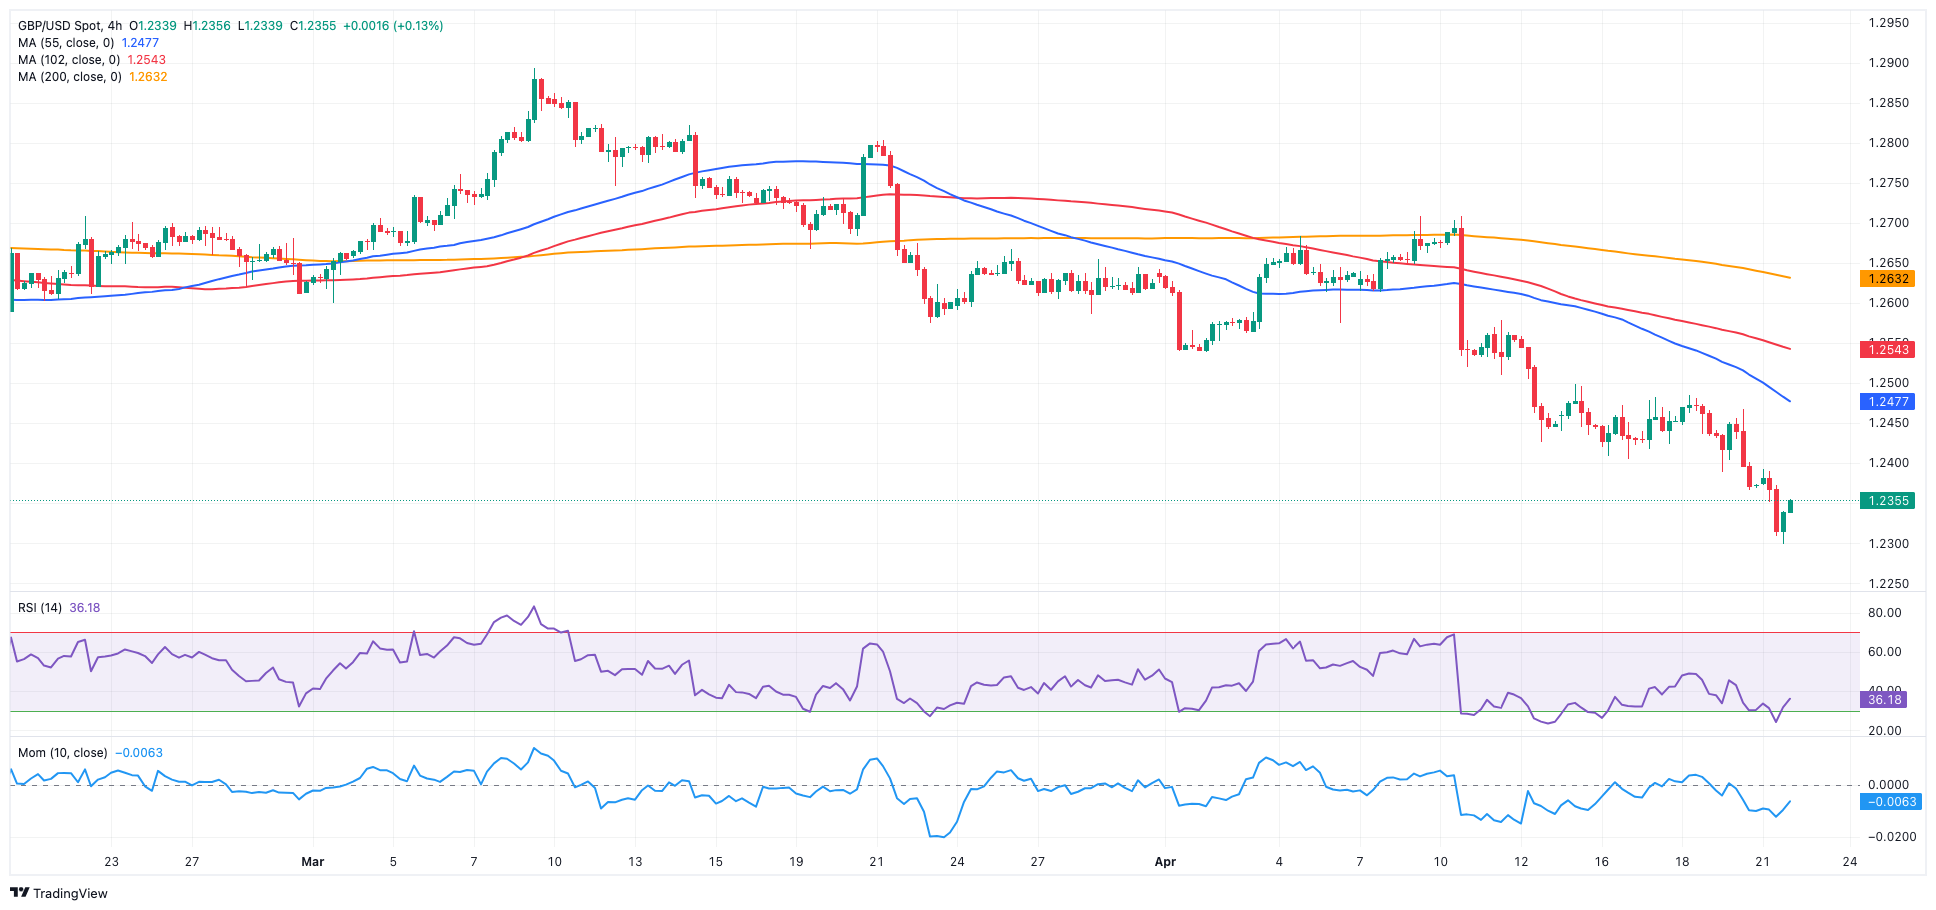
The bearish note around the British pound gathered further pace and dragged GBP/USD to levels last seen in early November, just pips above 1.2300 the figure, where some decent contention seems to have emerged on Monday.
The irresolute mood around the greenback in combination with the divergence in monetary policy by the BoE and the Fed appears to have accelerated the downward bias in Cable at the beginning of the week.
It is worth noting that investors now see the BoE reducing its policy rate twice this year (vs. three times just weeks ago), with the first rate cut priced in in August.
In the UK debt market, 10-year gilt yields rose past 4.25%, leaving behind Friday’s decline.
The UK docket was empty at the beginning of the week.
Next on the downside for GBP/USD emerges the weekly low of 1.2187 (November 10, 2023), which precedes the October 2023 low of 1.2037 and the main 1.2000 contention zone. On the other hand, the important 200-day SMA of 1.2568 acts as the first upward obstacle, followed by the April high of 1.2709 (April 9), the weekly top of 1.2803 (March 21), and the 2024 peak of 1.2893 (March 8). North of here aligns the weekly high of 1.2995 (July 27, 2023), which is just over the important 1.3000 yardstick. On the daily chart, the RSI dropped to the vicinity of 26, entering the oversold zone.
Resistance levels: 1.2498 1.2578 1.2632 (4H chart)
Support levels: 1.2299 1.2187 1.2069 (4H chart)
GOLD
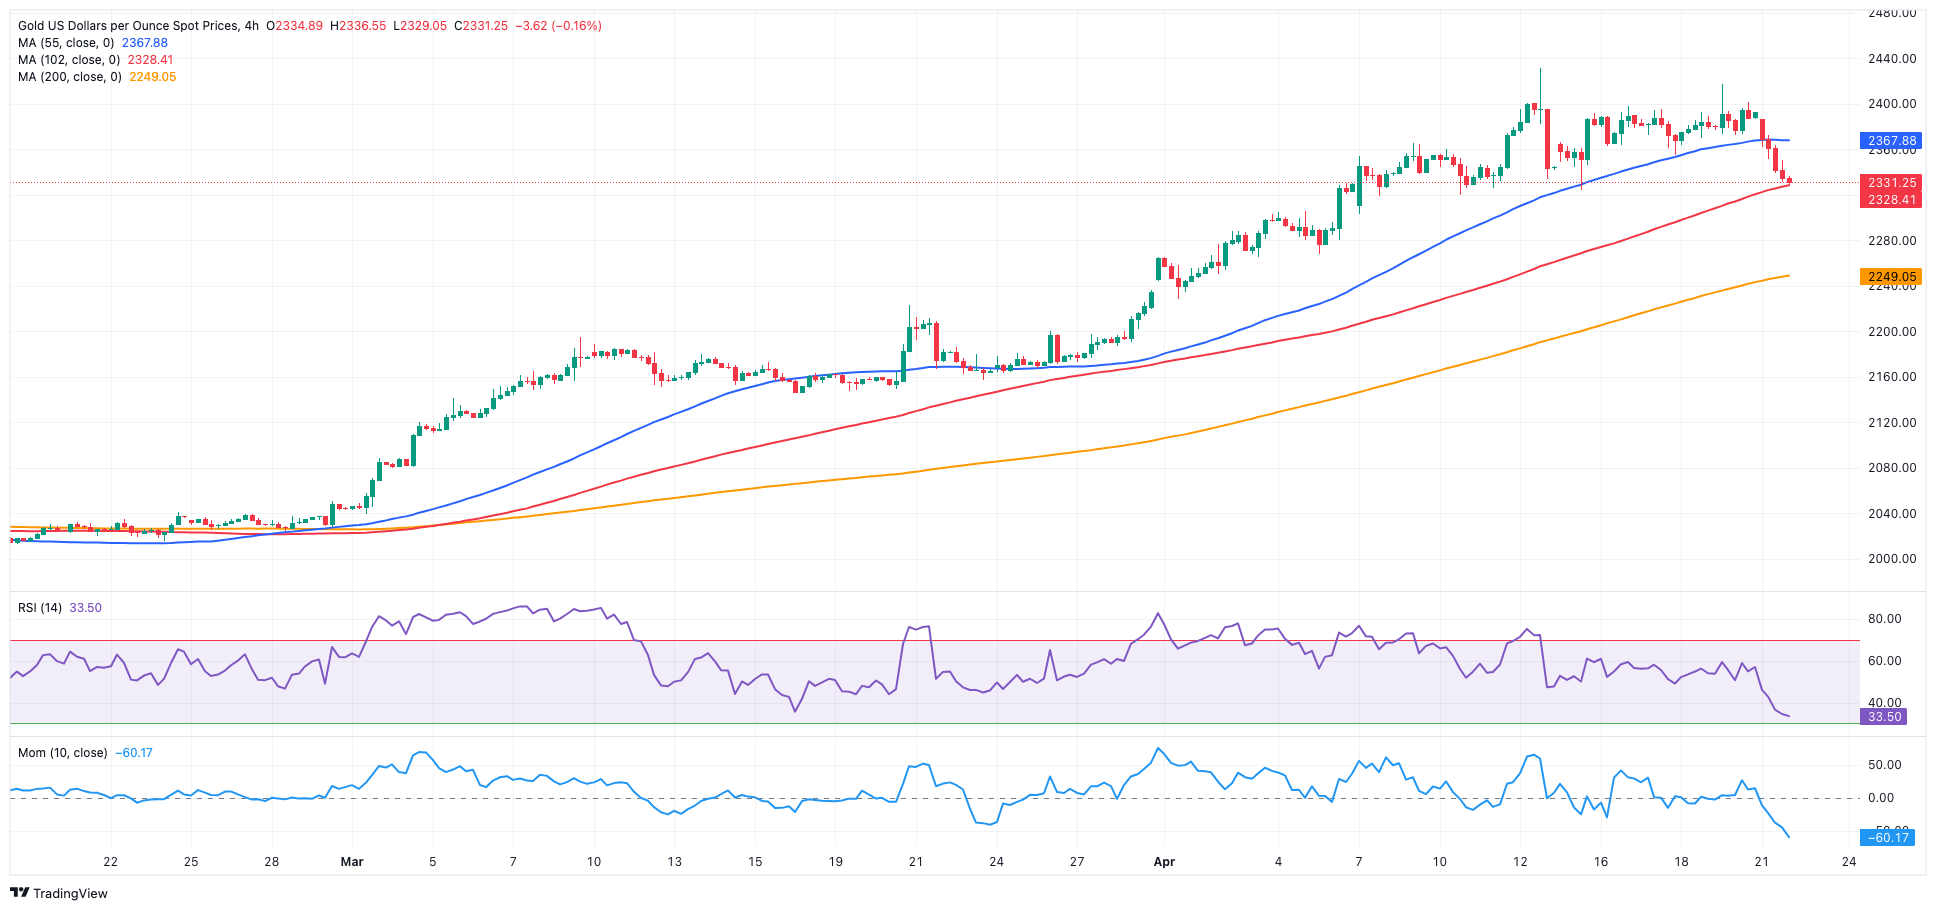
Gold prices started the week on the back foot and retreated to five-day lows near $2,330 per troy ounce on Monday.
The resurgence of selling pressure in the precious metal came on the back of somewhat dwindling geopolitical concerns, while further gains in the dollar also kept the sentiment around the metal depressed.
Moving forward, the next focus of attention for the yellow metal will be the release of US inflation figures tracked by the PCE on Friday, while expectations continue to favour a Fed’s rate cut in September.
Gold faces immediate resistance at its all-time high of $2,431 (April 12). On the contrary, there is a temporary contention at the 55-day SMA of $2,166 seconded by the weekly low of $2,146 (March 18). The breakdown of the latter signals a likely slide to the interim 100-day SMA of $2,106, ahead of the more critical 200-day SMA of $2,021. The 2024 bottom is $1,984 (February 14), seconded by the December 2023 low of $1,973 (December 13) and the November 2023 bottom of $1,931 (November 10). Failure in this position could send the metal down to its October 2023 low of $1,810 (October 6), followed by the 2023 bottom of $1,804 (February 28) and the important $1,800 conflict zone.
Resistance levels: $2,417 $2,431 (4H chart)
Support levels: $2,324 $2,267 $2,228 (4H chart)
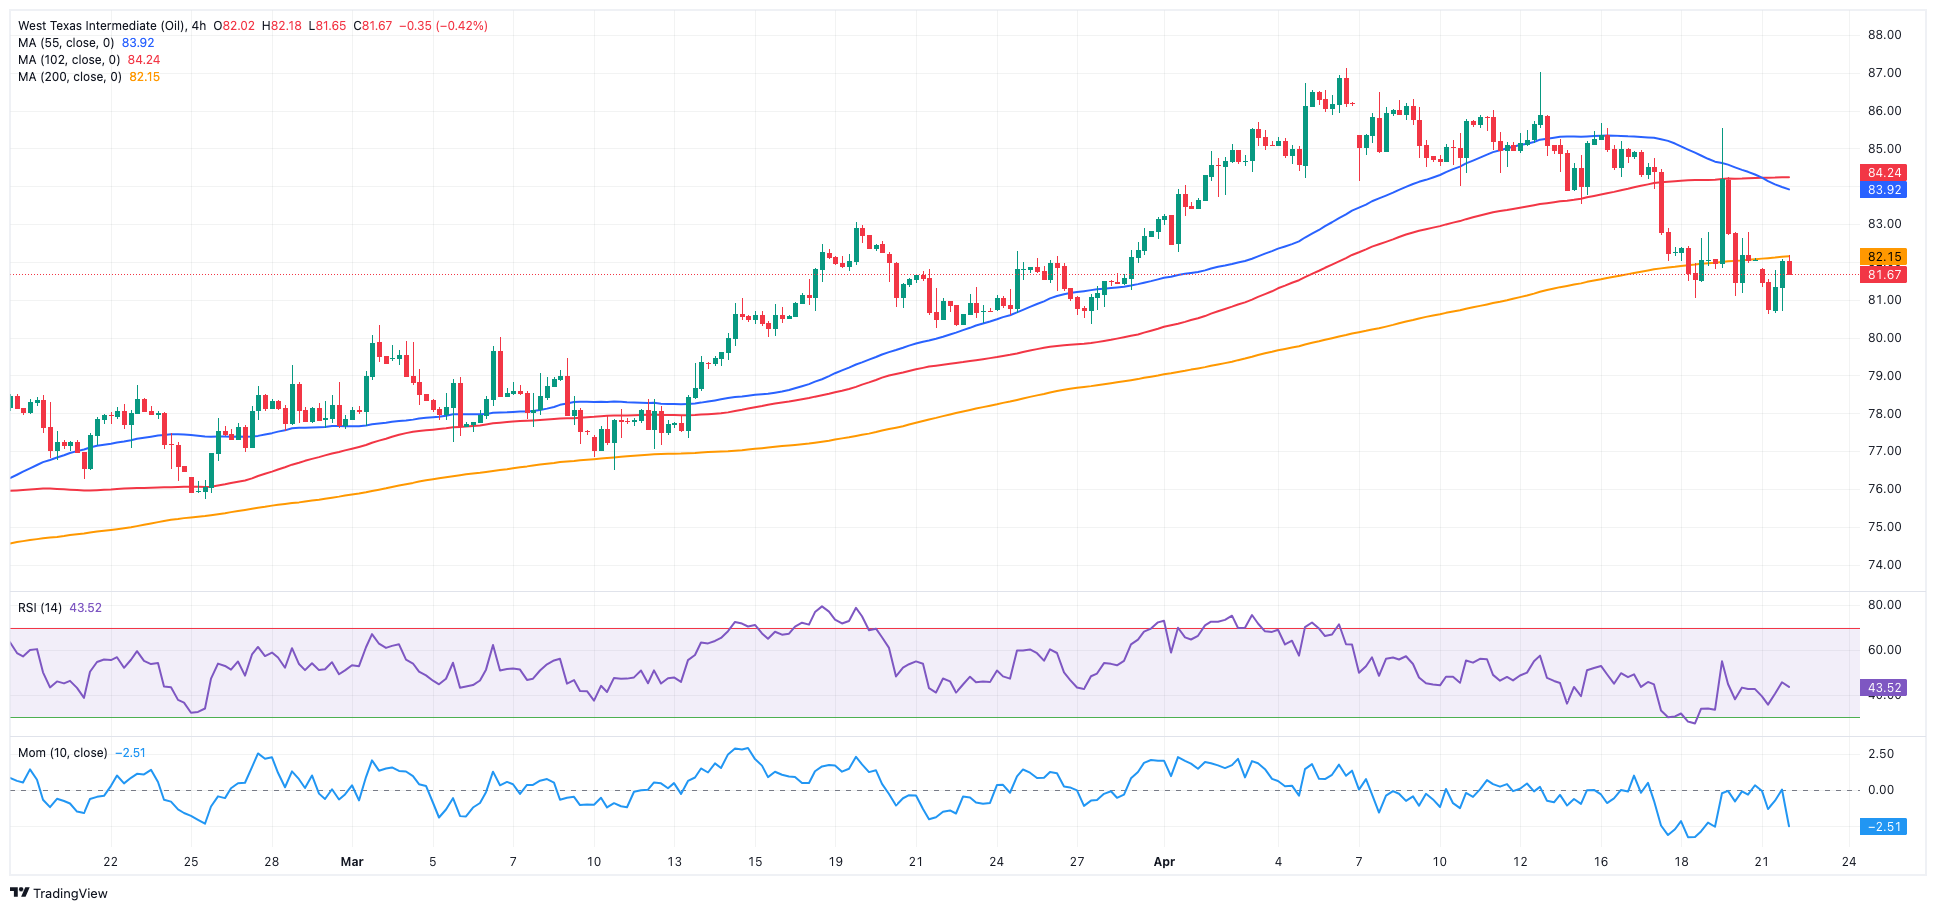
CRUDE WTI
After bottoming out at four-week lows near the $80.00 mark per barrel, prices of WTI managed to gather some balance and regain the $81.00 yardstick and beyond on Monday.
Easing tensions in the Middle East and their unlikely impact on crude oil supply weighed on traders’ sentiment at the beginning of the week, prompting the commodity to shed further ground and trade at shouting distance from the key 200-day SMA ($79.85).
In addition, the likelihood of the Fed starting its easing cycle later than anticipated continued to underpin the greenback, thus keeping prices subdued.
Moving forward, traders’ attention should shift to the upcoming reports on weekly US crude oil inventories by the API and the EIA on Tuesday and Wednesday, respectively.
Next on the downside for WTI is the April low of $80.74 (April 22), followed by the weekly low of $80.33 (March 21) and the key 200-day SMA of $79.85. A breakdown of the latter might reintroduce a test of the February low of $71.43 (February 5) ahead of the critical $70.00 barrier and the 2024 bottom of $69.31 (January 3). Extra losses from here reveal a move to the December 2023 low of $67.74 (December 13). Just the opposite, the immediate upward barrier is the 2024 peak of $87.60 (April 12), which precedes the weekly high of $89.83 (October 18, 2023) and the 2023 top of $94.99 (September 28, 2023).
Resistance levels: $85.58 $86.14 $87.60 (4H chart)
Support levels: $80.68 $80.51 $76.76 (4H chart)
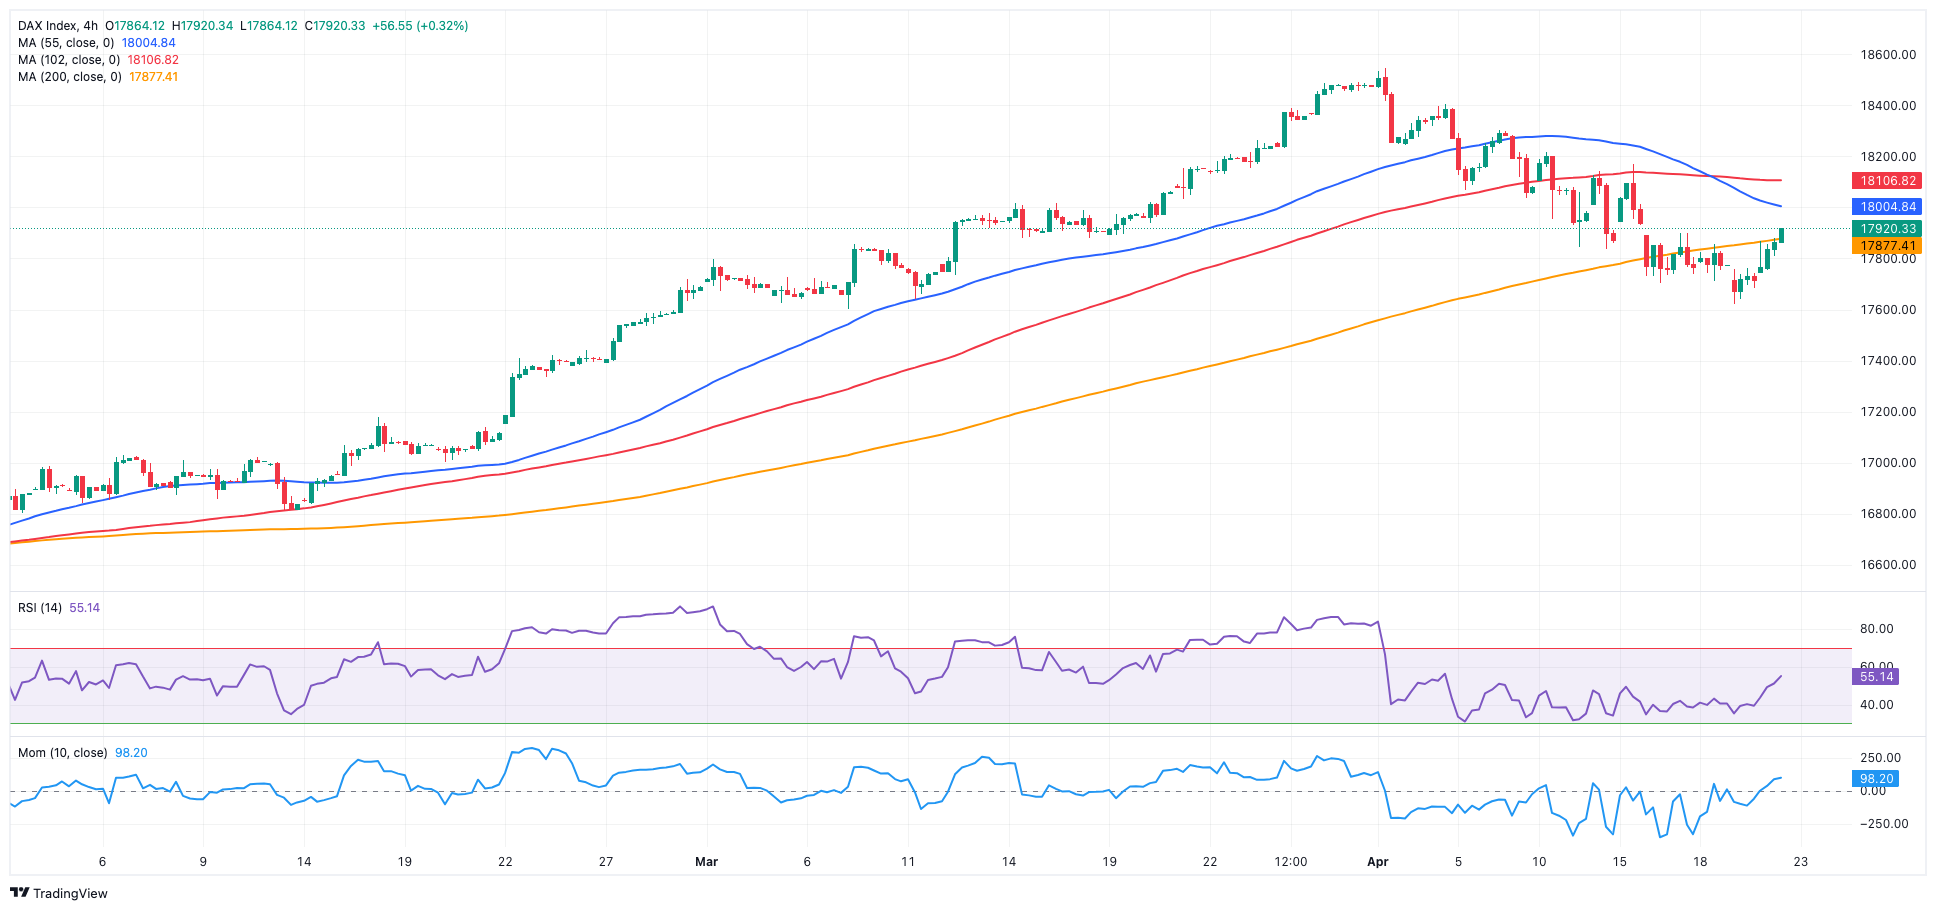
GER40
European equities regained their smile and kicked off the new trading week on a positive note. Against that, Germany’s stock benchmark DAX40 reversed Friday’s multi-week lows and reclaimed the vicinity of the 18,000 mark on Monday.
The recovery in the index came in tandem with easing geopolitical concerns, while investors got ready for upcoming corporate earnings reports on both sides of the Atlantic.
In addition, the likelihood that the ECB might start reducing its interest rates as soon as at its June meeting underpinned further the generalized optimism among market participants.
The daily advance in the DAX40 also contrasted with the small downtick in 10-year bund yields after hitting fresh tops around 2.55%.
If the DAX40 falls below its April low of 17,626 (April 19), it may challenge the March low of 17,619 (March 7). Once sellers clear the latter, a test of the February low of 16,821 (February 1) seems likely, followed by the crucial 200-day SMA of 16,426 and the 2024 bottom of 16,345 (January 17). After dropping below this level, the weekly low of 15,915 (November 28) may be revisited, seconded by the October low of 14,630 (October 23) and the 2023 bottom of 14,458 (March 20). On the upside, the next level of resistance is the record high of 18,567 (April 2). The RSI increased past 46 on the daily chart.
Best Performers: Bayer, Qiagen, Henkel VZO
Worst Performers: Zalando SE, Infineon, RWE AG ST
Resistance levels: 18,191 18,427 18,567 (4H chart)
Support levels: 17,626 17,541 16,831 (4H chart)
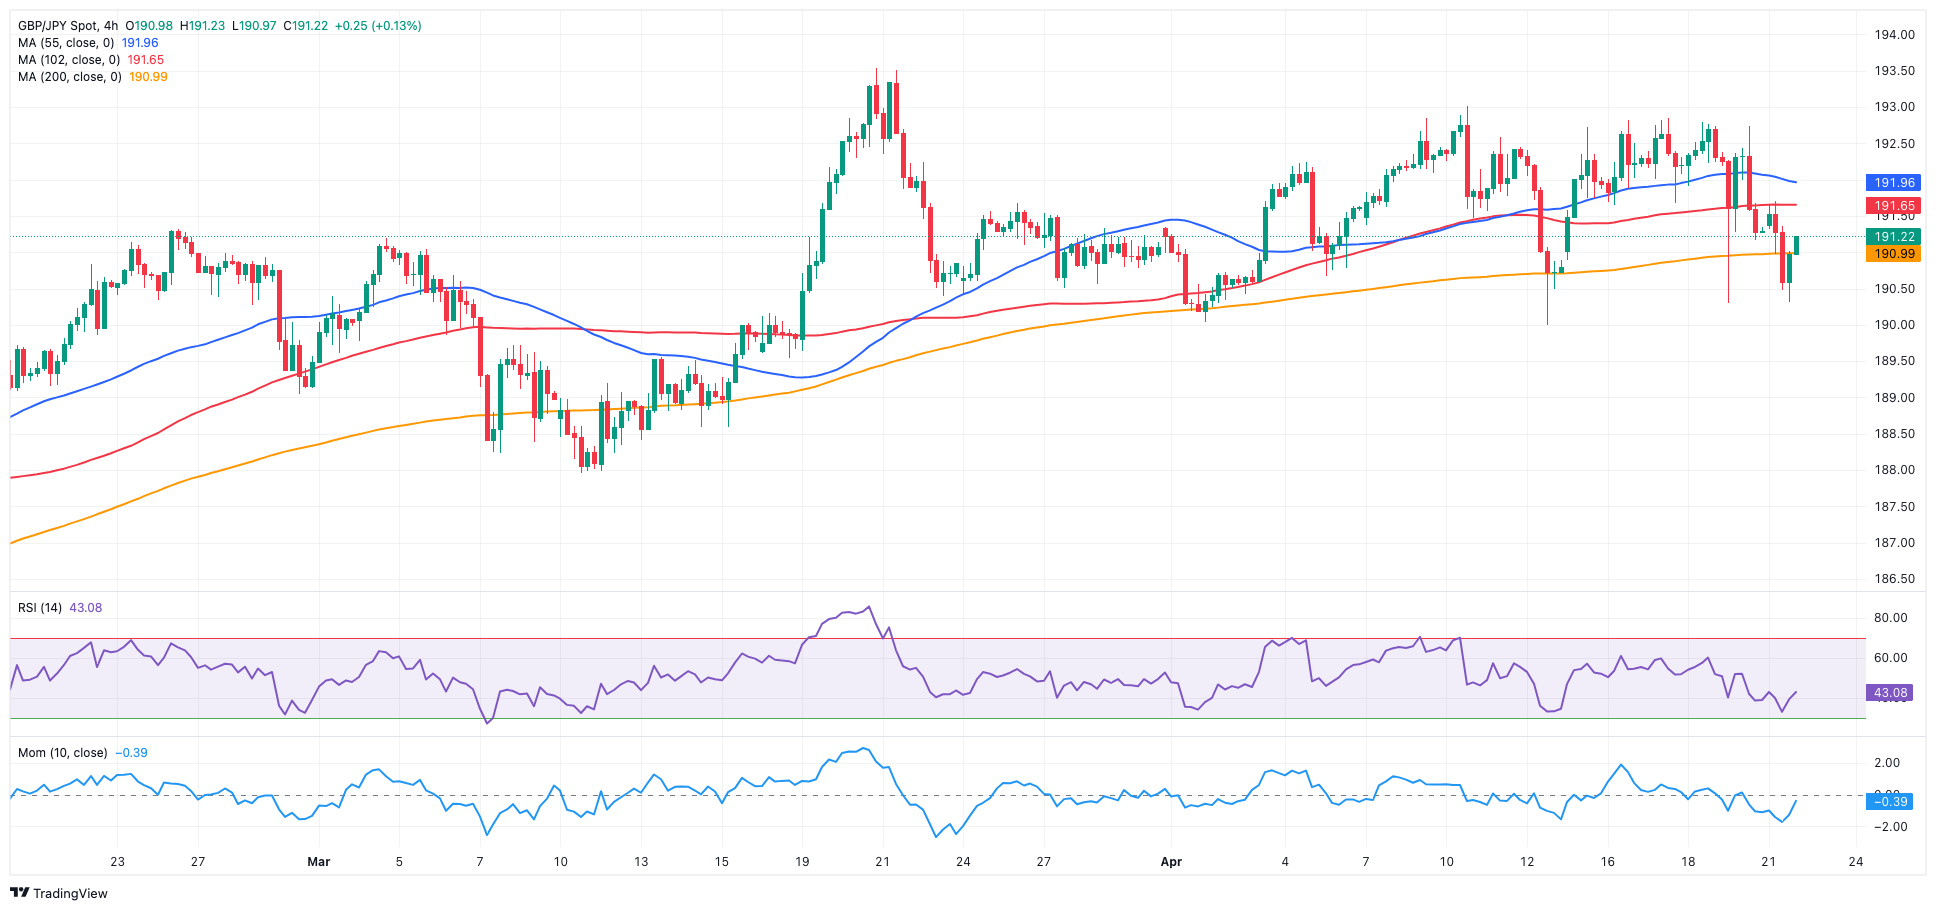
GBPJPY
GBP/JPY bounced off daily lows near 190.30, reclaiming the 191.00 barrier and beyond towards end of Monday’s session.
The marked selling bias in the sterling favoured the continuation of the retracement in the cross, which flirted with the provisional 55-day SMA in the low 190.00s and approached the area of monthly lows at the same time.
On the JPY side of the equation, the Japanese yen traded with slight losses and was always surrounded by speculation of a potential FX intervention by the government and the BoJ.
A breach of the April low of 189.99 (April 12) may cause GBP/JPY to test the March low of 187.96 (March 11), which is ahead of the intermediate 100-day SMA of 187.67. The 200-day SMA of 185.62 is set before the February low of 185.22 (February 1) and the December 2023 low of 178.33 (December 14). On the flip side, immediate upside hurdle emerges at the April high of 192.97 (April 10) before the 2024 top of 193.53 (March 20). The breakout of this level may result in a test of the August 2015 peak of 195.28 (August 18), followed by the record high of 195.88 (June 24, 2015). The everyday RSI eased to around 45.
Resistance levels: 192.81 192.97 193.53 (4H chart)
Support levels: 190.30 189.99 189.54 (4H chart)
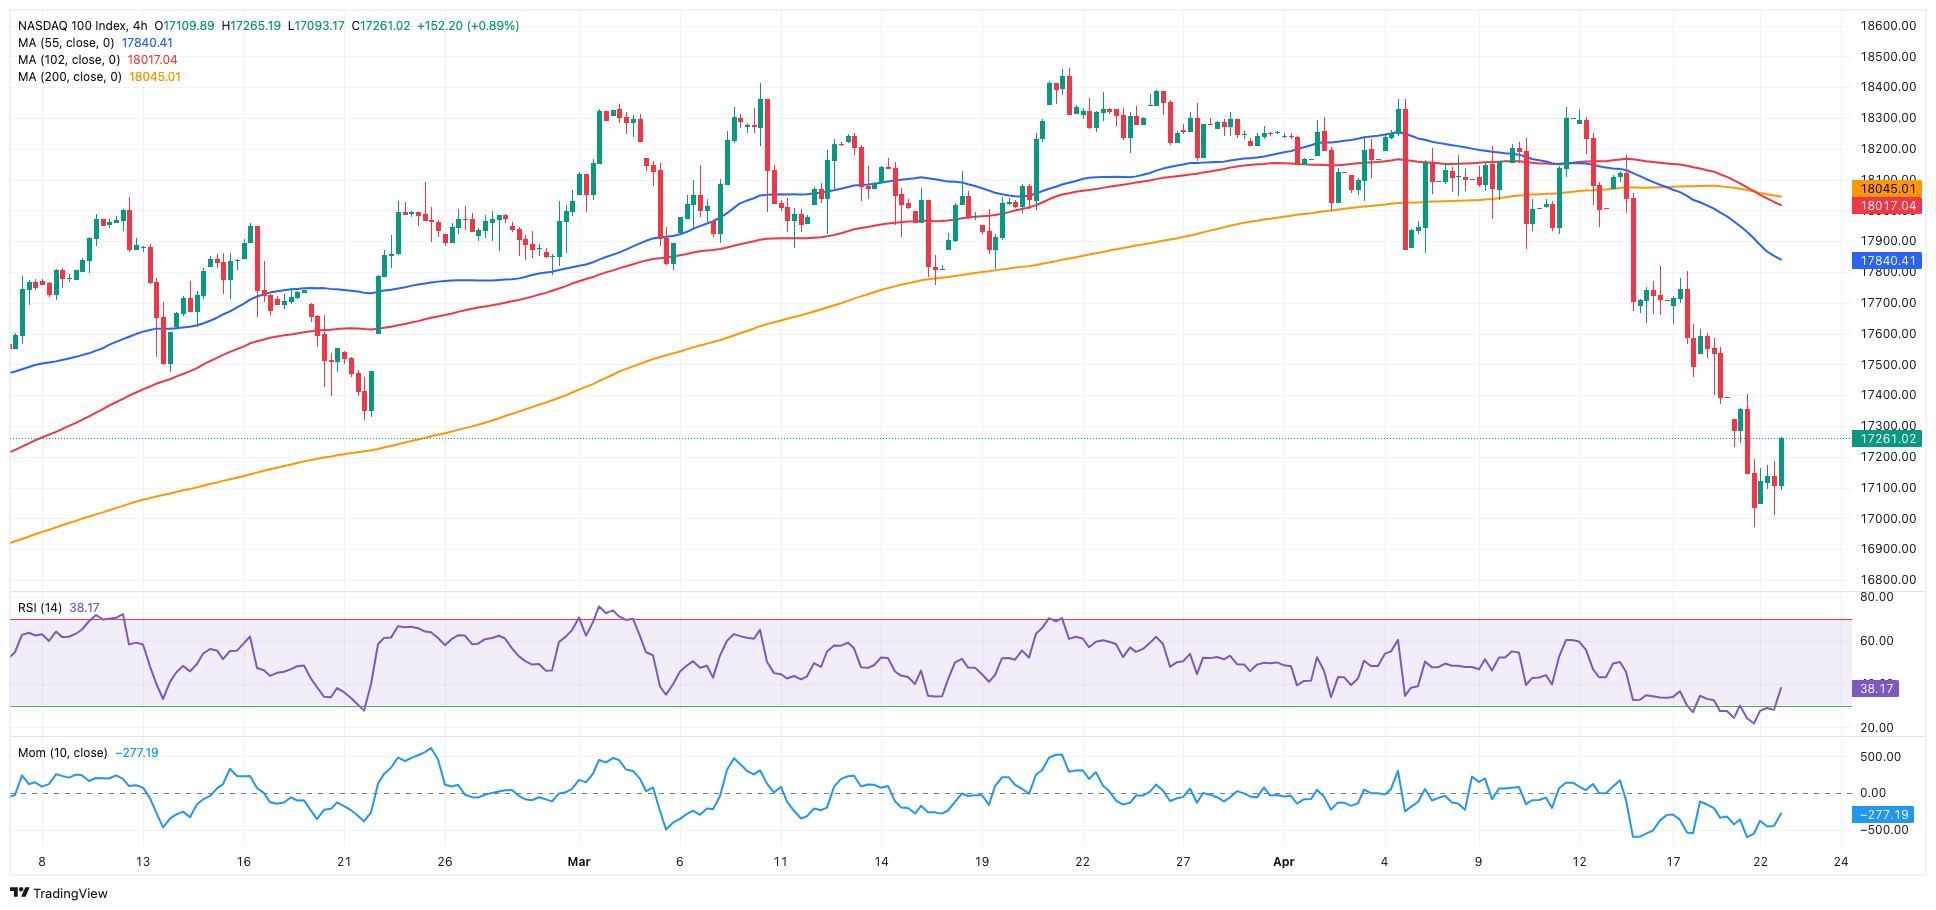
NASDAQ
In tandem with the rest of its US peers, the tech reference Nasdaq 100 printed a decent recovery on Monday, managing to set aside three consecutive daily pullbacks, including Friday’s multi-week lows in the sub-17,000 region.
Indeed, tech companies managed to bypass a difficult landscape as a result of the Fed's postponement of interest rate hikes, refocusing instead on forthcoming corporate earnings, while diminishing geopolitical tensions in the Middle East also contributed to the improved risk appetite trend.
Extra losses are projected to challenge the April low of 16,973 (April 19), which is ahead of the 2024 bottom of 16,249 (January 5) and the critical 200-day SMA of 16,277. Further losses might return to the December 2023 low of 15,695 (December 4), the October 2023 low of 14,058 (October 26), and the April 2023 low of 12,724 (April 25), all before the March 2023 low of 11,695 (March 13). On the contrary, if bulls regain momentum, the 55-day SMA of 17,934 serves as an interim hurdle, prior to the all-time top of 18,464 (March 21). The daily RSI rose beyond the 35 yardstick.
Top Gainers: PDD Holdings, NVIDIA, Moderna
Top Losers: Tesla, MercadoLibre, DoorDash
Resistance levels: 17,364 18,337 18,464 (4H chart)
Support levels: 16,973 16,249 15,695 (4H chart)
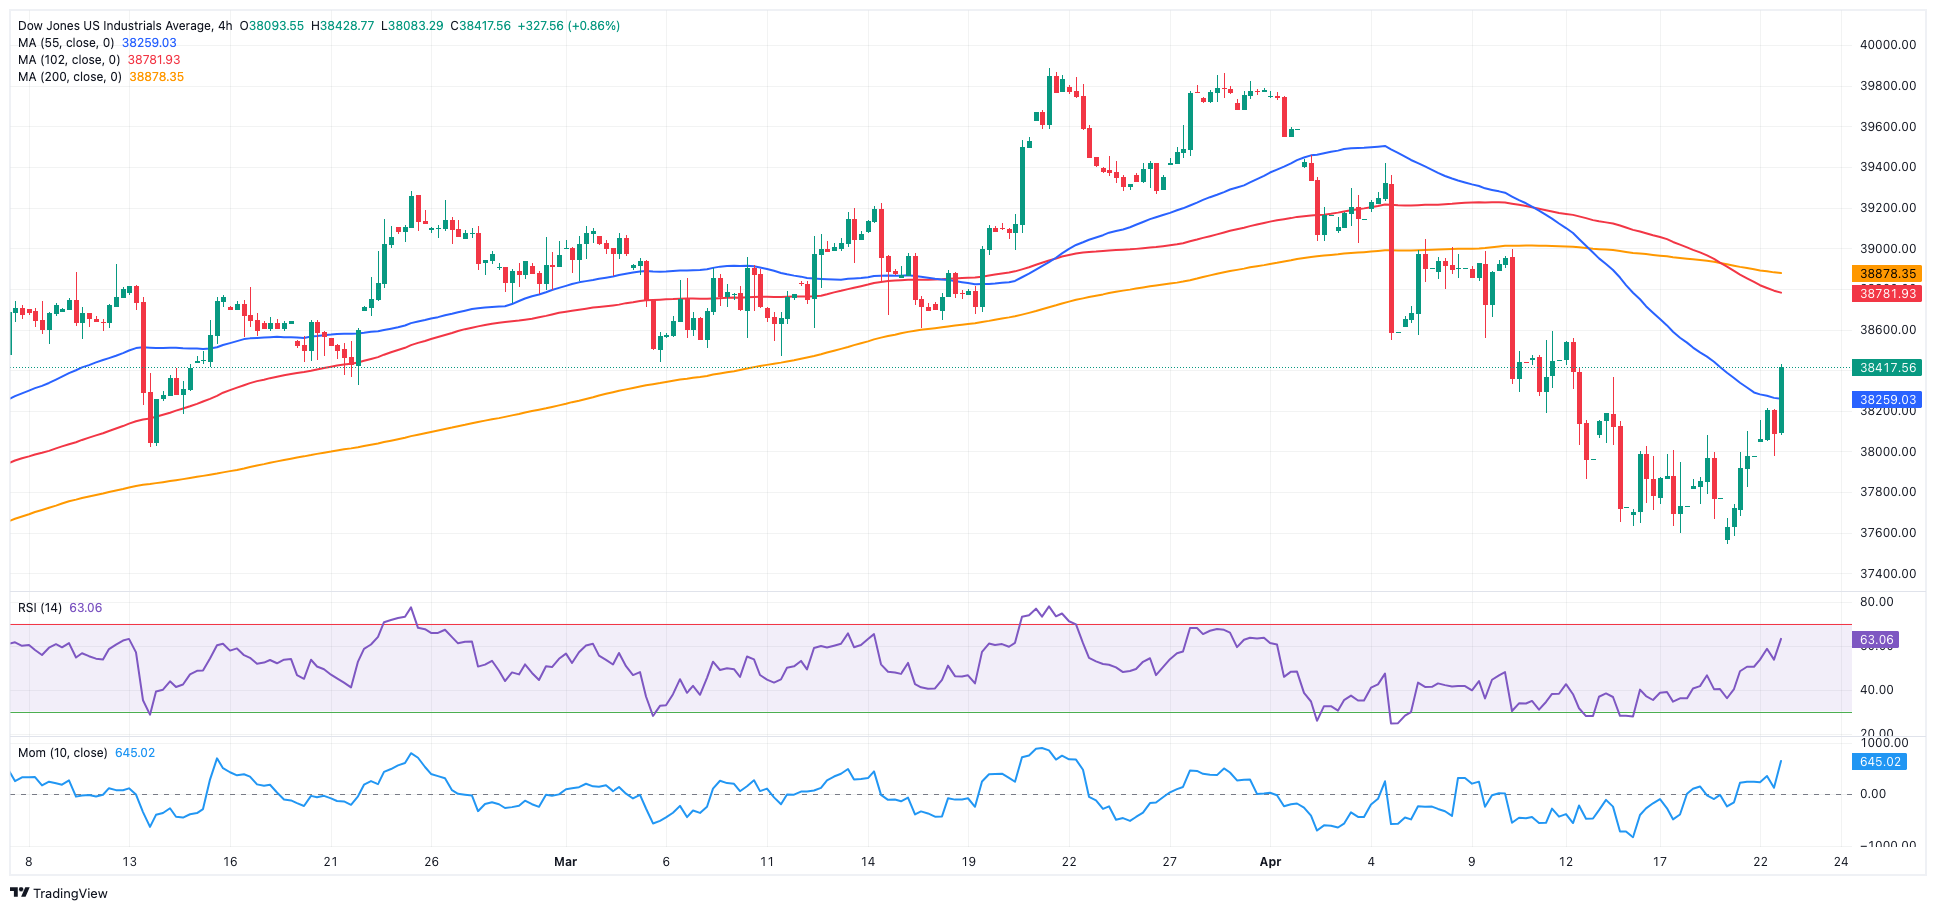
DOW JONES
US equities started the week on a positive note, adding to Friday’s gains amidst volatile trading, while reduced tensions in the Middle East boosted risk appetite.
In addition, market participants anticipated an eventful week ahead, marked by major tech company earnings reports and the release of US inflation data tracked by the PCE in the latter part of the week.
Further strength also came from the loss of momentum in the greenback and the mixed performance of US yields across the curve.
At the beginning of the week, the Dow Jones gained 0.81% to 38,293, the S&P 500 advanced 0.96% to 5,015, and the tech-focused Nasdaq Composite rose 0.89% to 15,419.
If the Dow Jones falls below its April low of 37,611 (April 17), it may reach the 2024 low of 37,122 (January 18), just above the critical 200-day SMA of 36,236. The weekly low of 33,859 (November 7, 2023) comes next, followed by the October 2023 low of 32,327 (October 27), all before the 2023 bottom of 31,429 (March 15). The other way around, the temporary 55-day SMA of 38,789 emerges as the next up-barrier ahead of the record high of 39,889 (March 21). The daily RSI climbed past 45.
Top Performers: Goldman Sachs, Procter&Gamble, Merck&Co
Worst Performers: Verizon, UnitedHealth, Walt Disney
Resistance levels: 38,598 39,421 39,889 (4H chart)
Support levels: 37,611 37,122 36,010 (4H chart)
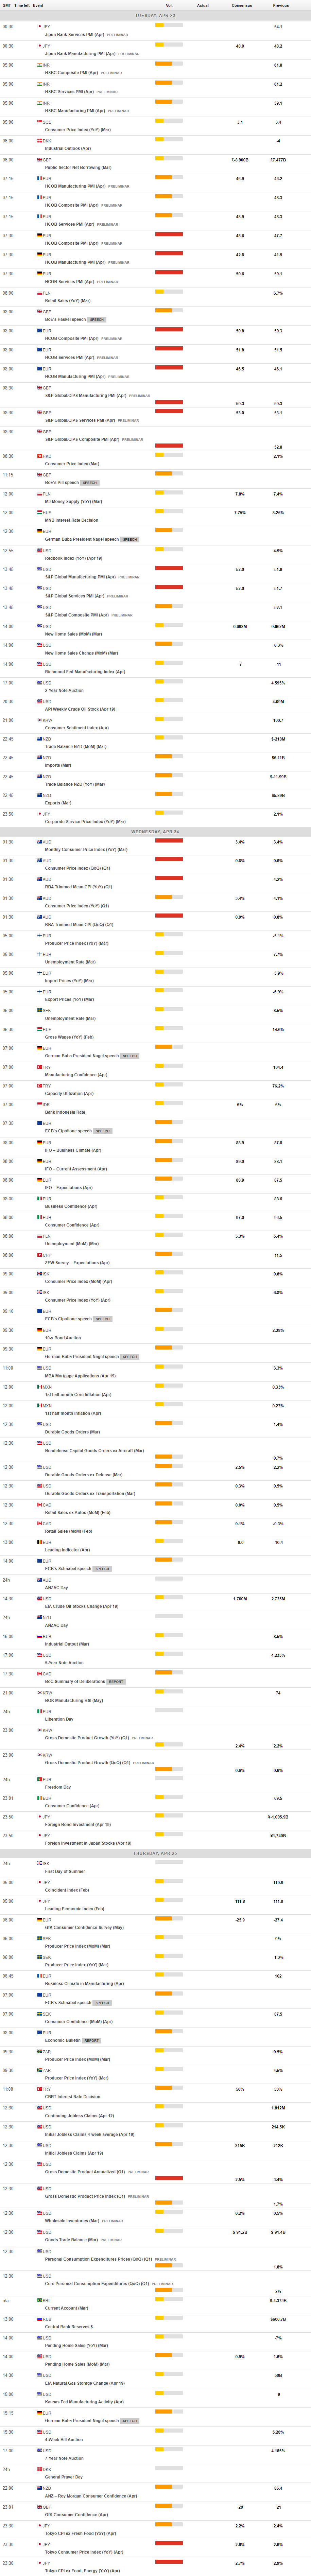
MACROECONOMIC EVENTS
All Information & Updates provided by:

All information relating to the financial markets available on this page has been prepared and issued by FXStreet (Forexstreet SL, Spain, Reg: B62498233) on the basis of publicly available information and all information believed to be reliable and does not conflict with Kuwaiti local laws, and all necessary care has been taken to before the company to ensure that the facts mentioned are correct from the source.
NCM Investment nor any of its directors or employees shall in any way be held responsible for the contents of this news, and the information contained on this page is intended only to provide clients with publicly available information and should not be construed as investment advice, report or analysis and/or constitute an offer or invitation to buy or sell financial instruments of any kind.
RISK WARNING: Forex and CFDs are highly risky leveraged products, as losses can exceed deposits. Please ensure you understand all the risks and take independent advice if necessary. NCM will segregate the clients based on the criteria of the regulator and its bylaws. NCM does not provide any advisory service; the material published does not constitute advice or a recommendation for a transaction in any financial instrument. NCM accepts no responsibility for any use of the content presented and any consequences of that use. Anyone acting on the information provided does so at their own risk.