
- Contact Us:
-

-

-

-


Daily Market Updates
24 Apr 2024
EURUSD
EUR/USD extended its bullish sentiment and rose beyond 1.0700 the figure on Tuesday, clinching fresh multi-day highs, on the back of the resumption of the selling bias in the greenback.
In fact, the USD Index (DXY) retreated markedly and broke below the 106.00 support on the back of the extra improvement in the appetite for the risk-linked assets, while the downside pressure gathered further pace after discouraging prints from US flash PMIs for the month of April.
In a broader sense, the policy divergence between the Fed and the ECB remained the focus point in the FX world, with investors currently leaning towards a Fed interest rate decrease in September while the ECB is expected to begin its easing cycle sometime during the summer.
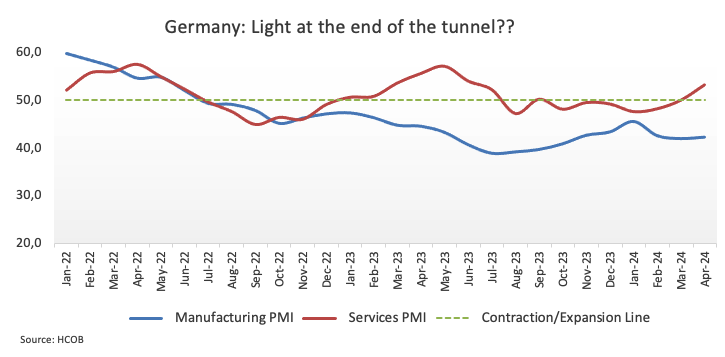
Bolstering the increased optimism around the single currency, advanced Manufacturing and Services PMIs in Germany improved to 42.2 and 53.3, respectively, in April. In the broader Euroland, the preliminary Manufacturing PMI eased to 45.6 and the Services PMI ticked higher to 52.9.
Across the Atlantic, New Home Sales expanded by 8.8% in March from a month earlier and the advanced Manufacturing and Services PMIs came in below estimates at 49.9 and 50.9, respectively.
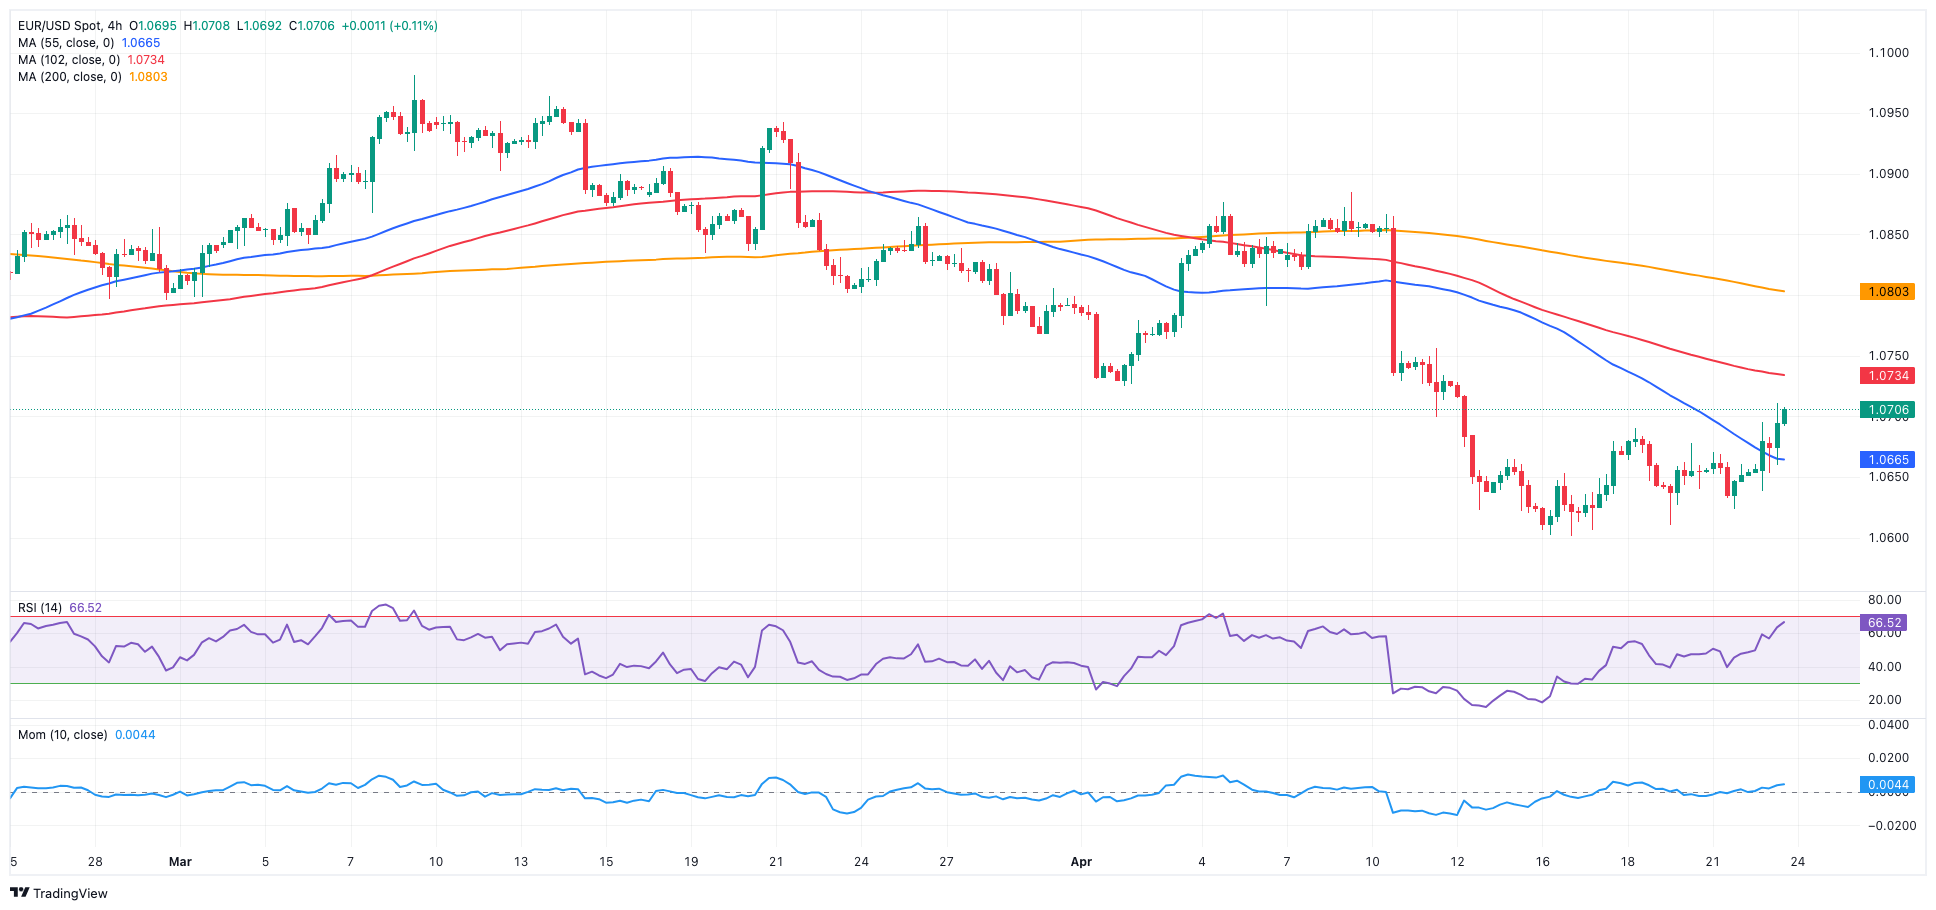
Extra losses in the EUR/USD might test the 2024 low of 1.0601 (April 16). A deeper slide might expose a weekly low of 1.0495 (October 13, 2023), well below the 2023 low of 1.0448 (October 3) and the round milestone of 1.0400. In the opposite direction, immediate resistance is located at the important 200-day SMA of 1.0814, which precedes the weekly high of 1.0885 (April 9) and the March peak of 1.0981 (March 8). Up from here comes a weekly high of 1.0998 (January 5, 2011), just ahead of the critical 1.1000 mark. The breakout of this zone might put pressure on the December 2023 high of 1.1139 (December 27), which is still supported by the 200-week SMA of 1.1138 and happens before the 2023 peak of 1.1275 (July 18). The daily RSI rose to around 45.
Resistance levels: 1.0711 1.0756 1.0802 (4H chart)
Support levels: 1.0601 1.0516 1.0495 (4H chart)
USDJPY
USD/JPY advanced to a new 34-year high near 154.90 amidst the broad-based consolidation range in place since mid-April.
The extra range bound in the pair was accompanied by a sharp decline in the greenback, which was particularly magnified after disheartening preliminary US PMIs for the month of April.
Adding to the dollar’s retracement, US yields dropped accordingly across the curve, while JGB 10-year yields also eased a tad and faded Monday’s decent advance.
It was also PMI-day in Japan, with the flash Jibun Bank Manufacturing and Services PMIs improving to 49.9 and 54.6, respectively, in April.
While market participants largely price in the BoJ, leaving its rates intact at its event later in the week, Governor Ueda remarked earlier in the session that maintaining accommodative monetary conditions was suitable at present due to underlying inflation persisting below 2%. However, he cautioned that if price trends align with expectations and move towards 2%, it would necessitate an increase in short-term interest rates.
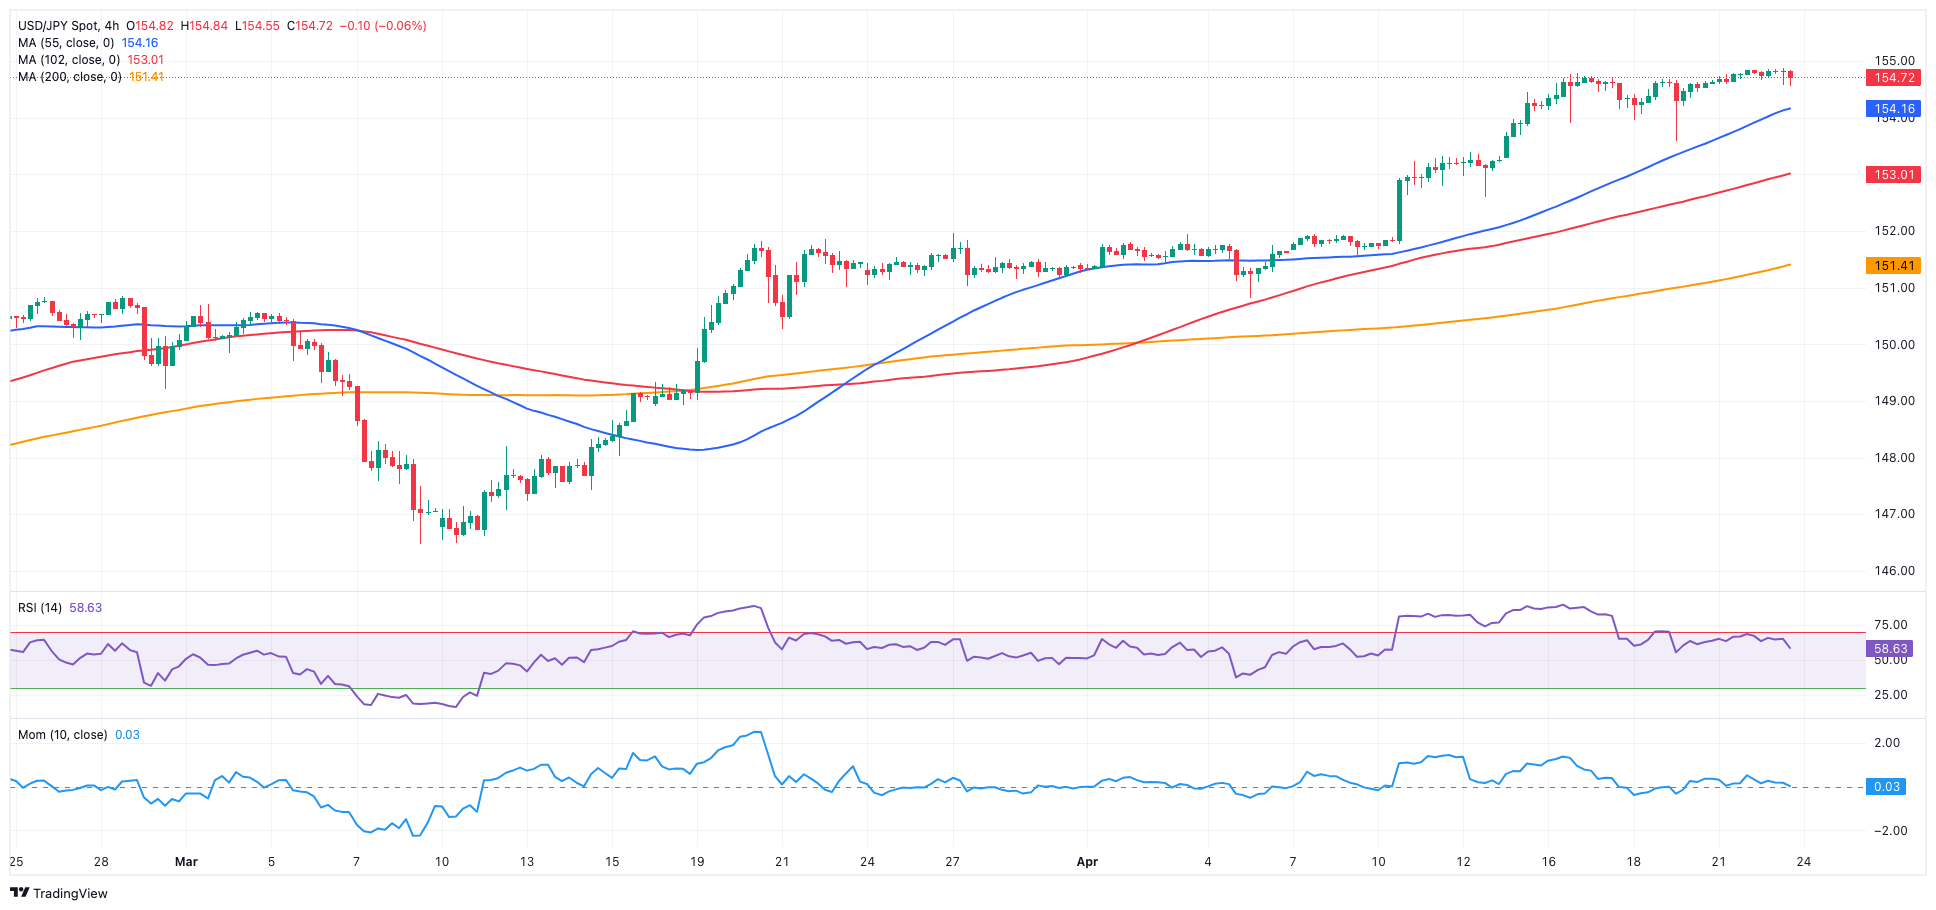
The next upward hurdle for USD/JPY is the 2024 high of 154.78 (April 16), which comes before the June 1990 high of 155.80. Conversely, the pair is expected to find initial support near the April low of 150.80 (April 5), which is supported by the preliminary 55-day SMA of 150.77. The disappearance of this region reveals the interim 100-day SMAs at 148.26 and the key 200-day SMA at 147.70, all prior to the March low of 146.47 (March 8). A breakdown of this zone might result in a return to the February low of 145.89 (February 1), which comes before the December 2023 low of 140.24 (December 28), the round number 140.00, and the July 2023 bottom of 137.23 (July 14). The day-to-day RSI rose over 76, demonstrating the severely overbought condition of spot.
Resistance levels: 154.87 155.80 155.88 (4H chart)
Support levels: 153.58 152.58 151.56 (4H chart)
GBPUSD
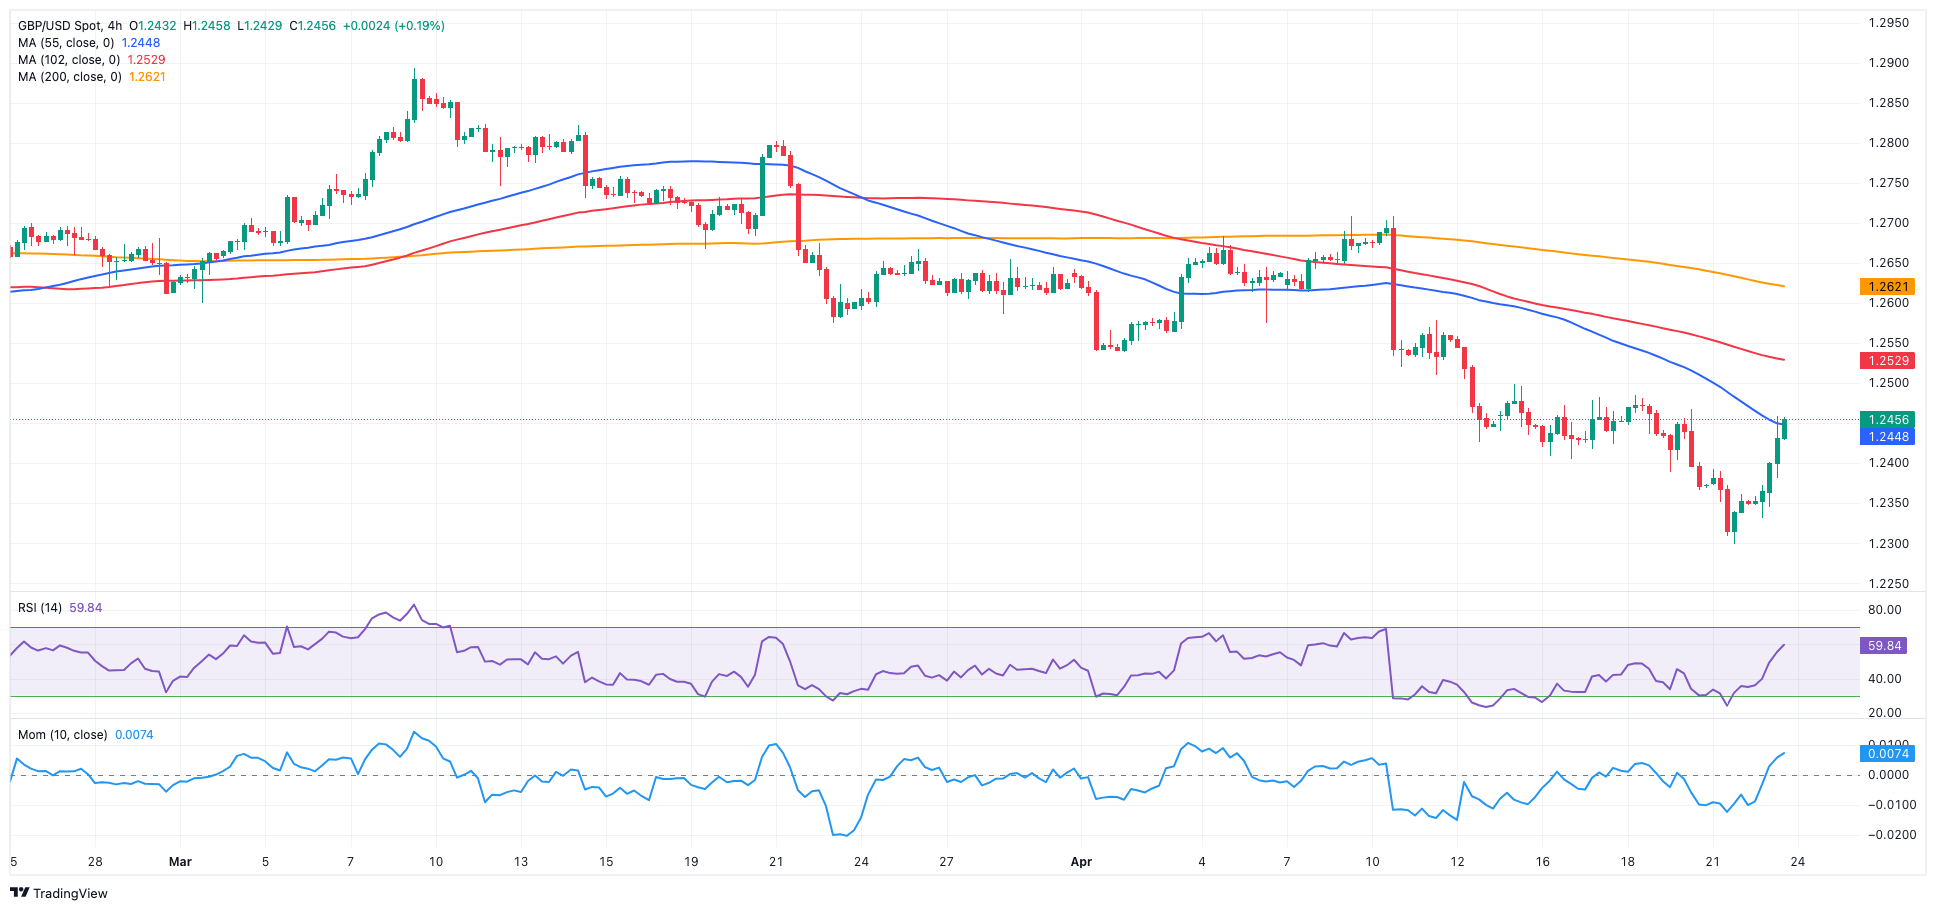
GBP/USD sharply reversed three consecutive sessions of losses and advanced markedly on turnaround Tuesday, reclaiming the area beyond the 1.2400 barrier on the back of intense selling pressure in the US dollar.
In fact, sellers regained control and dragged the greenback to multi-day lows when gauged by the USD Index (DXY) amidst a favourable context for the risk-associated universe, while poor prints from advanced US PMIs also contributed to the buck’s negative performance.
Around the BoE, rate-setter J. Haskel observed that the UK labour market's tightness has been decreasing at a slow pace. He further noted that the duration of inflation will be shaped by the state of labour market tightness. When questioned about the possibility of inflation remaining at 2%, Haskel highlighted the importance of weighing the potential upside risks. His colleague H. Pill, in the meantime, remained cautious and argued that an interest rate reduction is still some way off.
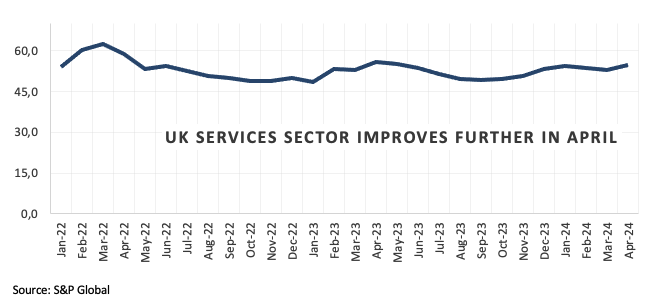
In the UK, preliminary Manufacturing and Services PMIs showed a mixed performance in April.
The significant 200-day SMA of 1.2565 serves as the initial upward barrier for GBP/USD, followed by the April high of 1.2709 (April 9), the weekly top of 1.2803 (March 21), and the 2024 peak of 1.2893 (March 8). North of here lies the weekly high of 1.2995 (July 27, 2023), which is just above the critical 1.3000 level. On the other hand, emerges the 2024 bottom of 1.2299 (April 22) followed by the weekly low of 1.2187 (November 10, 2023), which comes before the October 2023 low of 1.2037 and the main 1.2000 contention zone. On the daily chart, the RSI jumped past 41.
Resistance levels: 1.2498 1.2578 1.2621 (4H chart)
Support levels: 1.2299 1.2187 1.2069 (4H chart)
GOLD
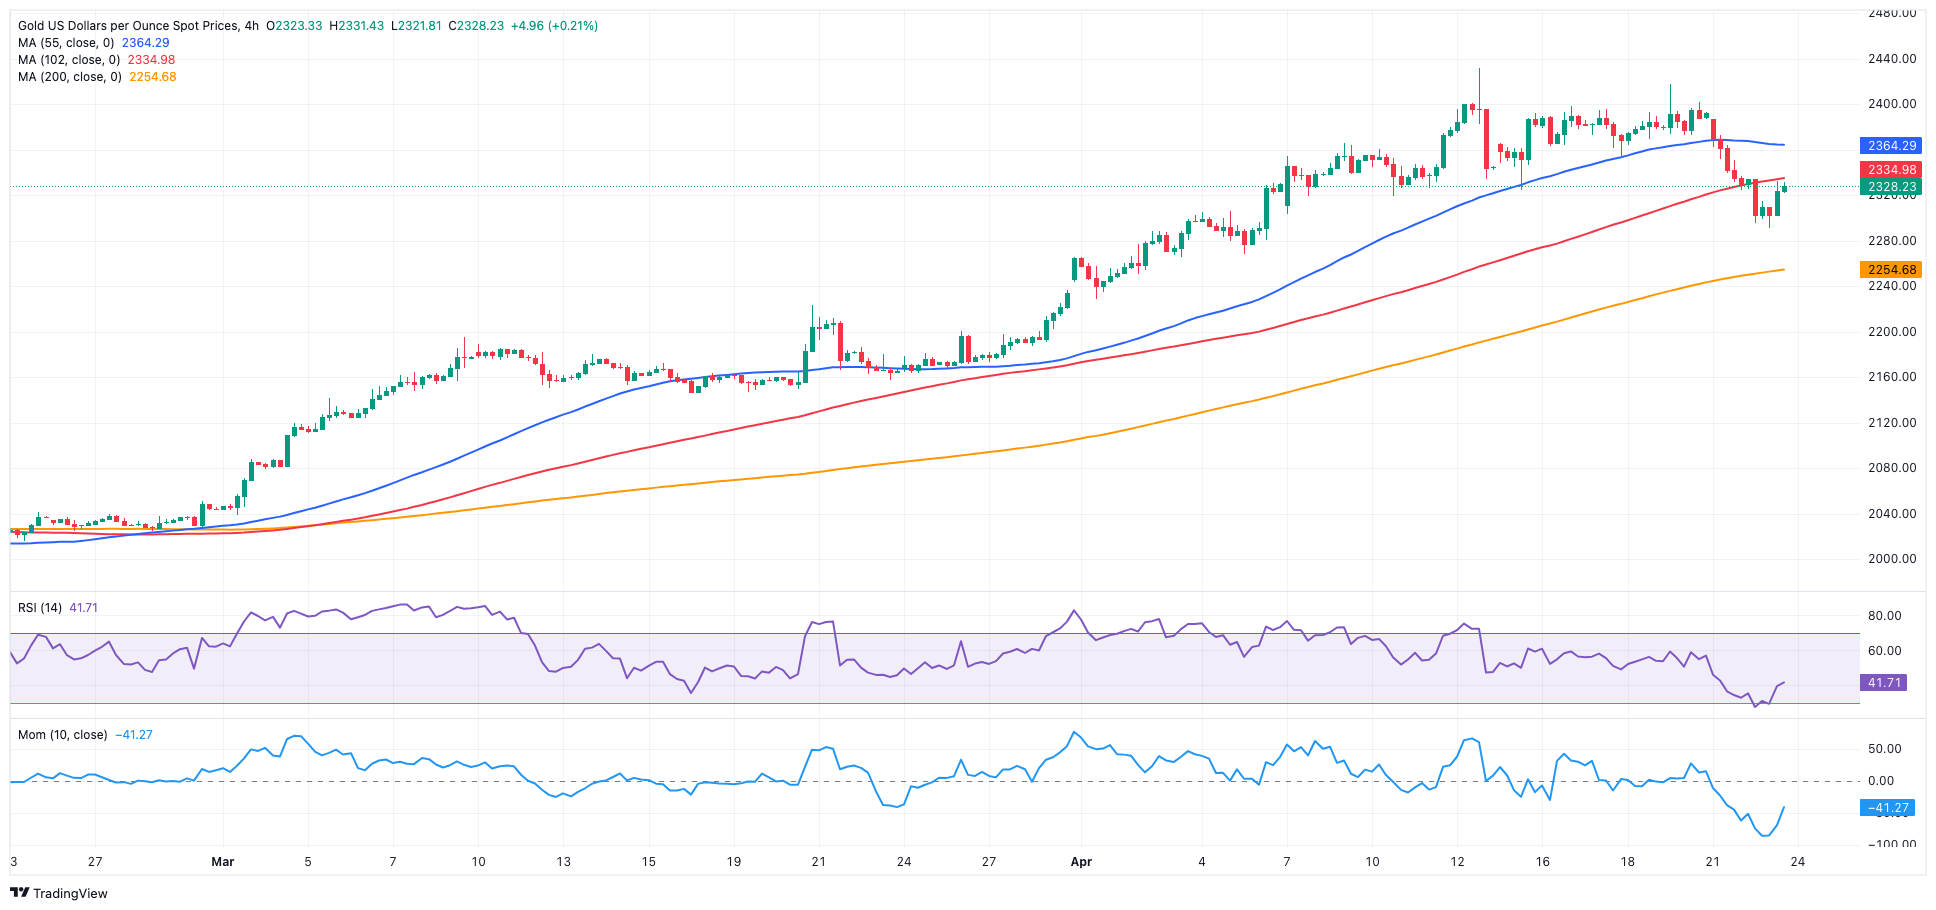
Gold prices managed to reverse the earlier drop to three-week lows in the sub-$2,300 region per troy ounce on Tuesday, reversing Monday’s strong decline despite diminishing geopolitical concerns and subdued demand for the safe haven universe.
Meanwhile, two pivotal aspects of gold demand—central bank purchases and physical demand in China, the top consumer—remain robust, offering ongoing support to the precious metal.
Moving forward, the next focus of attention for the yellow metal will be the release of US inflation numbers tracked by the PCE on Friday, as expectations remain for a Fed rate cut in September.
Gold continues to face immediate resistance at its all-time high of $2,431 (April 12). On the contrary, there is brief contention at the 55-day SMA of $2,171, which is followed by the weekly low of $2,146 (March 18). The breach of the latter indicates a possible decline to the interim 100-day SMA of $2,109, ahead of the more important 200-day SMA of $2,023. The 2024 low is $1,984 (February 14), followed by the December 2023 low of $1,973 (December 13) and the November 2023 low of $1,931 (November 10). Failure in this position could send the metal down to its October 2023 low of $1,810 (October 6), followed by the 2023 bottom of $1,804 (February 28) and the critical $1,800 conflict zone.
Resistance levels: $2,417 $2,431 (4H chart)
Support levels: $2,291 $2,267 $2,228 (4H chart)
CRUDE WTI
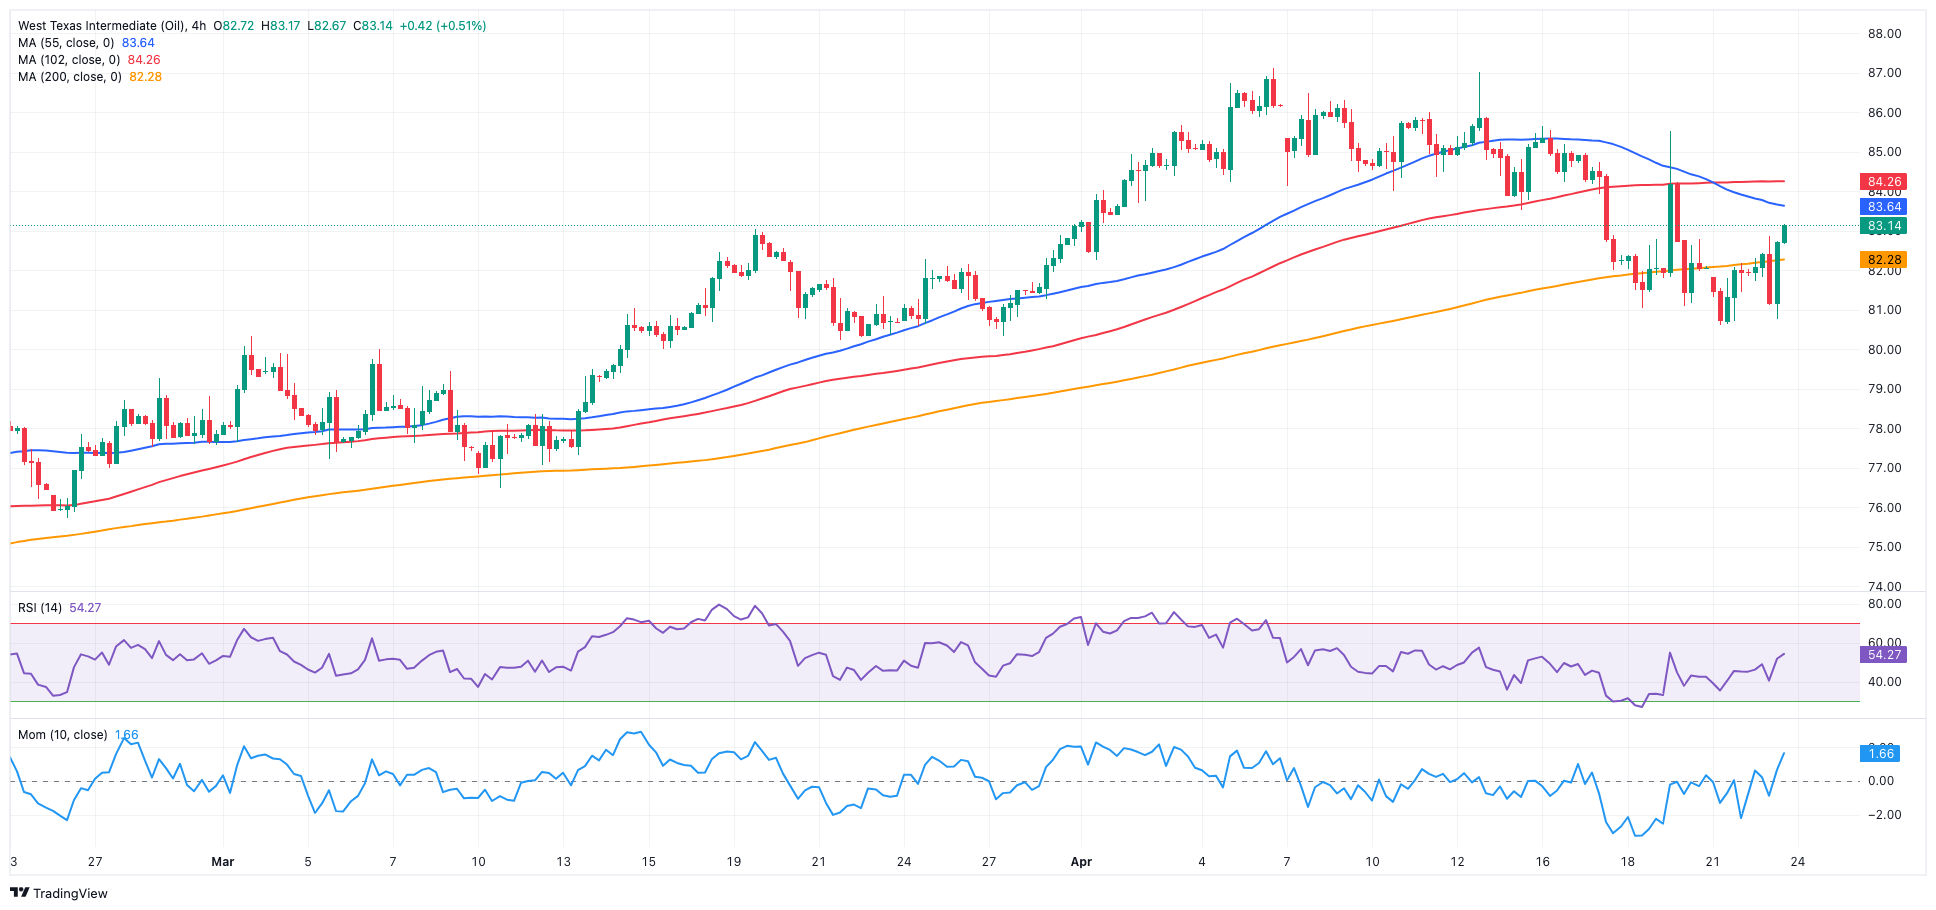
Prices of WTI extended Monday’s optimism and trespassed the key $83.00 mark per barrel on Tuesday.
Robust prints from the European manufacturing and services sectors lent support to crude oil prices along with fresh sanctions against Teheran and the renewed data-driven sell-off in the greenback, while prospects of the Fed reducing its interest rates also added to the upbeat mood in the commodity.
Later in the week, traders are expected to closely follow the EIA’s weekly report on US crude oil inventories.
In case bears regain the upper hand, the next target for WTI is the April low of $80.74 (April 22), followed by the weekly low of $80.33 (March 21) and the important 200-day SMA of $79.88. A breach in the latter might reintroduce a test of the February low of $71.43 (February 5), ahead of the important $70.00 barrier and the 2024 bottom of $69.31 (January 3). Extra losses from here indicate a decline to the December 2023 low of $67.74 (December 13). On the contrary, the immediate upward barrier is the 2024 peak of $87.60 (April 12), which comes before the weekly high of $89.83 (October 18, 2023) and the 2023 top of $94.99 (September 28, 2023).
Resistance levels: $85.58 $86.14 $87.60 (4H chart)
Support levels: $80.68 $80.51 $76.76 (4H chart)
GER40
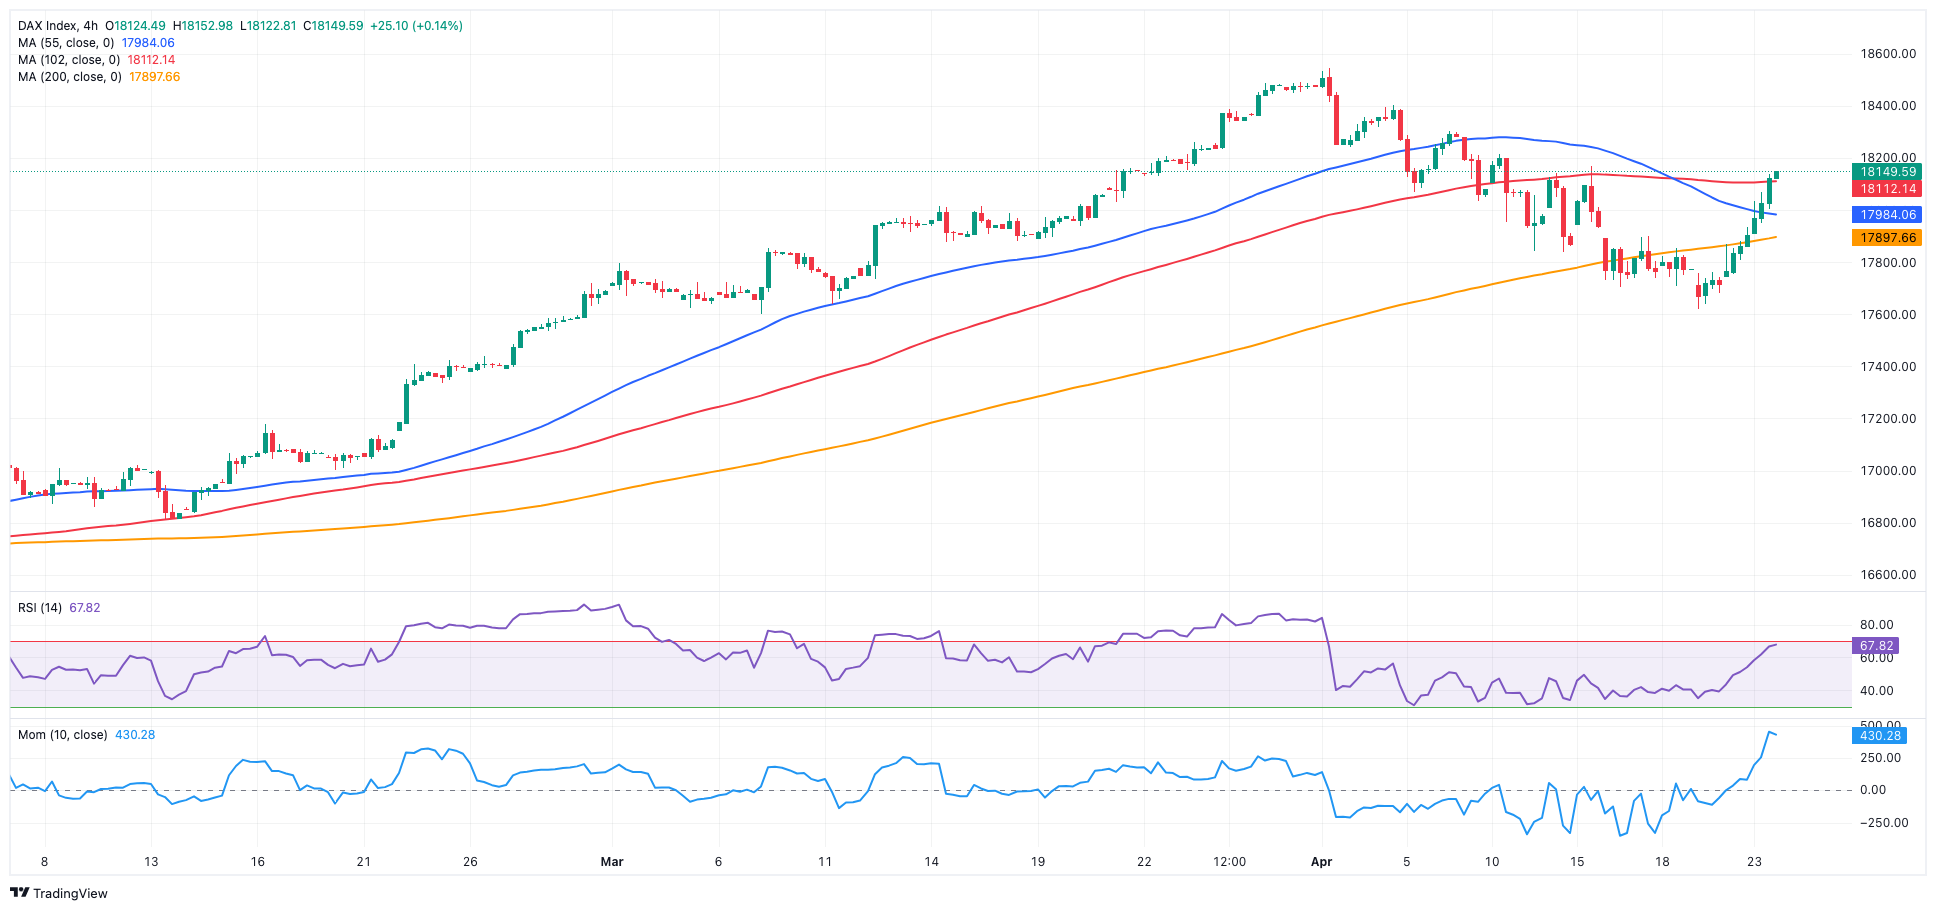
European stocks navigated a “sea of green” on Tuesday, with the German benchmark DAX40 advancing to fresh multi-day highs further north of the 18,000 mark.
The recovery in the DAX40 coincided with a reduction in geopolitical tensions and an overall improvement in risk sentiment. Additionally, strong readings from advanced PMIs in Germany and the broader euro area bolstered trader confidence.
Furthermore, the prospect of the ECB potentially lowering interest rates at its June meeting contributed to widespread optimism among market participants.
In the same line, 10-year bund yields faded Monday’s small downtick and advanced past 2.50% on Tuesday.
The continuation of the rebound in the DAX40 should retarget the record high of 18,567 (April 2). Just the opposite, there is immediate support at the April low of 17,626 (April 19), prior to the March low of 17,619 (March 7). Once sellers clear the latter, a challenge of the February low of 16,821 (February 1) becomes possible, followed by the critical 200-day SMA of 16,437 and the 2024 low of 16,345 (January 17). After falling below this level, the weekly low of 15,915 (November 28) might be revisited, followed by the October low of 14,630 (October 23) and the 2023 bottom of 14,458 (March 20). On the daily chart, the RSI rose above 56.
Best Performers: Sartorius AG VZO, SAP, Merck
Worst Performers: Henkel VZO, Symrise AG, RWE AG ST
Resistance levels: 18,191 18,427 18,567 (4H chart)
Support levels: 17,626 17,565 16,831 (4H chart)
GBPJPY
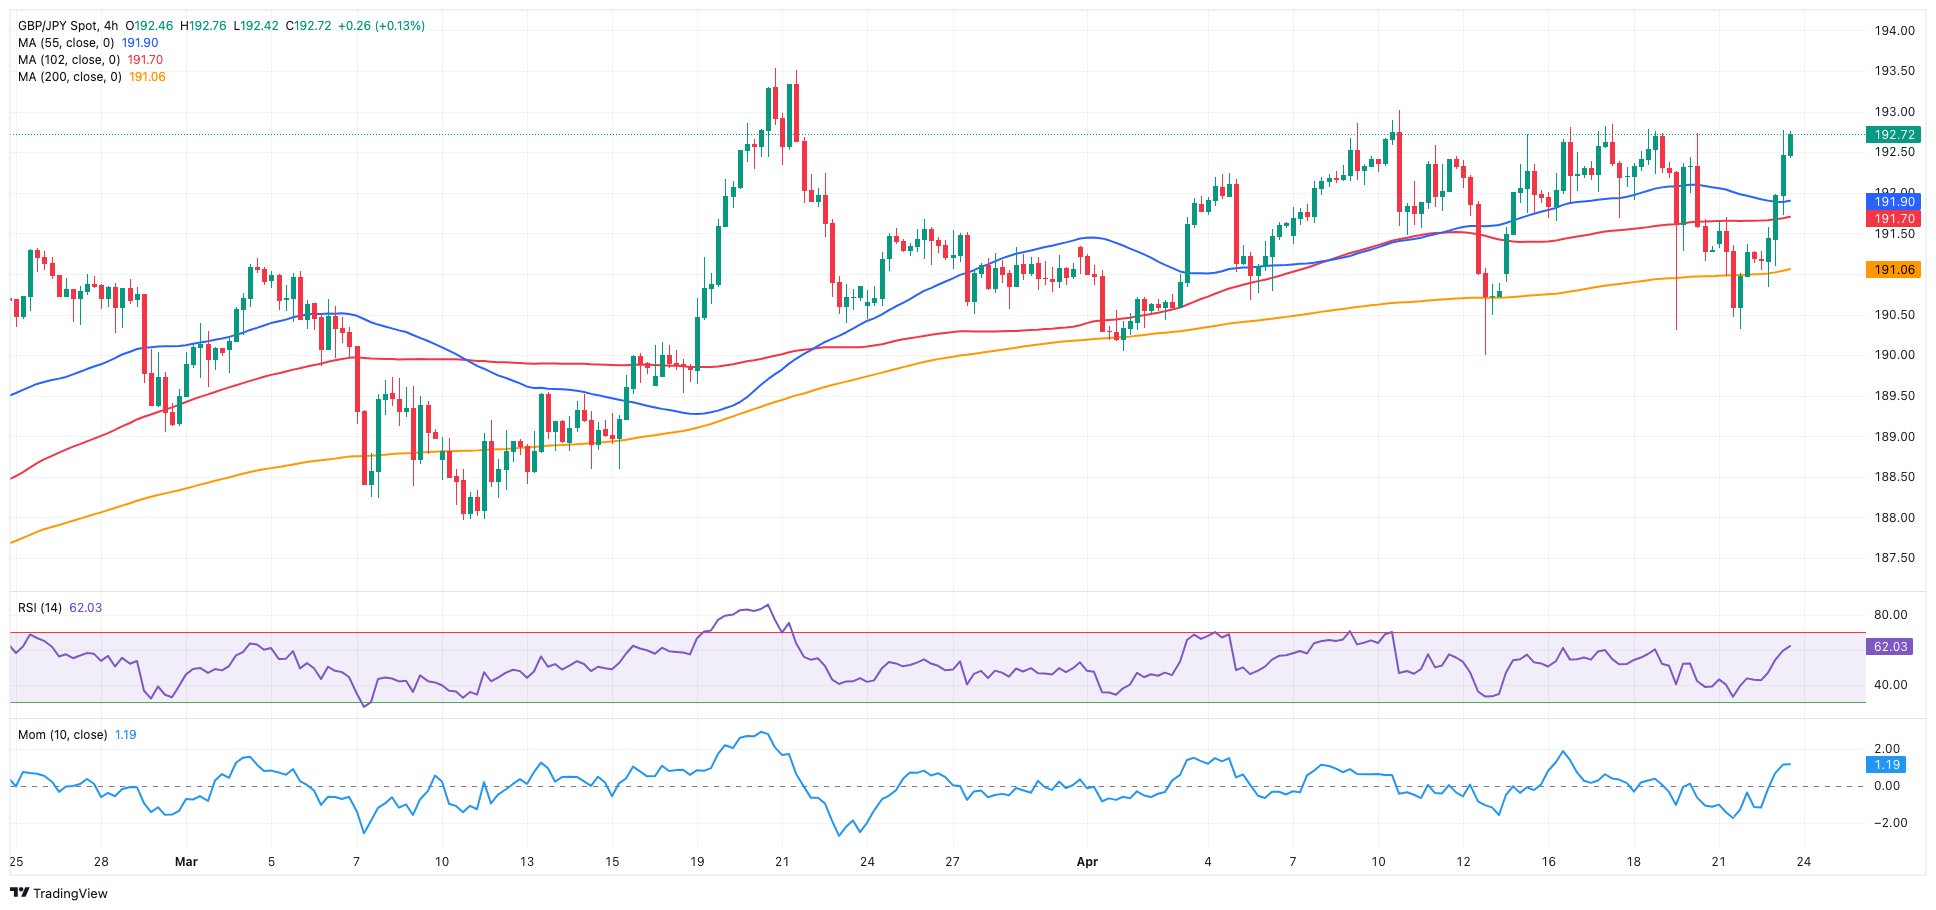
The robust bounce in the British pound helped GBP/JPY climb to the area of monthly highs around 192.70 on Tuesday.
Indeed, the bullish move in sterling came on the back of renewed sentiment in the risk complex and the sharp sell-off in the greenback, especially after US preliminary PMIs fell short of expectations in April.
Around the Japanese currency, the spectre of FX intervention by the MoF kept hovering around investors after the yen depreciated to a new 34-year low vs. the US dollar at levels just shy of the 155.00 yardstick.
If GBP/JPY leaves behind the April top of 192.97 97 (April 10), it could then dispute the 2024 peak of 193.53 (March 20). The breakout of this level might lead to a test of the August 2015 high of 195.28 (August 18), followed by the record top of 195.88 (June 24, 2015). On the flip side, the breach of the April low of 189.99 (April 12) might prompt GBP/JPY to test the March low of 187.96 (March 11), prior to the intermediate 100-day SMA of 187.73. The 200-day SMA of 185.68 comes next before the February low of 185.22 (February 1) and the December 2023 low of 178.33 (December 14). The daily RSI improved to around 58.
Resistance levels: 192.81 192.97 193.53 (4H chart)
Support levels: 190.30 189.99 189.54 (4H chart)
NASDAQ
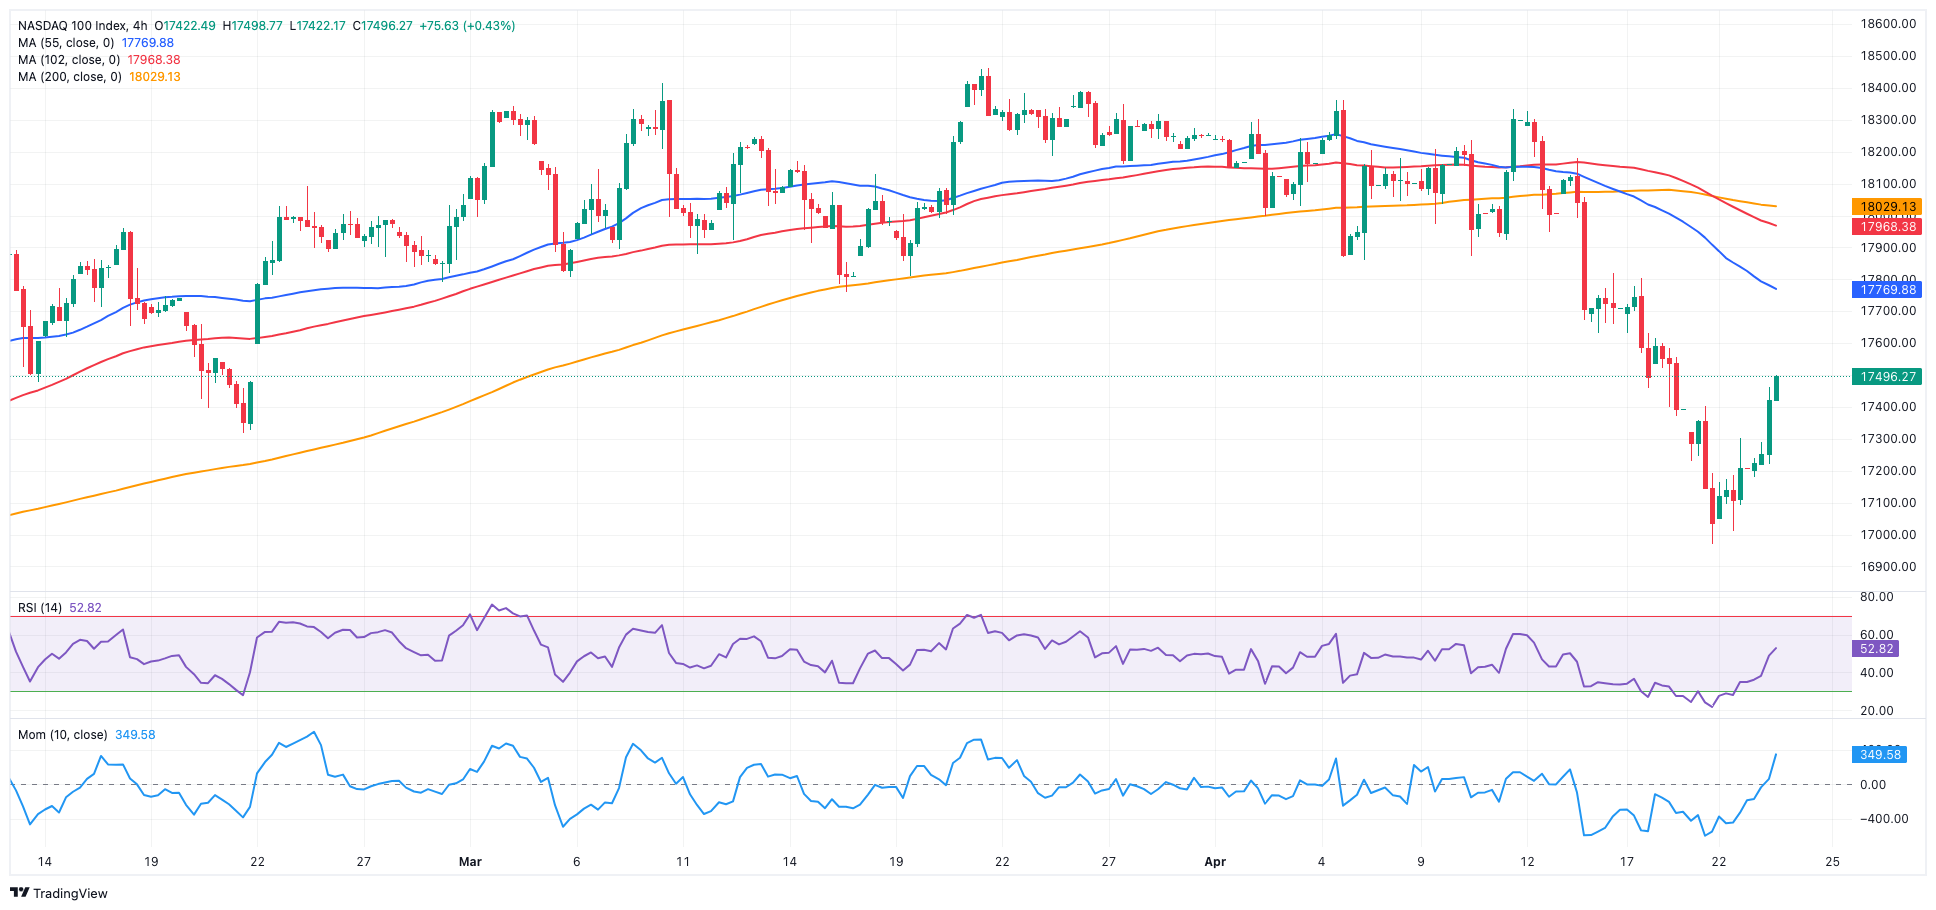
Following suit with other US counterparts, the Nasdaq 100, a benchmark for the technology sector, added to Monday’s gains and advanced to three-day highs near 17,500 on Tuesday.
Tech firms navigated in quite a favourable context, which was underpinned by extra weakness in the dollar, declining US yields, and diminishing geopolitical jitters, all propping up the better tone in the risk appetite.
In addition, major technology companies are slated to announce their quarterly results this week, with electric vehicle maker Tesla initiating the cycle after the markets close on Tuesday.
Extra gains are expected to target the provisional 55-day SMA of 17,931 before the all-time top of 18,464 (March 21). Conversely, the April low of 16,973 (April 19) is expected to offer initial contention prior to the key 200-day SMA of 16,289 and the 2024 bottom of 16,249 (January 5). Further losses may put the December 2023 low of 15,695 (December 4) to the test ahead of the October 2023 low of 14,058 (October 26), and the April 2023 low of 12,724 (April 25), all before the March 2023 low of 11,695 (March 13). The daily RSI rebounded past the 42 level.
Top Gainers: MongoDB, The Trade Desk, Datadog
Top Losers: PepsiCo, Cadence Design, Starbucks
Resistance levels: 17,979 18,337 18,464 (4H chart)
Support levels: 16,973 16,249 15,695 (4H chart)
DOW JONES
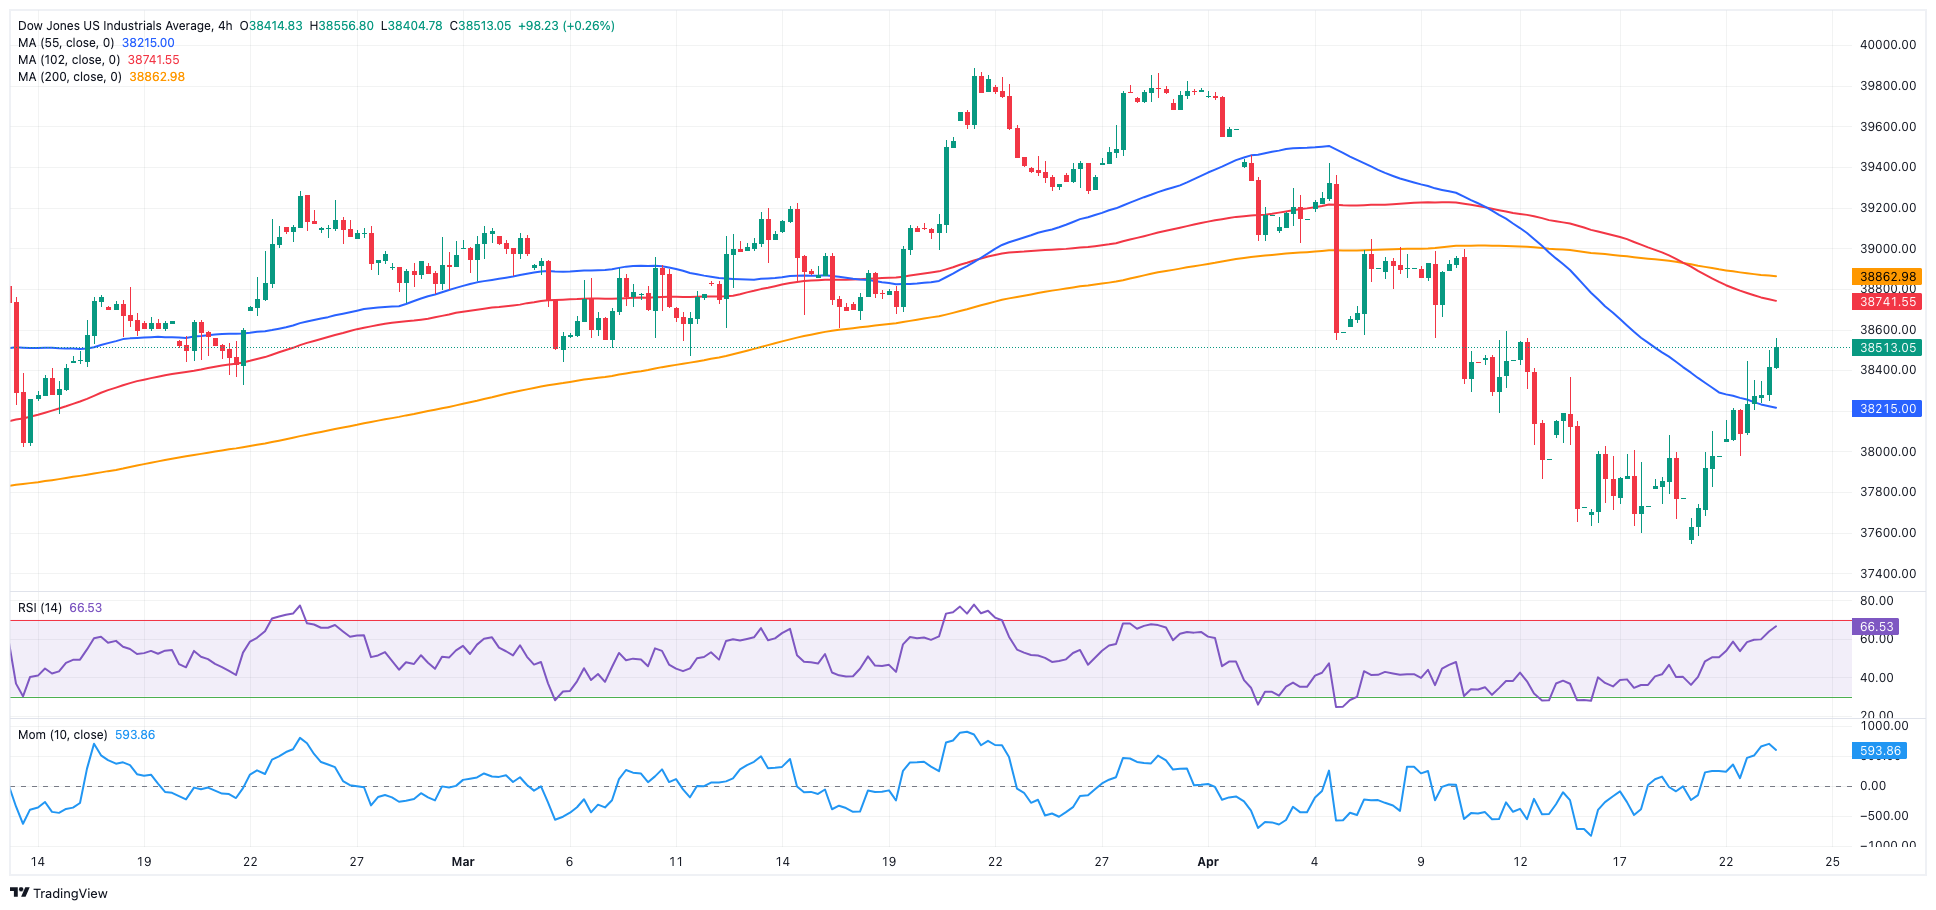
On Tuesday, the primary indices of Wall Street surged, buoyed by gains in growth and chip sectors ahead of quarterly reports from major technology firms.
That said, the reference Dow Jones extended its bullish performance for the fourth session in a row, reaching the 38,500 region, the highest level in several days.
Investors’ expectations ahead of the release of corporate earnings reports and the dominating context favouring risk-associated assets also collaborated with the daily uptick in the index.
On Tuesday, the Dow Jones rose 0.77% to 38,533, the S&P 500 gained 1.28% to 5,074, and the tech-centric Nasdaq Composite advanced 1.52% to 15,686.
If the Dow Jones maintains its recovery, it could revisit the temporary 55-day SMA of 38,785 ahead of the record high of 39,889 (March 21). Having said that, the immediate contention emerges at the April low of 37,611 (April 17), prior to the 2024 bottom of 37,122 (January 18), and the key 200-day SMA of 36,260. The weekly low of 33,859 (November 7, 2023) is next, followed by the October 2023 low of 32,327 (October 27), all before the 2023 bottom of 31,429 (March 15). The everyday RSI rose to the vicinity of the 50 threshold.
Top Performers: Verizon, American Express, Walt Disney
Worst Performers: Walmart, Boeing, UnitedHealth
Resistance levels: 38,805 39,421 39,889 (4H chart)
Support levels: 37,611 37,122 36,010 (4H chart)
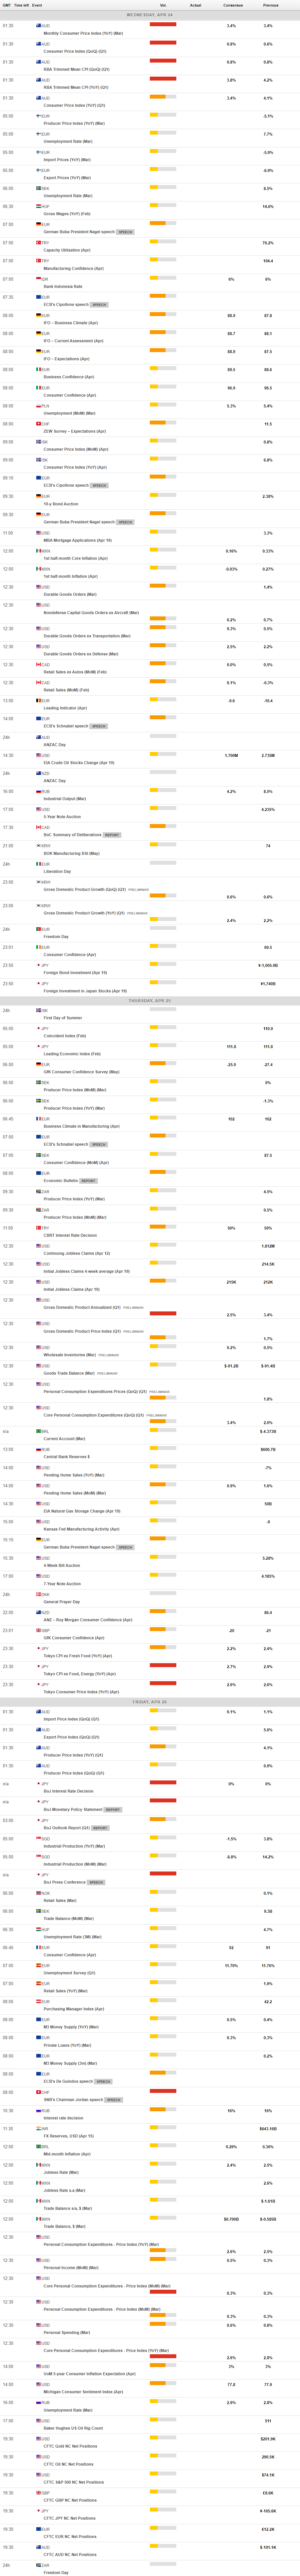
MACROECONOMIC EVENTS
All Information & Updates provided by:

All information relating to the financial markets available on this page has been prepared and issued by FXStreet (Forexstreet SL, Spain, Reg: B62498233) on the basis of publicly available information and all information believed to be reliable and does not conflict with Kuwaiti local laws, and all necessary care has been taken to before the company to ensure that the facts mentioned are correct from the source.
NCM Investment nor any of its directors or employees shall in any way be held responsible for the contents of this news, and the information contained on this page is intended only to provide clients with publicly available information and should not be construed as investment advice, report or analysis and/or constitute an offer or invitation to buy or sell financial instruments of any kind.
RISK WARNING: Forex and CFDs are highly risky leveraged products, as losses can exceed deposits. Please ensure you understand all the risks and take independent advice if necessary. NCM will segregate the clients based on the criteria of the regulator and its bylaws. NCM does not provide any advisory service; the material published does not constitute advice or a recommendation for a transaction in any financial instrument. NCM accepts no responsibility for any use of the content presented and any consequences of that use. Anyone acting on the information provided does so at their own risk.