Daily Market Updates
25 Apr 2024
EURUSD
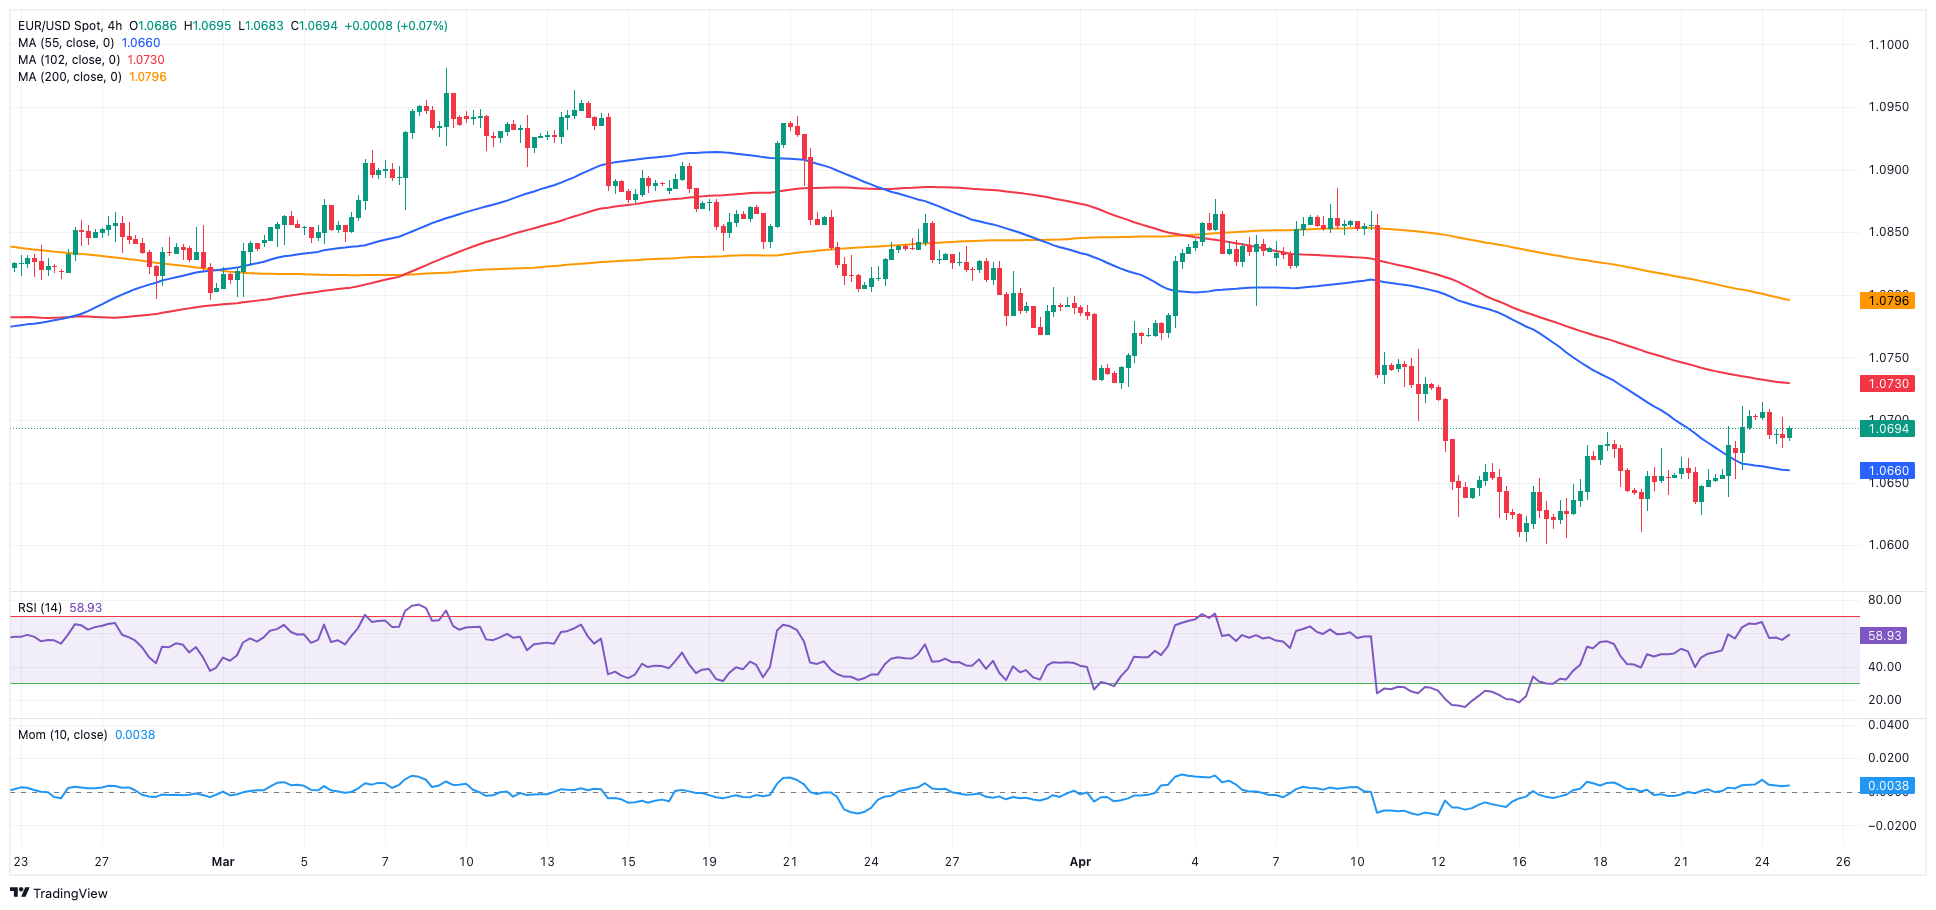
A tepid recovery in the greenback reignited an equally mild selling pressure in EUR/USD, prompting it to revisit the sub-1.0700 region on Wednesday.
In fact, the USD Index (DXY) managed to regain some balance following Tuesday’s data-driven sharp pullback, always underpinned by the corrective uptick in US yields across the curve.
Examining the macro landscape, the focal point in the FX space continues to be the policy disparity between the Fed and the ECB. Presently, investors are tilting towards anticipating a Fed interest rate reduction in September, while the ECB is anticipated to commence its easing trajectory at some point during the summer.
On the latter, Board member J. Nagel favoured an interest rate cut in June if inflation continues to trend lower towards the bank’s target.
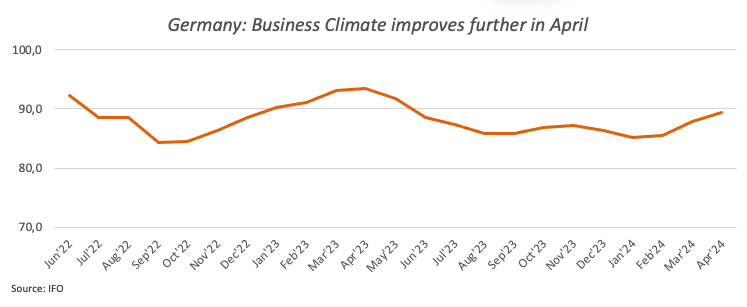
Data-wise, in the euro bloc, Business Climate in Germany improved to 89.4 in April. In the US, Durable Goods Orders expanded more than expected by 2.6% in March vs. the previous month.
Extra gains in EUR/USD might initially hit the significant 200-day SMA of 1.0809, before the weekly high of 1.0885 (April 9) and the March top of 1.0981 (March 8). Up from here comes a weekly peak of 1.0998 (January 5, 2011), just ahead of the key 1.1000 yardstick. The breakout of this zone may put pressure on the December 2023 high of 1.1139 (December 27), which is still supported by the 200-week SMA of 1.1138 and takes place before the 2023 top of 1.1275 (July 18). In the opposite direction, further weakness could open the door to a probable visit to the 2024 low of 1.0601 (April 16). A deeper drop might reveal a weekly low of 1.0495 (October 13, 2023), ahead of the 2023 low of 1.0448 (October 3) and the round milestone of 1.0400. The day-to-day RSI receded to around 42.
Resistance levels: 1.0714 1.0756 1.0795 (4H chart)
Support levels: 1.0658 1.0601 1.0516 (4H chart)
USDJPY
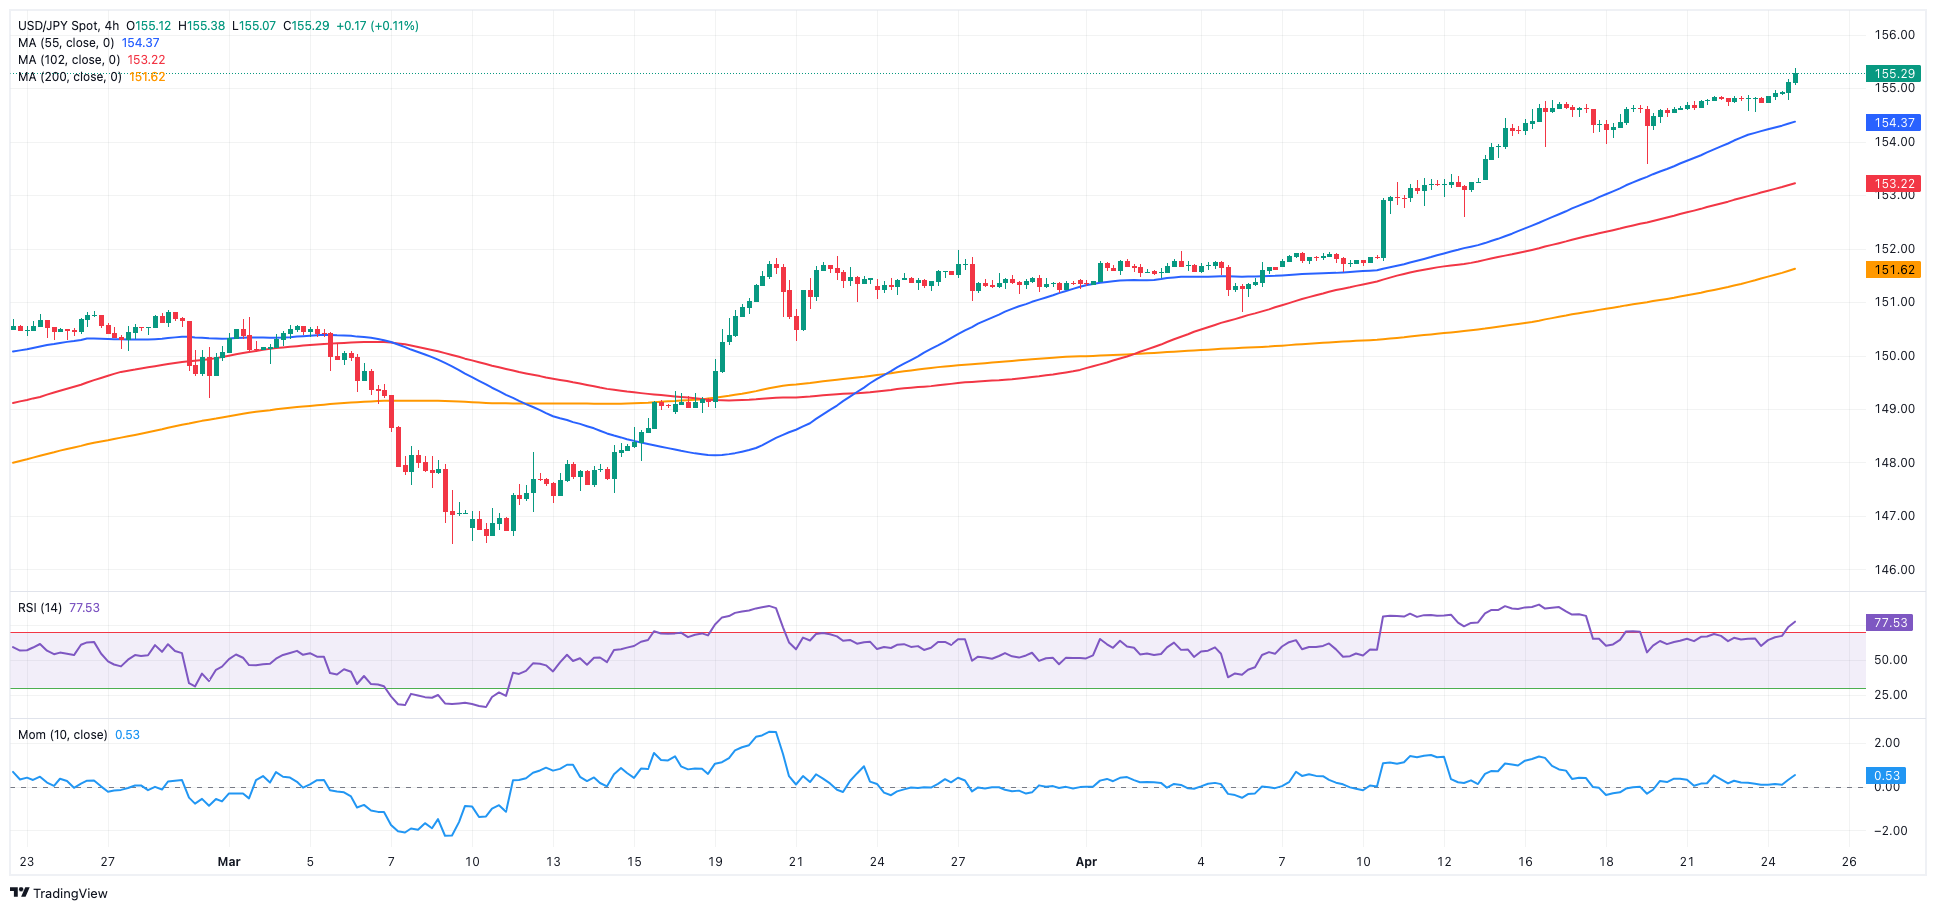
USD/JPY kept its bullish bias intact and advanced to new highs beyond the 155.00 barrier for the first time since late June 1990 on Wednesday.
The uptick in spot came on the back of the resurgence of a mild upward bias in the dollar, a move that was further propped up by the rebound in US yields across different timeframes.
In the Japanese money market, JGB 10-year yields rose to the boundaries of 0.90%, while FX intervention concerns remained well on the rise as spot surpassed the 155.00 level.
Adding to the dollar’s retracement, US yields dropped accordingly across the curve, while JGB 10-year yields also eased a tad and faded Monday’s decent advance.
Moving forward, market participants widely anticipate the BoJ to maintain its rates during its upcoming event later in the week. On this, Governor Ueda noted on Tuesday that sustaining accommodative monetary conditions was appropriate given that underlying inflation remains below 2%. However, he warned that if price trends align with expectations and approach the 2% mark, it would require an elevation in short-term interest rates.
The next upward hurdle for USD/JPY is the 2024 high of 155.17 (April 24), which is before to the June 1990 high of 155.80. Just the opposite, the pair is projected to find initial support at the preliminary 55-day SMA at 151.03 prior to the April low of 150.80 (April 5). The loss of this region discloses the interim 100-day SMA at 148.42 ahead of the critical 200-day SMA at 147.86, all before the March low of 146.47 (March 8). A collapse of this zone might lead to a return to the February low of 145.89 (February 1), which is before the December 2023 low of 140.24 (December 28), the round number 140.00, and the July 2023 bottom of 137.23 (July 14). The daily RSI increased above 78, indicating an extremely overbought condition.
Resistance levels: 155.37 155.80 155.88 (4H chart)
Support levels: 153.58 152.58 151.56 (4H chart)
GBPUSD
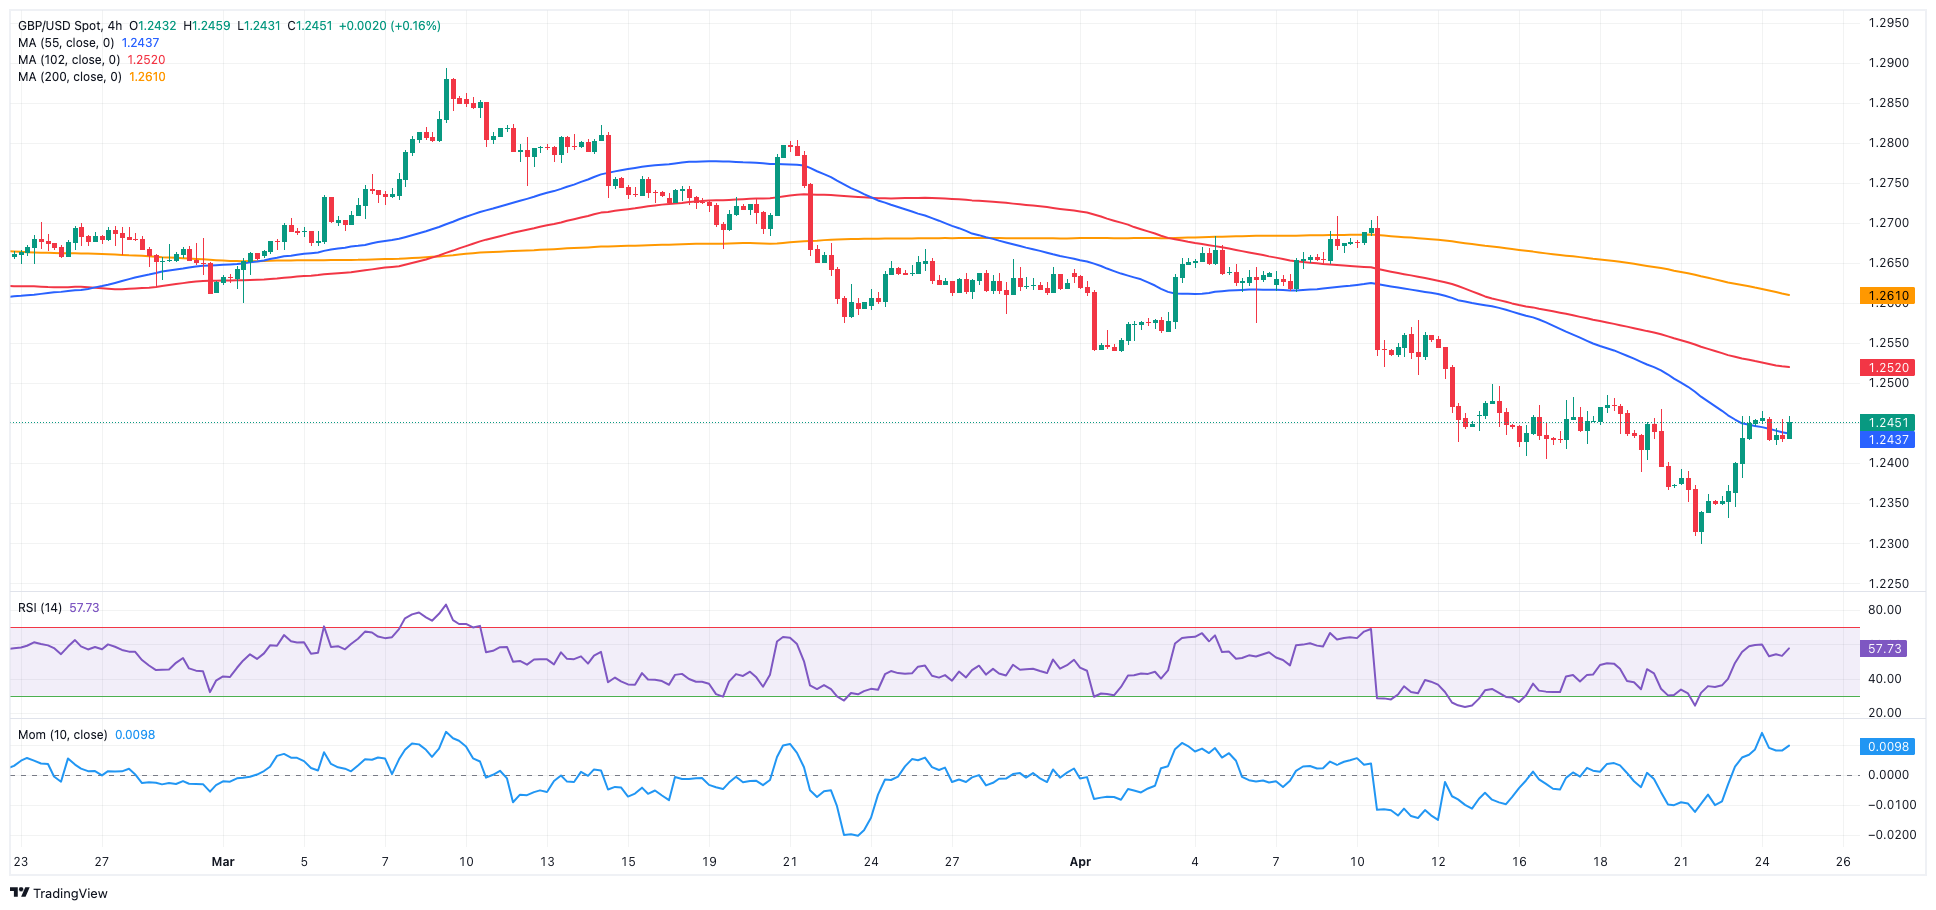
The British pound came under pressure soon after lifting GBP/USD to fresh three-day highs near 1.2470 on Wednesday.
Indeed, Cable’s recovery ran out of steam and succumbed to the decent bounce in the greenback amidst a mixed tone in the risk-linked universe and the unchanged macro environment surrounding major central banks.
Speaking about the BoE, UK interest rate swaps indicated that the first 25 bps rate cut is fully priced in for August 2024 and pencilled in two rate cuts before year-end.
It is worth noting that the BoE's H. Pill delivered a cautious tone on Monday after arguing that an interest rate cut is still some way off.
In the UK, the CBI Industrial Trends Orders worsened to -23 in April.
The key 200-day SMA of 1.2561 is the first upward hurdle for GBP/USD, followed by the April top of 1.2709 (April 9), the weekly peak of 1.2803 (March 21), and the 2024 high of 1.2893 (March 8). North of here emerges the weekly top of 1.2995 (July 27, 2023), barely over the psychological 1.3000 threshold. On the flip side, the 2024 bottom of 1.2299 (April 22) comes first, seconded by the weekly low of 1.2187 (November 10, 2023), which precedes the October 2023 low of 1.2037 and the major 1.2000 conflict zone. On the daily chart, the RSI receded to the 41 region.
Resistance levels: 1.2464 1.2498 1.2578 (4H chart)
Support levels: 1.2299 1.2187 1.2069 (4H chart)
GOLD
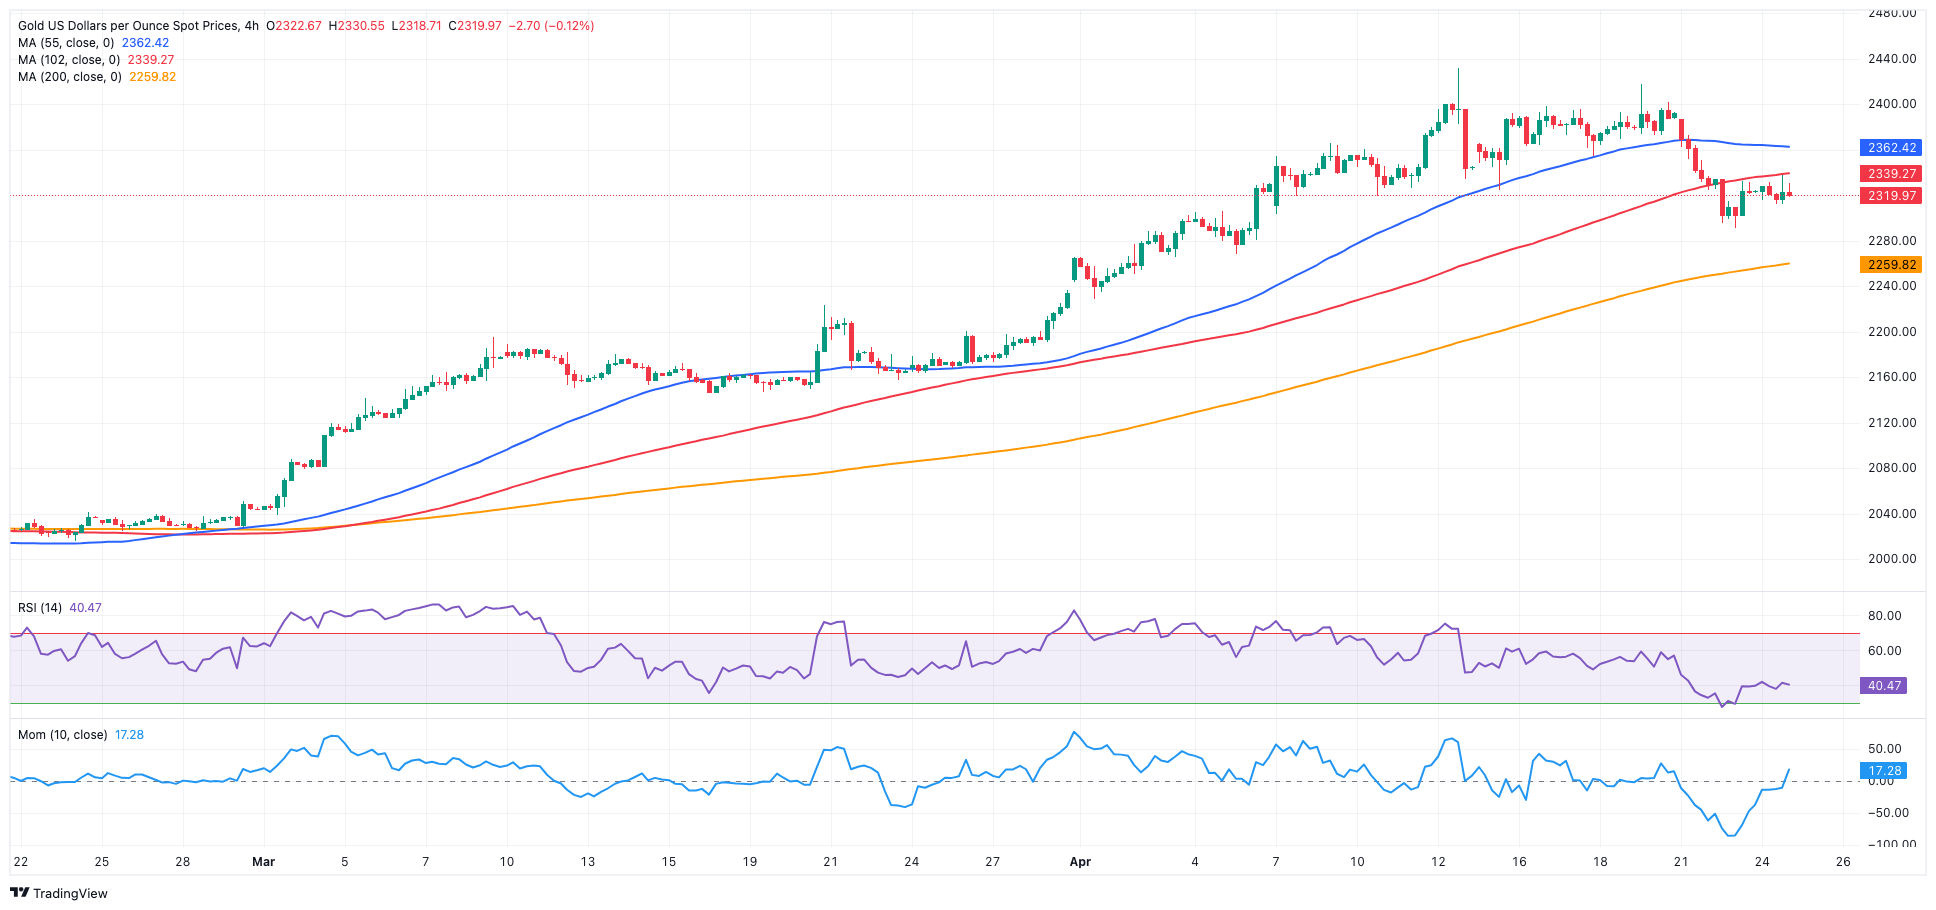
Prices of the yellow metal advanced modestly on Wednesday, reclaiming the area above the $2,300 mark per troy ounce and setting aside two daily pullbacks in a row.
The daily uptick in bullion came despite the decent bullish move in the greenback and the recovery in US yields across various maturities as investors’ attention shifted to the publication of US Q1 GDP figures and inflation tracked by the PCE, both events due in the latter part of the week.
In the meantime, two crucial elements of gold demand—central bank acquisitions and physical demand in China—continued to demonstrate strength, providing continual backing to the precious metal.
Gold continues to find immediate resistance above its all-time high of $2,431 (April 12). On the contrary, there is temporary resistance at the 55-day SMA of $2,171, which is followed by the weekly low of $2,146 (March 18). The breach of the latter signals a likely slide to the intermediate 100-day SMA of $2,109, which is higher than the more critical 200-day SMA of $2,023. The low for 2024 is $1,984 (February 14), followed by $1,973 (December 13) and $1,931 (November 10). Failure in this position may drive the metal to its October 2023 low of $1,810 (October 6), followed by the 2023 low of $1,804 (February 28) and the important $1,800 conflict zone.
Resistance levels: $2,362 $2,417 $2,431 (4H chart)
Support levels: $2,291 $2,267 $2,228 (4H chart)
CRUDE WTI
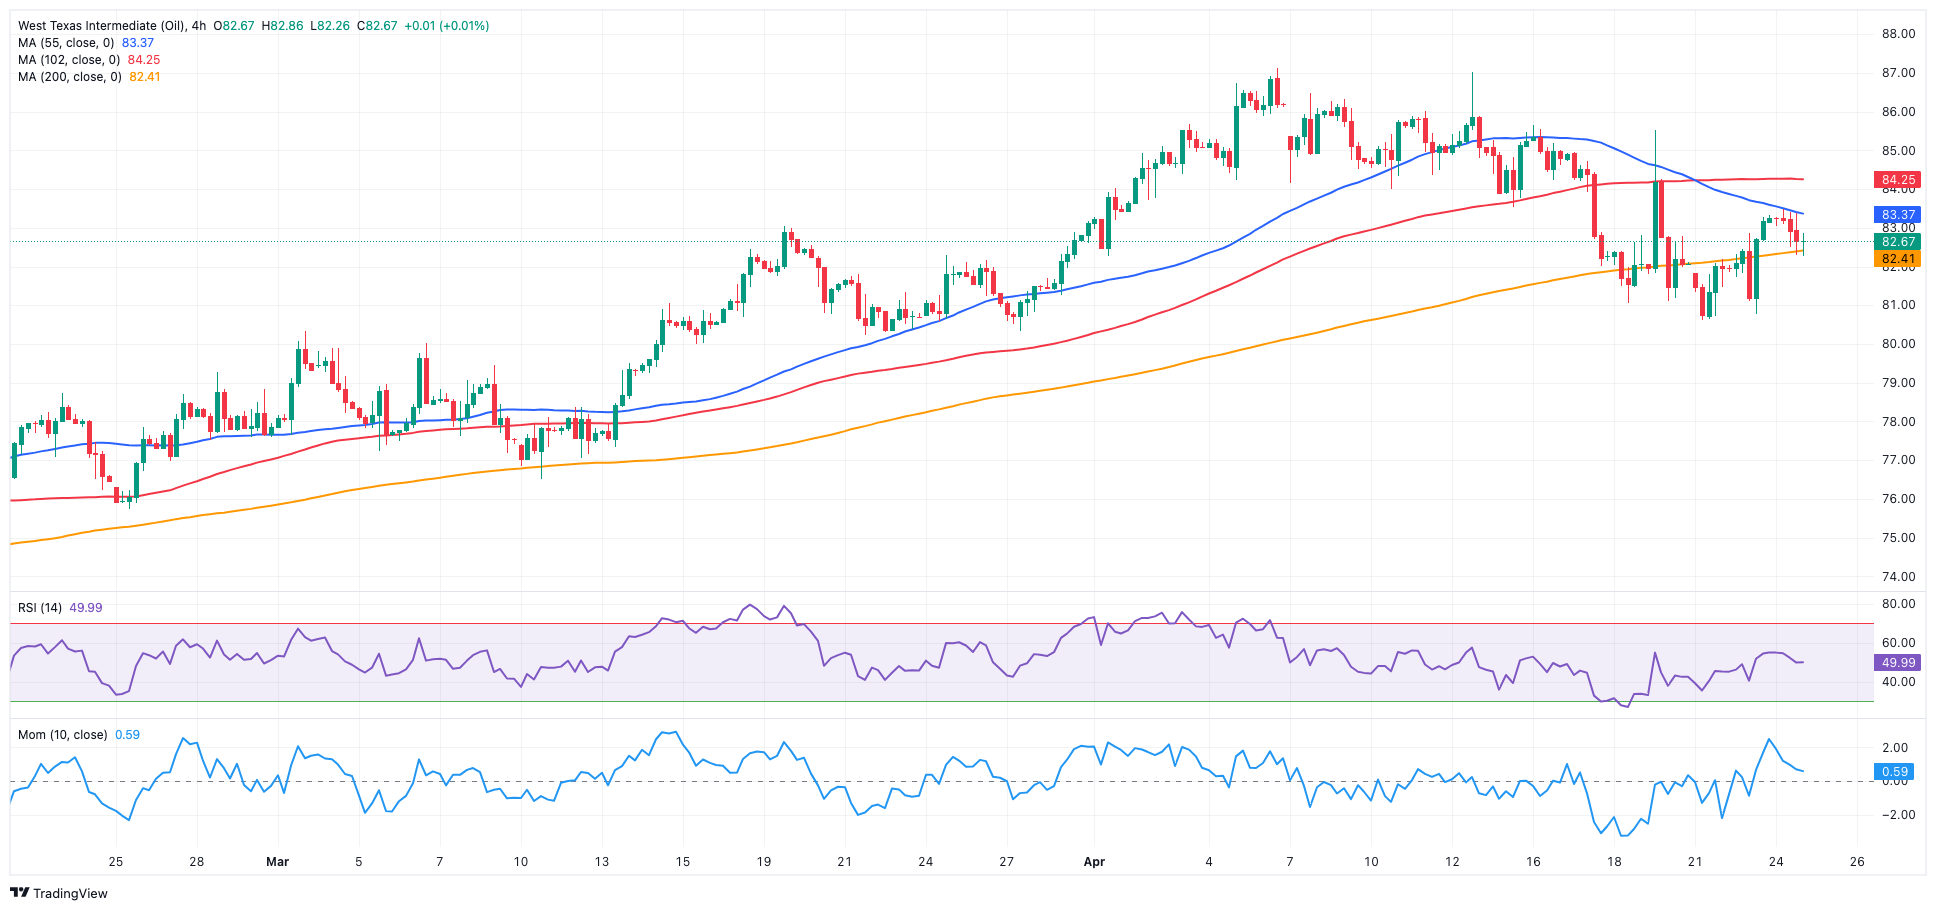
WTI prices halted their weekly recovery and returned to the sub-$83.00 region on Wednesday.
The corrective retracement in the commodity came in contrast to a larger-than-expected drop in US crude oil inventories, as per the EIA’s report. On this, the agency reported that US crude oil inventories shrank by 6.368M barrels in the week to April 19, while supplies at Cushing dropped by 0.659M barrels, Weekly Distillate Stocks increased by 1.614 million barrels, and gasoline stockpiles went down by 0.634M barrels.
Weighing on crude oil prices, however, remained a shrinking geopolitical risk premium, while the marked rebound in the US dollar also collaborated with the daily decline.
If bears get the upper hand, the next target for WTI is the April low of $80.74 (April 22), followed by the weekly low of $80.33 (March 21) and the critical 200-day SMA of $79.92. A breach of the latter might bring a test of the February low of $71.43 (February 5), ahead of the critical $70.00 barrier and the 2024 low of $69.31 (January 3). Extra losses from here point to a December 2023 bottom of $67.74 (December 13). On the contrary, the immediate upward barrier is the 2024 peak of $87.60 (April 12), which precedes the weekly high of $89.83 (October 18, 2023) and the 2023 peak of $94.99 (September 28, 2023).
Resistance levels: $85.58 $86.14 $87.60 (4H chart)
Support levels: $80.68 $80.51 $76.76 (4H chart)
GER40
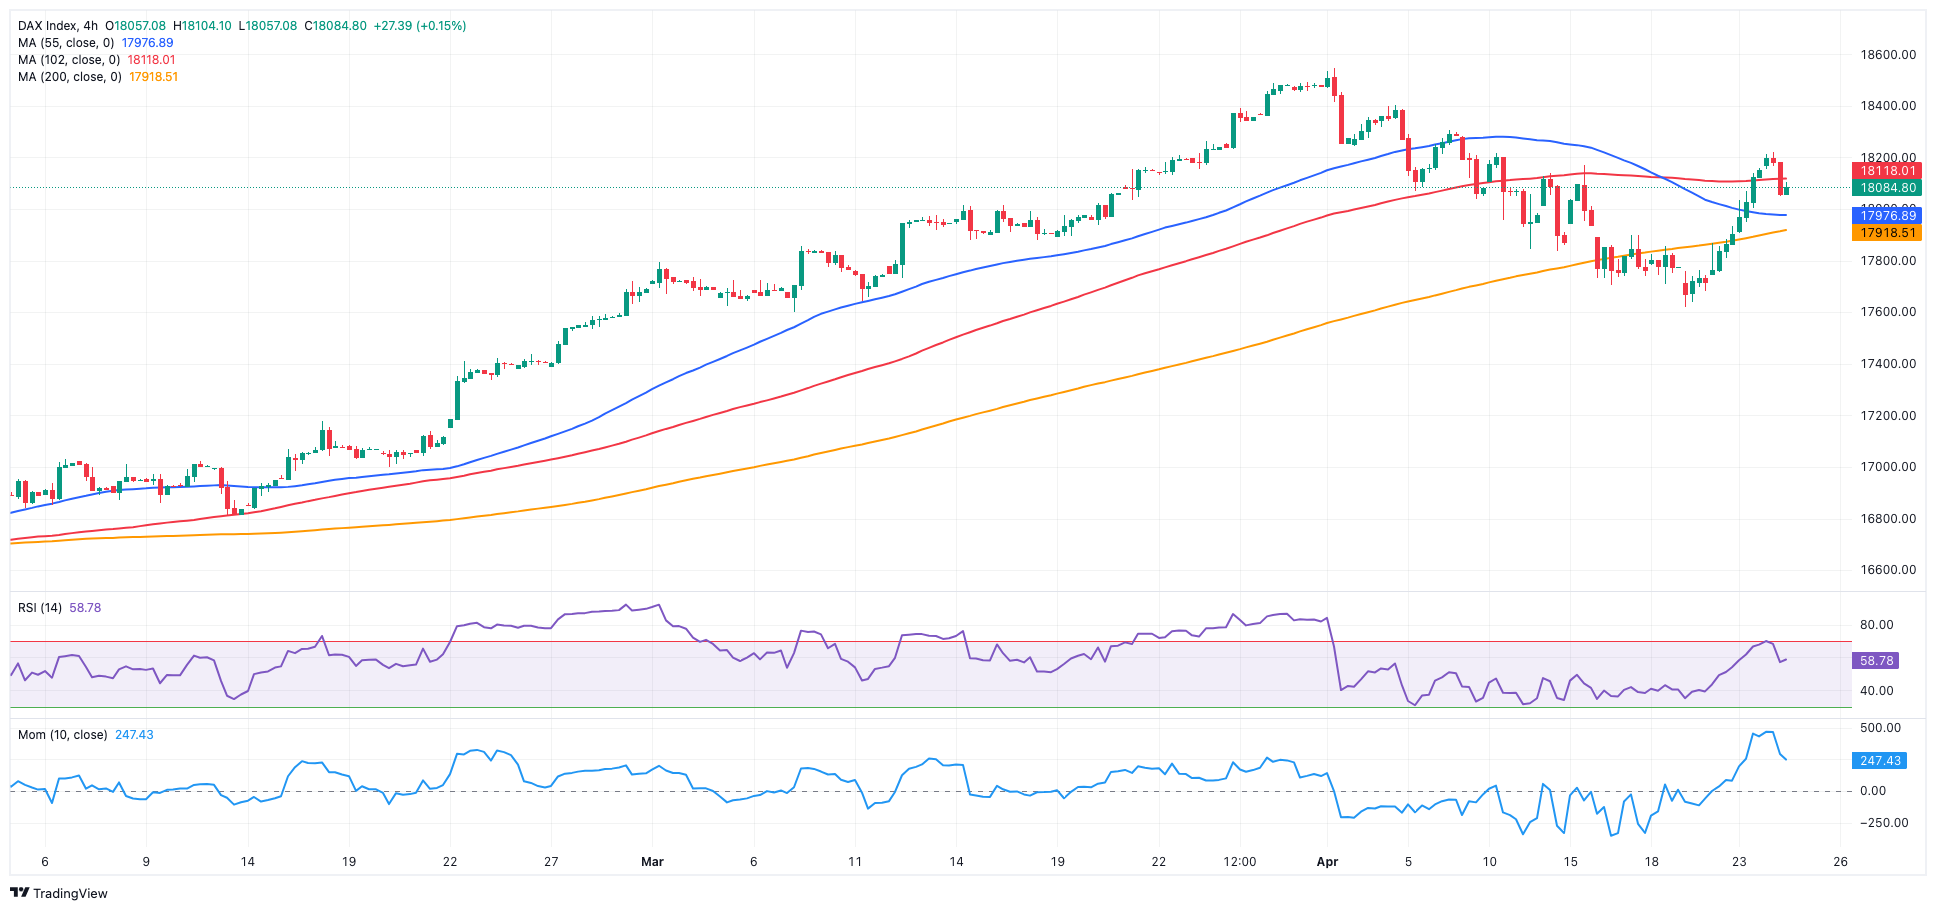
Germany’s benchmark DAX40 could not sustain the earlier move to multi-day highs and ended Wednesday’s session with modest losses near the 18,100 level.
In fact, the index reversed a two-session rebound despite easing geopolitical tensions and a generalized upbeat mood in the global markets following Tuesday’s positive session on Wall Street.
Meanwhile, investors continued to project the ECB to start lowering its interest rates at its June event.
The daily losses in the index came amidst a climb in 10-year bund yields to levels last seen in November of around 2.60%.
The continuance of the DAX40's bounce should retarget the record high of 18,567 (April 2). Just the opposite, there is immediate support at the April low of 17,626 (April 19), which precedes the March low of 17,619 (March 7). Once sellers clear the latter, a challenge to the February bottom of 16,821 (February 1) is probable, followed by the important 200-day SMA of 16,448 and the 2024 low of 16,345 (January 17). After dropping below this level, the weekly low of 15,915 (November 28) may be revisited, followed by the October low of 14,630 (October 23) and the 2023 bottom of 14,458 (March 20). On the daily chart, the RSI deflated below 55.
Best Performers: Infineon, Rheinmetall AG, Siemens Healthineers
Worst Performers: Zalando SE, Deutsche Boerse, Vonovia
Resistance levels: 18,226 18,427 18,567 (4H chart)
Support levels: 17,626 17,589 16,831 (4H chart)
GBPJPY
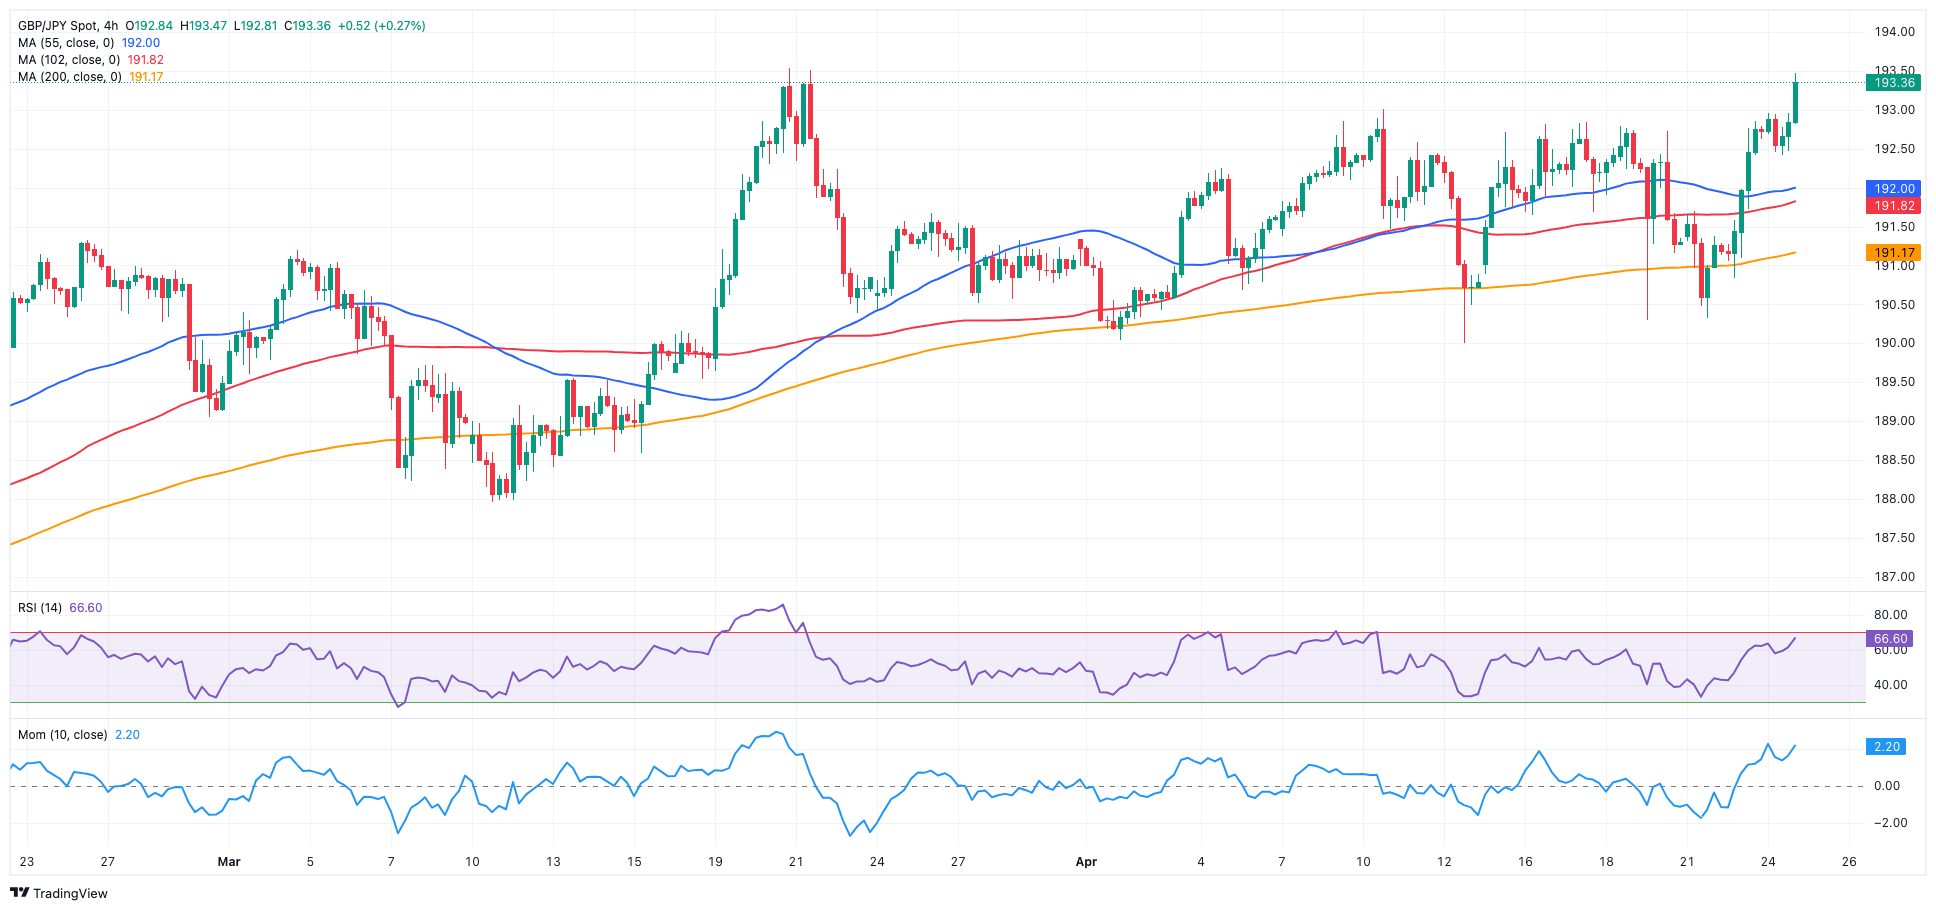
GBP/JPY extended Tuesday’s gains beyond the 193.00 hurdle on Wednesday, breaking above the broader range-bound theme in place since the beginning of the month.
Furthermore, the bullish price action in the cross came in tandem with a humble decline in sterling and persistent depreciation of the Japanese currency, which maintained investors’ concerns over potential FX intervention by the MoF unaltered.
Immediately to the upside for GBP/JPY aligns the 2024 top of 193.53 (March 20). The breakout of this level may result in a challenge of the August 2015 peak of 195.28 (August 18), followed by the record high of 195.88 (June 24, 2015). On the other hand, a breakdown of the April low of 189.99 (April 12) may cause the cross to test the March low of 187.96 (March 11), prior to the intermediate 100-day SMA of 187.80. Down from here emerges the key 200-day SMA of 185.74 ahead of the February low of 185.22 (February 1) and the December 2023 bottom of 178.33 (December 14). The RSI trespassed the 61 barrier on the daily chart.
Resistance levels: 193.46 193.53 195.28 (4H chart)
Support levels: 190.32 189.99 189.54 (4H chart)
NASDAQ
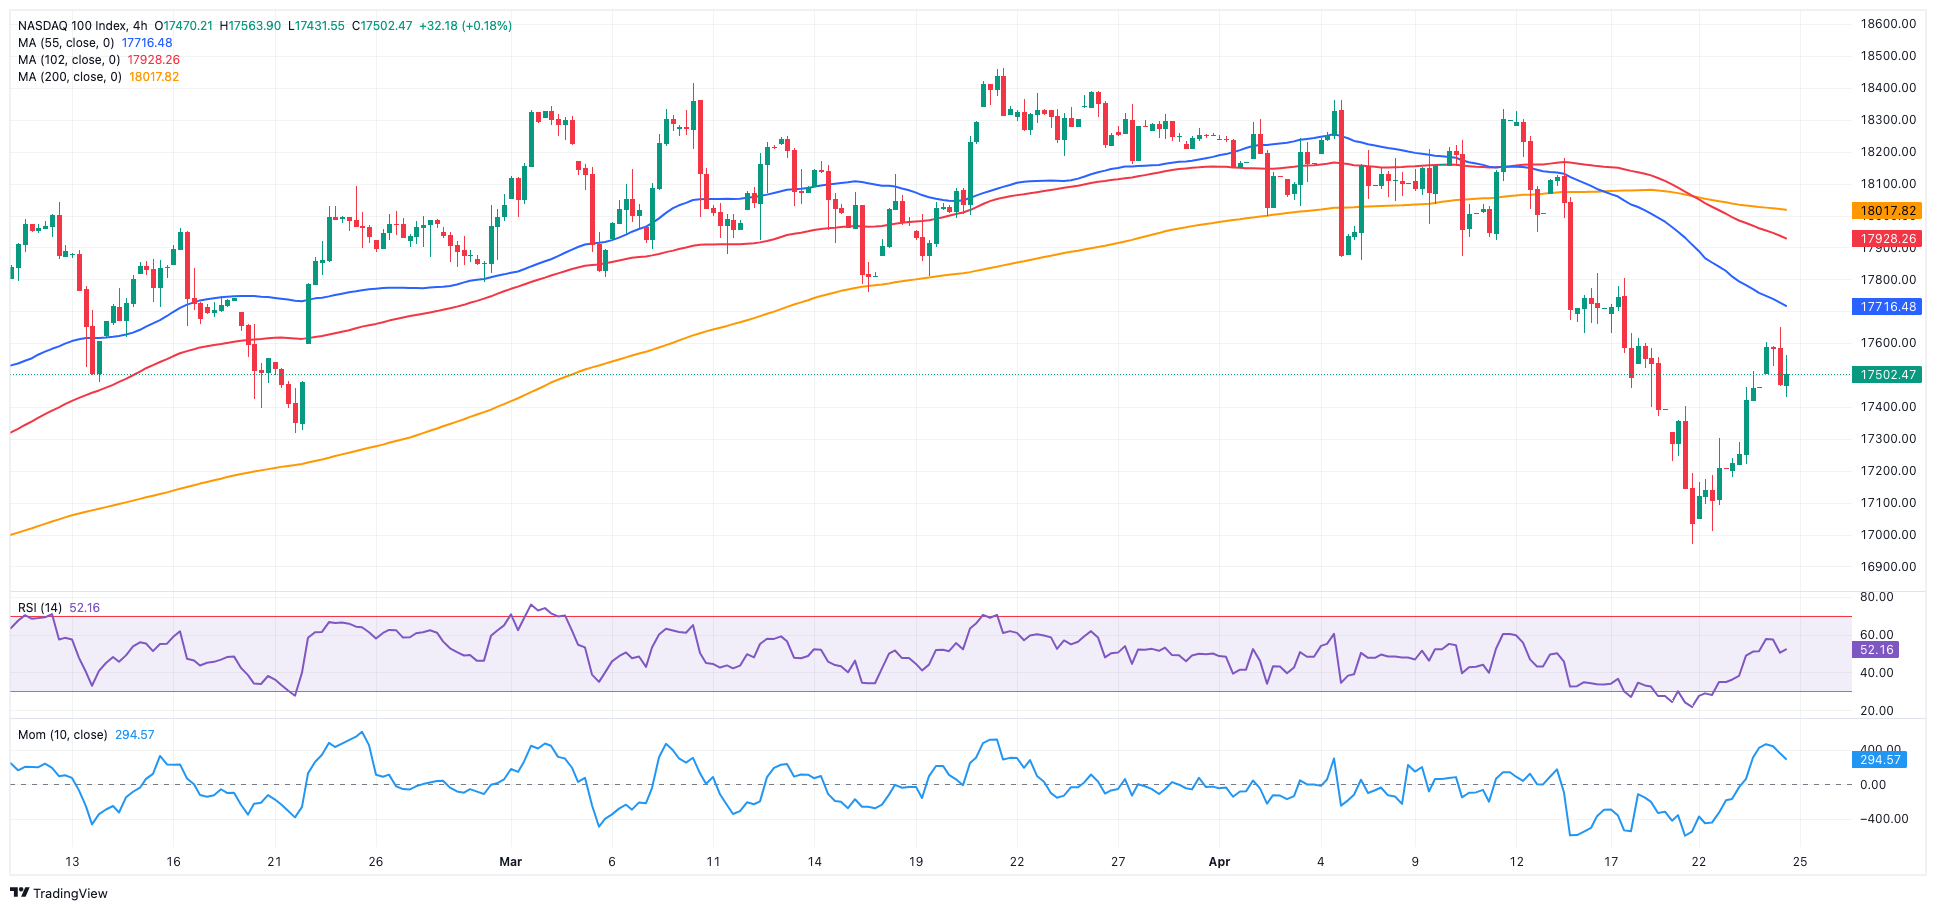
Unlike its other US peers, the tech benchmark Nasdaq 100 extended its weekly uptrend and surpassed the 17,600 level on Wednesday, up for the third consecutive session.
The firm performance of the US tech sector was propped up by the equally solid price action from carmaker Tesla, all ahead of the publication of further key earnings reports.
Additionally, further gains in the index came despite the robust bounce in the greenback and the move higher in US yields across the curve.
Extra gains are likely to target the provisional 55-day SMA of 17,929 before hitting the all-time high of 18,464 (March 21). Having said that, the April low of 16,973 (April 19) is projected to provide first resistance before the critical 200-day SMA of 16,301 and the 2024 bottom of 16,249 (January 5). Further losses may put the December 2023 low of 15,695 (December 4) to the test, followed by the October 2023 bottom of 14,058 (October 26), and the April 2023 low of 12,724 (April 25), all before the March 2023 low of 11,695 (March 13). The daily RSI recovered above 43.
Top Gainers: Tesla, CoStar, Texas Instruments
Top Losers: Old Dominion Freight Line, Netflix
Resistance levels: 17,653 18,337 18,464 (4H chart)
Support levels: 16,973 16,249 15,695 (4H chart)
DOW JONES
The US stock reference Dow Jones relinquished its early advance to trend downward, with declines in major technology stocks outweighing upbeat earnings across various sectors.
In the meantime, a cautious tone prevailed among market participants in anticipation of key US data releases (Q1 GDP and PCE) due later in the week as well as upcoming corporate earnings reports.
Also weighing on traders’ sentiment emerged the rebound in the greenback and the move higher in US yields.
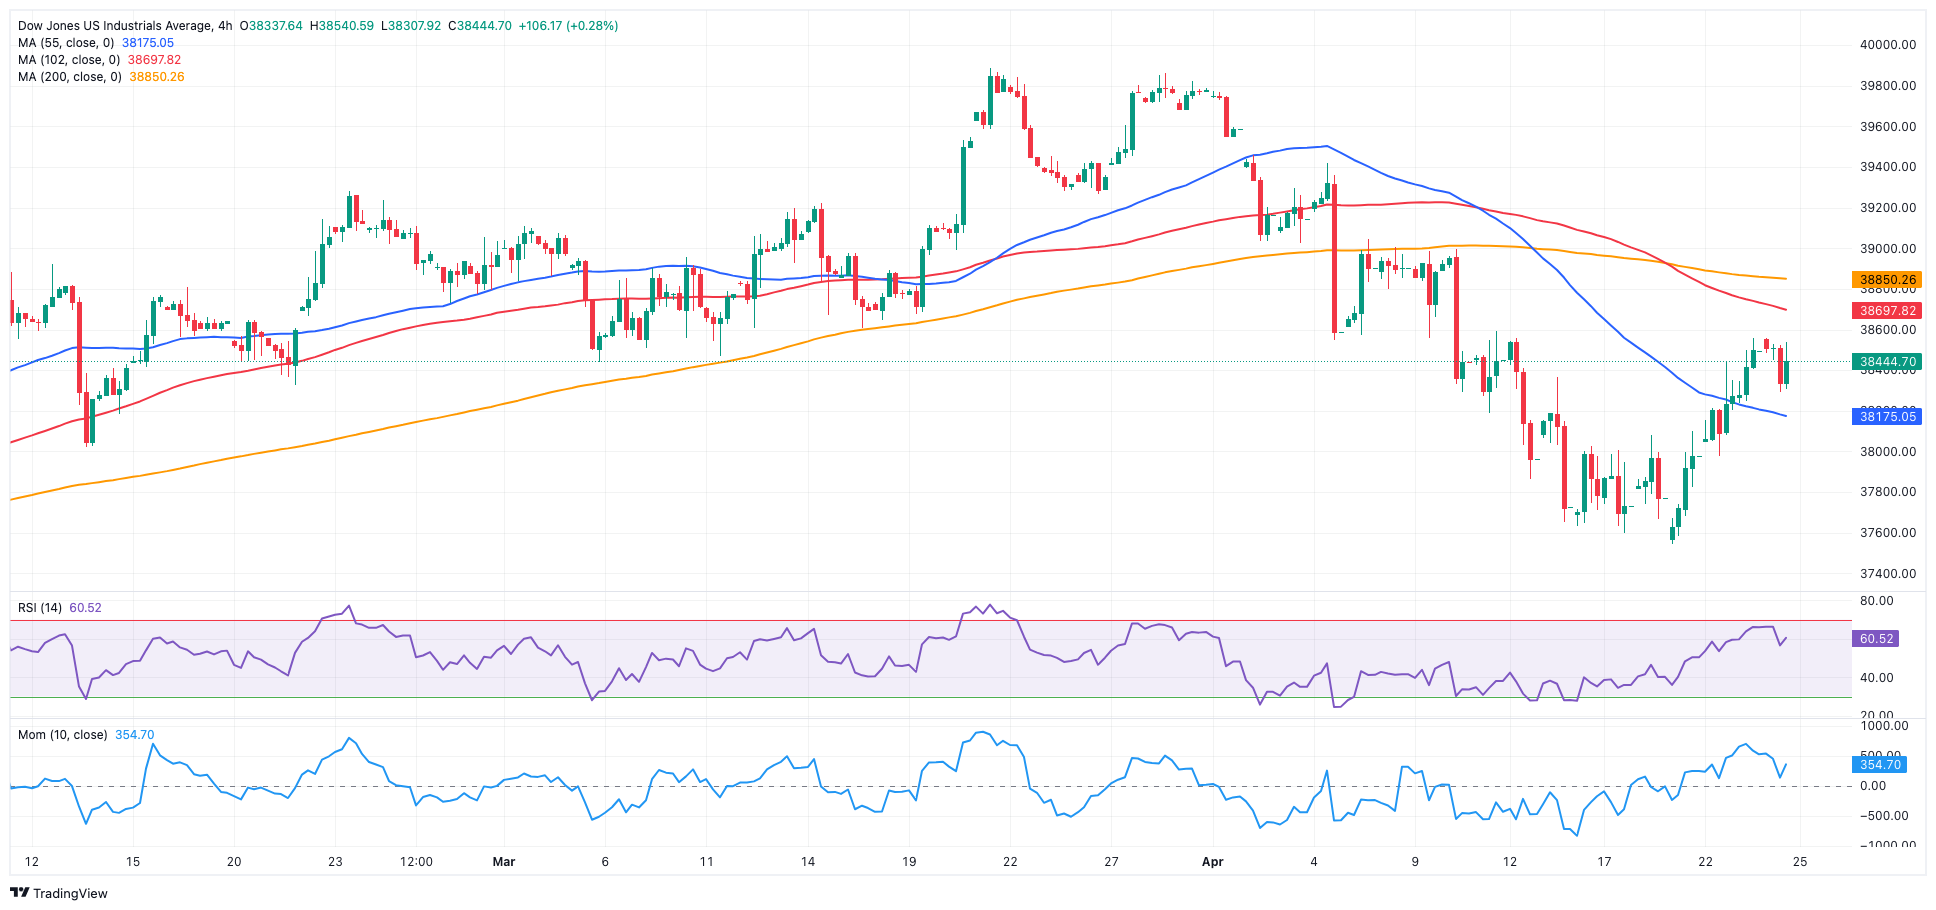
All in all, the Dow Jones retreated 0.14% to 38,449, the S&P 500 dropped 0.10% to 5,065, and the tech-heavy Nasdaq Composite rose 0.03% to 15,704.
Extra gains in the Dow Jones should challenge the transitory 55-day SMA of 38,786 ahead of the record high of 39,889 (March 21). Instead, the immediate contention is at the April low of 37,611 (April 17), prior to the 2024 bottom of 37,122 (January 18), and the key 200-day SMA of 36,282. The weekly low of 33,859 (November 7, 2023) is next, followed by the October 2023 low of 32,327 (October 27), all before the 2023 bottom of 31,429 (March 15). The daily RSI receded to around 38.
Top Performers: Intel, Coca-Cola, Apple
Worst Performers: Boeing, HomeDepot, Amazon.com
Resistance levels: 38,561 39,421 39,889 (4H chart)
Support levels: 37,611 37,122 36,010 (4H chart)
MACROECONOMIC EVENTS


